PASCUAL-GONZALEZ, Cristina
Available from Sheffield Hallam University Research Archive (SHURA) at:
http://shura.shu.ac.uk/18746/
This document is the author deposited version. You are advised to consult the publisher's version if you wish to cite from it.
Published version
PASCUAL-GONZALEZ, Cristina (2017). Processing-composition-structure effects on the optical band gap of KNbO3-based ceramics. Doctoral, Sheffield Hallam
University.
Copyright and re-use policy
APPENDICES
Processing-composition-structure effects on the
optical band gap of KNbO
3-based ceramics
Cristina Pascual-González
A thesis submitted in partial fulfilment of the requirements of
Sheffield Hallam University for the degree of Doctor of Philosophy
Contents
Volume II
APPENDIX A ... 4
A.1. Rietveld Refinements plots ... 4
A.2. EDX measurements ... 9
A.3. FWHM values for XRD peaks from 55º to 57º ... 11
APPENDIX B ... 14
B.1. Rietveld Refinements plots ... 14
B.2. EDX measurements ... 21
B.3. P-E and S-E loops ... 26
APPENDIX C ... 30
C.1. Rietveld Refinements plots ... 30
C.2. EDX measurements ... 35
APPENDIX D ... 41
D.1. Rietveld Refinements plots ... 41
D.2. EDX measurements ... 49
APPENDIX E ... 54
E.1. Rietveld Refinements plots ... 54
E.2. EDX measurements ... 57
APPENDIX F ... 66
F.1. Rietveld Refinements plots ... 66
F.2. EDX measurements ... 73
APPENDIX G ... 78
G.1. Rietveld Refinements plots ... 78
H.1. Publications and Scientific Results ... 87
H.1.1. Published papers ... 87
H.1.2. Chapter book ... 88
H.2. Attendance ... 88
H.2.1. Placements ... 88
H.2.2. Attended congresses ... 88
H.2.3. Summer Schools ... 89
H.3 Dissemination ... 89
H.3.1 Oral contributions as presenting author ... 89
APPENDIX A
Chapter 3: Processing and Characterisation of
KNbO
3ceramics
A.1. Rietveld Refinements plots
A.1.1. KNbO3
Figure A. 1.: Experimental X-ray diffraction data (red), calculated fitting profile (blue) and
difference plot for KNbO3.
Position [°2Theta] (Copper (Cu))
30 40 50 60 70
Counts
0 40000 160000
KN_1078_20to80xrdml 9533-ICSD 100.0 %
0 50 -50 100
-100 150
Atom Wyck. s.o.f. x y z Biso/ 10^4 pm^2
K1 2b 1.000000 0.500000 0.000000 0.528924 0.000000
Nb1 2a 1.000000 0.000000 0.000000 0.000000 0.000000
O1 2b 1.000000 0.500000 0.000000 -0.007275 0.000000
O2 4d 1.000000 0.000000 0.252400 0.335(5) 0.000000
Table A. 1 Occupancy, atomic fract. coordinates and Biso for KN
A.1.2. K0.95NbO2.975
Figure A. 2: Experimental X-ray diffraction data (red), calculated fitting profile (blue) and difference plot
for K0.95NbO2.975 and K4Nb6O17.
Position [°2Theta] (Copper (Cu))
30 40 50 60 70 80
Counts
0 10000 40000
K0.95N_1070-stripped 9533-ICSD 64.8 % 35030-ICSD 35.2 %
0 50
-50 100
Atom Wyck. s.o.f. x y z Biso/ 10^4 pm^2
K1 2b 0.950000 0.500000 0.000000 0.513800 0.000000
Nb1 2a 1.000000 0.000000 0.000000 0.000000 0.000000
O1 2b 1.000000 0.500000 0.000000 0.036400 0.000000
O2 4d 1.000000 0.000000 0.252400 0.284200 0.000000
Table A. 2: Occupancy, atomic fraction. coordinates and Biso for K0.95NbO2.975
Atom Wyck. s.o.f. x y z Biso/ 10^4 pm^2
Nb1 4a 1.000000 0.325900 0.298300 0.264600 2.100000
Nb2 4a 1.000000 0.174100 0.794100 0.272400 0.700000
Nb3 4a 1.000000 0.125200 0.244200 0.763500 1.100000
Nb4 4a 1.000000 0.127200 0.232500 0.279300 1.700000
Nb5 4a 1.000000 0.404600 0.363100 0.526300 1.300000
Nb6 4a 1.000000 0.049900 0.319800 0.026000 1.600000
K1 4a 1.000000 0.220900 0.348900 0.013000 0.700000
K2 4a 1.000000 0.217700 0.354700 0.515500 1.600000
K3 4a 1.000000 0.418100 0.166100 0.014500 1.400000
K4 4a 1.000000 0.021400 0.205200 0.518800 1.900000
O1 4a 1.000000 0.278100 0.222000 0.307700 3.200000
O2 4a 1.000000 0.227900 0.721400 0.250800 1.700000
O3 4a 1.000000 0.355500 0.002400 0.277700 0.100000
O4 4a 1.000000 0.153600 0.483800 0.283500 0.500000
O5 4a 1.000000 0.068000 0.328900 0.787400 0.100000
O6 4a 1.000000 0.068300 0.290000 0.278800 3.000000
O8 4a 1.000000 0.190200 0.084000 0.273700 3.600000
O9 4a 1.000000 0.390100 0.408200 0.283500 0.100000
O10 4a 1.000000 0.602600 0.572900 0.253100 2.800000
O11 4a 1.000000 0.120900 0.188800 0.024500 0.400000
O12 4a 1.000000 0.116900 0.218600 0.521300 2.400000
O13 4a 1.000000 0.042600 0.017000 0.000000 2.400000
O14 4a 1.000000 0.332400 0.267300 0.014600 1.900000
O15 4a 1.000000 0.343900 0.277000 0.503600 0.900000
O16 4a 1.000000 0.496000 0.125200 0.040400 2.400000
O17 4a 1.000000 0.073700 0.612600 0.042600 0.100000
Table A. 3: Occupancy, atomic fraction. coordinates and Biso for K4Nb6O17.
A.1.3. KNb0.95O3-δ
Figure A. 4.: Experimental X-ray diffraction data (red), calculated fitting profile (blue) and difference plot
for KNb0.95O2.875
Atom Wyck. s.o.f. x y z Biso/ 10^4 pm^2
K1 2b 1.000000 0.500000 0.000000 0.526955 0.000000
Nb1 2a 0.950000 0.000000 0.000000 0.000000 0.000000
O1 2b 1.000000 0.500000 0.000000 0.036871 0.000000
O2 4d 1.000000 0.000000 0.222768 0.267(6) 0.000000
Table A. 4.: Occupancy, atomic fraction. coordinates and Biso for KNb0.95O2.875
Position [°2Theta] (Copper (Cu))
30 40 50 60 70
Counts
0 40000 160000
KN0.95_1060-stripped 9533-ICSD 100.0 %
0 100 -100 200
-200 300
A.2. EDX measurements
A.2.1. KNbO3
K (%) Nb (%) K/Nb
50 50 1
Table A. 5: Theoretical K and Nb atomic percent for nominal KNbO3
Measurements K (%) Nb (%) K/Nb
1 52 48 1.073
2 52 48 1.063
3 51 49 1.058
4 51 49 1.053
5 51 49 1.048
6 51 49 1.043
7 51 49 1.033
8 51 49 1.023
9 50 50 1.018
10 50 50 1.009
11 49 51 0.963
A.2.2. K0.95NbO2.975
K (%) Nb (%) K/Nb
48 50 0.95
Table A. 7.: Atomic percent of K and Nb, for the nominal K0.95NbO2.975 composition.
Measurements K (%) Nb (%) K/Nb
1 54 46 1.170
2 54 46 1.155
3 53 47 1.134
4 52 48 1.103
5 52 48 1.063
6 51 49 1.038
7 47 53 0.901
8 47 53 0.901
9 47 53 0.901
10 46 54 0.861
11 42 58 0.713
12 40 60 0.655
Table A. 8: Experimental atomic percent of K and Nb by EDX spectra for K0.95NbO2.975.
A.2.3. KNb0.95O2.875
K (%) Nb (%) K/Nb
50 ~48 ~1.05
Measurements K (%) Nb (%) K/Nb
1 53 47 1.113
2 53 47 1.108
3 52 48 1.098
4 52 48 1.093
5 52 48 1.068
6 52 48 1.063
7 51 49 1.058
8 51 49 1.044
9 51 49 1.028
10 51 49 1.023
11 44 56 0.801
Table A. 10: Experimental atomic percent of K and Nb by EDX spectra for KNb0.95O2.875.
A.3. FWHM values for XRD peaks from 55º to 57º
Gaussian fitting permits to compare the FWHM values of the peaks from 55º to 57º
(Figure A. 5) even if the entire quadruplet could not be fitted for the patterns. The FWHM
values for K-excess compound (0.130º, 0.129º and 0.191º) are much lower than pure
55.5 56.0 56.5 57.0 57.5 Int en sity (a .u. )
2(º)
KNbO3
Fit Peak 1 Fit Peak 2
Cumulative Fit Peak
Model Gauss
Equation y=y0 + (A/(w*sqrt( PI/2)))*exp(-2*((x-xc)/w)^2) Reduced Chi-Sqr 6.47037E-6
Adj. R-Square 0.99104
Value Standard Error
Peak1(B) y0 1.96363E-5 9.63481E-5
Peak1(B) xc 55.93673 6.55707E-4
Peak1(B) w 0.23834 0.00138
Peak1(B) A 0.04935 2.45034E-4
Peak1(B) sigma 0.11917 6.88065E-4
Peak1(B) FWHM 0.28063 0.00162 Peak1(B) Height 0.16521 7.8575E-4
Peak2(B) y0 1.96363E-5 9.63481E-5
Peak2(B) xc 56.35773 7.96406E-4
Peak2(B) w 0.16123 0.00163
Peak2(B) A 0.02278 2.00584E-4
Peak2(B) sigma 0.08062 8.17065E-4
Peak2(B) FWHM 0.18983 0.00192 Peak2(B) Height 0.11274 9.46077E-4
(a)
55.5 56.0 56.5 57.0 57.5
Int
en
sity (a
.u.
)
2(º)
K0.95NbO2.975
Fit Peak 1 Fit Peak 2
Cumulative Fit Peak
Model Gauss
Equation y=y0 + (A/(w*sqrt(PI/2)))*exp(-2*((x-xc)/w)^2)
Reduced Chi-Sqr 1.67566E-5 Adj. R-Square 0.98871
Value Standard Error
Peak1(B) y0 0.28977 1.551E-4
Peak1(B) xc 55.94614 0.00182
Peak1(B) w 0.28819 0.0033
Peak1(B) A 0.08119 9.16014E-4
Peak1(B) sigma 0.14409 0.00165
Peak1(B) FWHM 0.33931 0.00388
Peak1(B) Height 0.22479 0.00119
Peak2(B) y0 0.28977 1.551E-4
Peak2(B) xc 56.27359 0.00359
Peak2(B) w 0.20457 0.00587
Peak2(B) A 0.02227 8.57425E-4
Peak2(B) sigma 0.10229 0.00294
Peak2(B) FWHM 0.24087 0.00691
Peak2(B) Height 0.08686 0.00182
55.5 56.0 56.5 57.0 57.5 Int en sity (a .u. )
2 (º)
KNb0.95O2.875
Fit Peak 1 Fit Peak 2 Fit Peak 3
Cumulative Fit Peak
Model Gauss
Equation y=y0 + (A/(w*sqrt(PI/2)))*exp(-2*((x-xc)/w)^2) Reduced Chi-Sqr 1.94285E-5
Adj. R-Square 0.98841
Value Standard Error
Peak1(B) y0 0.58039 3.86976E-4
Peak1(B) xc 55.83589 0.00119
Peak1(B) w 0.11049 0.00248
Peak1(B) A 0.01941 3.90251E-4
Peak1(B) sigma 0.05524 0.00124
Peak1(B) FWHM 0.13009 0.00292
Peak1(B) Height 0.14017 0.00202
Peak2(B) y0 0.58039 3.86976E-4
Peak2(B) xc 56.01526 0.00114
Peak2(B) w 0.10934 0.00237
Peak2(B) A 0.01992 3.86957E-4
Peak2(B) sigma 0.05467 0.00119
Peak2(B) FWHM 0.12874 0.00279
Peak2(B) Height 0.14537 0.00203
Peak3(B) y0 0.58039 3.86976E-4
Peak3(B) xc 56.38637 0.00158
Peak3(B) w 0.16219 0.00329
Peak3(B) A 0.01953 3.69019E-4
Peak3(B) sigma 0.08109 0.00165
Peak3(B) FWHM 0.19096 0.00388
Peak3(B) Height 0.09607 0.00165
(c)
Figure A. 5: Gaussian fitting for estimation of the FWHM of peaks from 55º to 57º for (a) KNbO3, (b)
K0.95NbO2.975 and (c) KNb0.95O2.875, suggesting a large degree of crystallisation in powders prepared with
APPENDIX B
Chapter 3:
System (1−x) KNbO
3-x(Ba
0.5Bi
0.5)(Zn
0.5Nb
0.5)O
3B.1. Rietveld Refinements plots
B.1.1. (1-x) KNbO3-x BaBiNbZnO3 (KBNN)
B.1.1.1. x=0.05
Figure B. 1.: Experimental X-ray diffraction data (red), calculated fitting profile (blue) and difference plot for KBNNZ x=0.05.
Position [°2Theta] (Cobalt (Co))
30 40 50 60 70 80
Counts
0 10000 40000
90000 Kbbnz_0.05_1100_20to80longkbbnz x=0.05 100.0 %
0 25 -25 50
Atom Wyck. s.o.f. x y z Biso/ 10^4 pm^2
K 2a 0.950000 0.000000 0.000000 0.000000 0.500000
Be 2a 0.025000 0.000000 0.000000 0.000000 0.500000
Bi 2a 0.025000 0.000000 0.000000 0.000000 0.500000
Nb 2b 0.925000 0.500000 0.000000 0.460680 0.500000
Zn 2b 0.025000 0.500000 0.000000 0.217439 0.500000
O 2a 1.000000 0.000000 0.000000 0.425334 0.500000
O 4e 1.000000 0.500000 0.215555 0.194157 0.500000
Table B. 1.: Occupancy, atomic fract. coordinates and Biso for orthorhombic KBBNZ x=0.05
B.1.1.2. x=0.10
Figure B. 2.: Experimental X-ray diffraction data (red), calculated fitting profile (blue) and difference plot
Position [°2Theta] (Cobalt (Co))
30 40 50 60 70 80
Counts
0 10000 40000
Kbbnz_0.10_1100_20to80long KBBNZ10_cubic 28.2 % KBBNZ10_orto 71.8 %
0 25
-25 50
Figure B. 3.: The pie chart represents the percent quantity of the two polymorphs (orthorhombic and cubic) for KBBNZ x=0.10.
Atom Wyck. s.o.f. x y z Biso/ 10^4 pm^2
K1 1a 0.900000 0.000000 0.000000 0.000000 0.020500
Nb1 1b 0.950000 0.500000 0.500000 0.500000 0.015490
O1 3c 1.000000 0.000000 0.500000 0.500000 1.339634
Bi 1a 0.050000 0.000000 0.000000 0.000000 0.020500
Ba 1a 0.050000 0.000000 0.000000 0.000000 0.020500
Zn 1b 0.050000 0.500000 0.500000 0.500000 0.015490
Table B. 2.: Occupancy, atomic fract. coordinates and Biso for cubic KBBNZ x=0.10
Atom Wyck. s.o.f. x y z Biso/ 10^4 pm^2
Nb1 2b 0.950000 0.500000 0.000000 0.514000 10.000000
O1 2a 1.000000 0.000000 0.000000 0.477600 10.000000
O2 4e 1.000000 0.500000 0.252400 0.229800 10.000000
Bi 2a 0.050000 0.000000 0.000000 0.000000 10.000000
Ba 2a 0.050000 0.000000 0.000000 0.000000 10.000000
Zn 2b 0.050000 0.500000 0.000000 0.514000 10.000000
Table B. 3.: Occupancy, atomic fract. coordinates and Biso for orthorhombic KBBNZ x=0.10
B.1.1.3. x=0.15
Figure B. 4.: Experimental X-ray diffraction data (red), calculated fitting profile (blue) and difference plot for KBNNZ x=0.15
Position [°2Theta] (Cobalt (Co))
30 40 50 60 70 80
Counts
0 10000 40000 90000
Kbbnz_0.15_1100_20to80long_2 190920-ICSD 71.5 % 9533-ICSD 28.5 %
0 25 -25 50
-50 75
Figure B. 5.: The pie chart represents the percent quantity of the two polymorphs (orthorhombic and cubic) for KBBNZ x=0.15.
Atom Wyck. s.o.f. x y z Biso/ 10^4 pm^2
K1 1b 0.850000 0.500000 0.500000 0.500000 0.020500
Nb1 1a 0.925000 0.000000 0.000000 0.000000 0.015490
O1 3d 1.000000 0.500000 0.000000 0.000000 0.000000
Ba 1b 0.075000 0.500000 0.500000 0.500000 0.020500
Bi 1b 0.075000 0.500000 0.500000 0.500000 0.020500
Zn 1a 0.075000 0.000000 0.000000 0.000000 0.015490
Table B. 4.: Occupancy, atomic fract. coordinates and Biso for cubic KBBNZ x=0.15
Atom Wyck. s.o.f. x y z Biso/ 10^4 pm^2
K1 2b 0.850000 0.500000 0.000000 0.513800 0.000000
O1 2b 1.000000 0.500000 0.000000 0.036400 0.000000
O2 4d 1.000000 0.000000 0.252400 0.284200 0.000000
Ba 2b 0.075000 0.500000 0.000000 0.513800 0.000000
Bi 2b 0.075000 0.500000 0.000000 0.513800 0.000000
zn 2a 0.075000 0.000000 0.000000 0.000000 0.000000
Table B. 5.: Occupancy, atomic fract. coordinates and Biso for orthorhombic KBBNZ x=0.15
B.1.1.4. x=0.20
Figure B. 6: Experimental X-ray diffraction data (red), calculated fitting profile (blue) and difference plot for KBNNZ x=0.20
Atom Wyck. s.o.f. x y z Biso/ 10^4 pm^2
Position [°2Theta] (Cobalt (Co))
30 40 50 60 70 80
Counts
0 10000 40000 90000
Kbbnz_0.20_1100_20to80long 190920-ICSD 100.0 %
0 25 -25 50
-50 75
Nb1 1a 0.900000 0.000000 0.000000 0.000000 0.015490
O1 3d 1.000000 0.500000 0.000000 0.000000 0.000000
Ba 1b 0.100000 0.500000 0.500000 0.500000 0.020500
bi 1b 0.100000 0.500000 0.500000 0.500000 0.020500
zn 1a 0.100000 0.000000 0.000000 0.000000 0.015490
Table B. 6.: Occupancy, atomic fract. coordinates and Biso for cubic KBBNZ x=0.05
B.1.1.5 x=0.25
Figure B. 7 Experimental X-ray diffraction data (red), calculated fitting profile (blue) and difference plot for KBNNZ x=0.25.
Atom Wyck. s.o.f. x y z Biso/ 10^4 pm^2
K 1a 0.750000 0.000000 0.000000 0.000000 0.500000
Position [°2Theta] (Cobalt (Co))
30 40 50 60 70 80
Counts
0 10000 40000 90000
Kbbnz_0.25_1100_20to80long kbbnz x=0.25 100.0 %
0 100
-100 200
Bi 1a 0.125000 0.000000 0.000000 0.000000 0.500000
Nb 1b 0.875000 0.500000 0.500000 0.450222 0.500000
Zn 1b 0.125000 0.500000 0.500000 0.517100 0.500000
O 1b 1.000000 0.500000 0.500000 -0.026000 0.500000
O 2c 1.000000 0.000000 0.500000 0.406751 0.500000
Table B. 7.: Occupancy, atomic fract. coordinates and Biso for cubic KBBNZ x=0.25
B.2. EDX measurements
B.2.1. (1-x) KNbO3-x BaBiNbZnO3 (KNBBZ)
B.2.1.1 x=0.05
K (%) Nb (%) Ba (%) Bi (%) Zn (%) K/Nb K/Ba K/Bi K/Zn
47.5 48.75 1.25 1.25 1.25 0.974 38 38 38
Table B. 8.: Atomic percent of K, Nb, Ba, Bi, Zn and molar relations for the nominal KNBBZ x=0.05composition.
K (%) Nb (%) Ba (%) Bi (%) Zn (%) K/Nb K/Ba K/Bi K/Zn
1 51.82 46.82 0.54 0.56 0.26 1.107 96 84 199
2 50.68 46.59 1.11 1.28 0.34 1.088 46 36 149
3 49.73 47.03 1.29 1.47 0.47 1.057 39 32 106
4 50.75 46.64 1.06 1.05 0.50 1.088 48 44 102
5 49.35 46.97 1.78 1.38 0.52 1.051 28 34 95
6 49.75 47.32 1.30 1.07 0.56 1.051 38 44 89
7 49.94 47.66 1.00 0.84 0.57 1.048 50 57 88
9 47.33 49.22 1.95 0.95 0.56 0.962 24 52 85
10 49.75 46.83 1.53 1.29 0.60 1.062 33 36 83
11 50.34 46.98 0.95 1.07 0.67 1.072 53 44 75
12 44.11 49.72 3.57 1.97 0.64 0.887 12 25 69
13 48.49 47.26 1.73 1.61 0.90 1.026 28 29 54
14 49.55 46.69 1.19 1.12 1.46 1.061 42 42 34
Table B. 9.: Experimental atomic percent of K, Nb, Ba, Bi, Zn and molar relations for KNBBZ x=0.05 composition by EDX spectra.
B.2.1.2. x=0.10
K (%) Nb (%) Ba (%) Bi (%) Zn (%) K/Nb K/Ba K/Bi K/Zn
45 47.5 2.5 2.5 2.5 0.947 18 18 18
Table B. 10.: Atomic percent of K, Nb, Ba, Bi, Zn and molar relations for the nominal KNBBZ x=0.10 composition.
K (%) Nb (%) Ba (%) Bi (%) Zn (%) K/Nb K/Ba K/Bi K/Zn
1 30.37 55.72 9.61 4.29 0.00 0.545 3 7 -
2 51.84 45.84 0.64 1.53 0.16 1.131 81 34 324
3 29.99 55.54 10.20 4.06 0.21 0.540 3 7 143
4 39.43 50.62 6.17 3.27 0.50 0.779 6 12 79
5 50.63 45.93 1.45 1.22 0.77 1.102 35 42 66
6 50.58 46.07 1.57 0.75 1.02 1.098 32 67 50
7 28.74 55.09 10.88 4.65 0.64 0.522 3 6 45
9 34.92 52.83 8.01 3.31 0.94 0.661 4 11 37
10 49.39 45.74 1.60 1.76 1.51 1.080 31 28 33
11 49.77 45.00 1.87 1.81 1.56 1.106 27 27 32
12 23.99 57.30 13.16 4.79 0.76 0.419 2 5 32
13 49.77 46.02 1.00 1.29 1.93 1.081 50 39 26
14 48.59 45.21 1.79 2.19 2.23 1.075 27 22 22
15 46.86 44.88 3.38 2.43 2.46 1.044 14 19 19
16 32.69 53.33 7.58 4.52 1.88 0.613 4 7 17
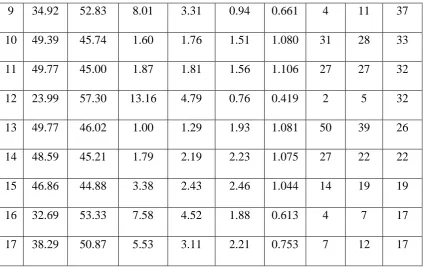
[image:24.595.87.511.68.335.2]17 38.29 50.87 5.53 3.11 2.21 0.753 7 12 17
Table B. 11.: Experimental atomic percent of K, Nb, Ba, Bi, Zn and molar relations for the nominal KNBBZ x=0.10 composition by EDX spectra.
B.2.1.3. x=0.15
K (%) Nb (%) Ba (%) Bi (%) Zn (%) K/Nb K/Ba K/Bi K/Zn
42.5 46.25 3.75 3.75 3.75 0.919 11.333 11.333 11.333
Table B. 12.: Atomic percent of K, Nb, Ba, Bi, Zn and molar relations for the nominal KNBBZ x=0.15composition.
K (%) Nb (%) Ba (%) Bi (%) Zn (%) K/Nb K/Ba K/Bi K/Zn
1 46.73 45.58 2.78 2.71 2.21 1.025 17 17 21
2 47.06 45.04 2.7 2.8 2.41 1.045 17 17 20
3 45.78 45.24 3.14 3.27 2.57 1.012 15 14 18
4 45.78 45.24 3.14 3.27 2.57 1.012 15 14 18
5 45.52 45.06 3.13 3.56 2.72 1.010 15 13 17
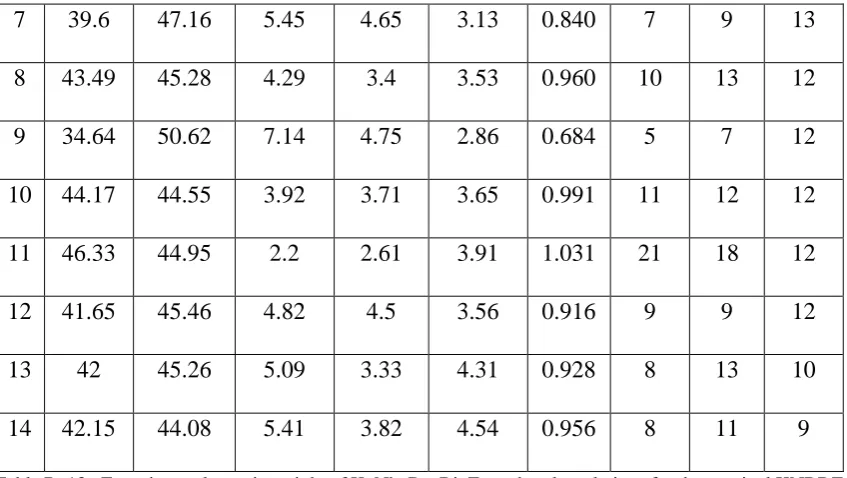
7 39.6 47.16 5.45 4.65 3.13 0.840 7 9 13
8 43.49 45.28 4.29 3.4 3.53 0.960 10 13 12
9 34.64 50.62 7.14 4.75 2.86 0.684 5 7 12
10 44.17 44.55 3.92 3.71 3.65 0.991 11 12 12
11 46.33 44.95 2.2 2.61 3.91 1.031 21 18 12
12 41.65 45.46 4.82 4.5 3.56 0.916 9 9 12
13 42 45.26 5.09 3.33 4.31 0.928 8 13 10
[image:25.595.88.512.69.308.2]14 42.15 44.08 5.41 3.82 4.54 0.956 8 11 9
Table B. 13.: Experimental atomic weight of K, Nb, Ba, Bi, Zn and molar relations for the nominal KNBBZ x=0.15 composition by EDX spectra.
B.2.1.4 x=0.20
K (%) Nb (%) Ba (%) Bi (%) Zn (%) K/Nb K/Ba K/Bi K/Zn
40 45 5 5 5 0.889 8 8 8
Table B. 14.: Atomic percent of K, Nb, Ba, Bi, Zn and molar relations for the nominal KNBBZ x=0.20 composition.
K (%) Nb (%) Ba (%) Bi (%) Zn (%) K/Nb K/Ba K/Bi K/Zn
1 43.46 44.12 4.34 4.74 3.34 0.985 10 9 13
2 42.93 43.54 4.73 4.9 3.90 0.986 9 9 11
3 43.10 43.58 3.89 5.43 4.00 0.989 11 8 11
4 42.24 43.71 5.00 4.99 4.06 0.966 8 8 10
5 42.16 43.82 4.66 5.2 4.15 0.962 9 8 10
6 41.76 43.76 5.13 5.13 4.22 0.954 8 8 10
8 41.31 43.63 5.73 4.95 4.39 0.947 7 8 9
9 40.62 44.09 5.38 5.36 4.55 0.921 8 8 9
10 39.93 43.78 5.7 5.6 4.98 0.912 7 7 8
Table B. 15.: Experimental atomic percent of K, Nb, Ba, Bi, Zn and molar relations for the nominal KNBBZ x=0.20 composition by EDX spectra.
B.2.1.5. x=0.25
K (%) Nb (%) Ba (%) Bi (%) Zn (%) K/Nb K/Ba K/Bi K/Zn
[image:26.595.89.514.365.747.2]37.5 43.75 6.25 6.25 6.25 0.857 6 6 6
Table B. 16.: Atomic percent of K, Nb, Ba, Bi, Zn and molar relations for the nominal KNBBZ x=0.25 composition.
K (%) Nb (%) Ba (%) Bi (%) Zn (%) K/Nb K/Ba K/Bi K/Zn
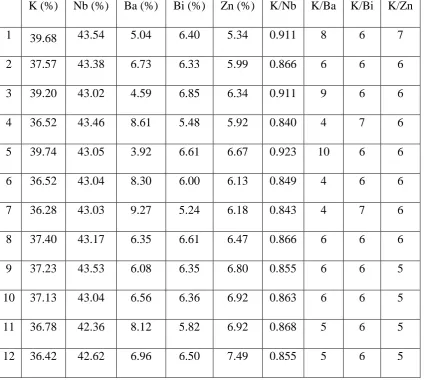
1 39.68 43.54 5.04 6.40 5.34 0.911 8 6 7
2 37.57 43.38 6.73 6.33 5.99 0.866 6 6 6
3 39.20 43.02 4.59 6.85 6.34 0.911 9 6 6
4 36.52 43.46 8.61 5.48 5.92 0.840 4 7 6
5 39.74 43.05 3.92 6.61 6.67 0.923 10 6 6
6 36.52 43.04 8.30 6.00 6.13 0.849 4 6 6
7 36.28 43.03 9.27 5.24 6.18 0.843 4 7 6
8 37.40 43.17 6.35 6.61 6.47 0.866 6 6 6
9 37.23 43.53 6.08 6.35 6.80 0.855 6 6 5
10 37.13 43.04 6.56 6.36 6.92 0.863 6 6 5
11 36.78 42.36 8.12 5.82 6.92 0.868 5 6 5
13 35.68 42.57 9.30 5.06 7.40 0.838 4 7 5
14 36.08 42.46 7.87 5.73 7.86 0.850 5 6 5
[image:27.595.94.474.276.552.2]15 35.48 42.39 7.82 6.00 8.31 0.837 5 6 4
Table B. 17.: Experimental atomic percent of K, Nb, Ba, Bi, Zn and molar relations for the nominal KNBBZ x=0.25 composition by EDX spectra.
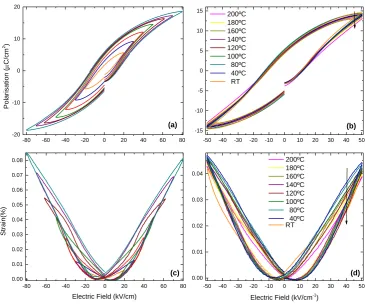
B.3. P-E and S-E loops
-80 -60 -40 -20 0 20 40 60 80 -20 -10 0 10 20
-50 -40 -30 -20 -10 0 10 20 30 40 50 -15 -10 -5 0 5 10 15
-80 -60 -40 -20 0 20 40 60 80 0.00 0.01 0.02 0.03 0.04 0.05 0.06 0.07 0.08
-50 -40 -30 -20 -10 0 10 20 30 40 50 0.00 0.01 0.02 0.03 0.04 P o lari s a tion ( C/c m 2) (a) 200ºC 180ºC 160ºC 140ºC 120ºC 100ºC 80ºC 40ºC RT (b) S tr a in(%)
Electric Field (kV/cm)
(c) RT 200ºC 180ºC 160ºC 140ºC 120ºC 100ºC 80ºC 40ºC
Electric Field (kV/cm-1
)
[image:28.595.100.466.79.383.2](d)
-80 -60 -40 -20 0 20 40 60 80 -6 -4 -2 0 2 4 6 Polarisa tion ( C/cm 2) (a)
-80 -60 -40 -20 0 20 40 60 80 0.000 0.005 0.010 0.015 0.020 Strain (%) (c)
-40 -20 0 20 40 -6 -4 -2 0 2 4
6 RT 40ºC 80ºC 100ºC 140ºC 180ºC (c)
-40 -20 0 20 40 0.000
0.002 0.004 0.006 0.008
[image:29.595.101.489.89.406.2]0.010 RT 40ºC 80ºC 100ºC 140ºC 180ºC (d)
Figure B. 10: (a) P-E and (c) S-E loops up to 80 kV/cm at RT. (b) P-E and (d) S-E loops from RT up to 200º under electric field of 50 kV/cm for KBBNZ x=0.05 at 1 Hz.
-80 -60 -40 -20 0 20 40 60 80 0.000 0.005 0.010 0.015 0.020 0.025 0.030 0.035 0.040 Strain (%)
Electric Field (kV/cm)
(c)
-80 -60 -40 -20 0 20 40 60 80 -10 -8 -6 -4 -2 0 2 4 6 8 10 Polar isatio n ( C/cm 2)
-50 -40 -30 -20 -10 0 10 20 30 40 50 -8 -6 -4 -2 0 2 4 6
8 RT
40ºC 80ºC 100ºC 140ºC 180ºC (b)
-50 -40 -30 -20 -10 0 10 20 30 40 50 0.000 0.005 0.010 0.015 0.020 0.025 RT 40ºC 80ºC 100ºC 140ºC 180ºC
[image:29.595.103.499.459.750.2]-80 -60 -40 -20 0 20 40 60 80 -3 -2 -1 0 1 2 3
-40 -20 0 20 40 -2.0 -1.5 -1.0 -0.5 0.0 0.5 1.0 1.5 2.0 -0.001 0.000 0.001 0.002 -0.001 0.000 0.001 0.002 0.003 P o lari s a tion ( C/c m 2) RT 40ºC 80ºC 100ºC 140ºC 180ºC S tr a in ( %) (b) (a) (c) (d) RT 40ºC 80ºC 100ºC 140ºC 180ºC
-80 -60 -40 -20 0 20 40 60 80 -4 -2 0 2 4 Polar isatio n ( C/cm 2) (a)
-80 -60 -40 -20 0 20 40 60 80 0.000 0.002 0.004 0.006 0.008 Strain (%)
Electric Field (kV/cm)
(c)
-40 -20 0 20 40 -4 -3 -2 -1 0 1 2 3 4 RT 40ºC 80ºC 100ºC 140ºC 180ºC (b)
-40 -20 0 20 40 0.0000 0.0005 0.0010 0.0015 0.0020 0.0025 0.0030 0.0035
0.0040 RT
40ºC 80ºC 100ºC 140ºC 180ºC
Electric Field (kV/cm)
[image:30.595.98.490.96.396.2](d)
[image:30.595.101.493.449.753.2]APPENDIX C
Chapter 5: System (1-x) KNbO
3- x BiFeO
3C.1. Rietveld Refinements plots
C.1.1. (1-x) KNbO3- x BiFeO3
C.1.1.1. x=0.05
Figure C. 1.: Experimental X-ray diffraction data (red), calculated fitting profile (blue) and difference plot for KNBF x=0.05.
Position [°2Theta] (Cobalt (Co))
30 40 50 60 70 80
Counts
0 10000 40000 90000
knbf_0.05_20to80_long knbf x=0.05 100.0 %
0 25 -25 50
-50 75
Atom Wyck. s.o.f. x y z Biso/ 10^4 pm^2
K 2a 0.950000 0.000000 0.000000 0.000000 0.500000
Bi 2a 0.050000 0.000000 0.000000 0.000000 0.500000
Nb 2b 0.950000 0.500000 0.000000 0.5435(9) 0.500000
Fe 2b 0.050000 0.500000 0.000000 0.515500 0.500000
O 2a 1.000000 0.000000 0.000000 0.481000 0.500000
[image:32.595.84.512.321.696.2]O 4e 1.000000 0.500000 0.284807 0.288864 0.500000
Table C. 1.: Occupancy, atomic fract. coordinates and Biso for orthorhombic KNBF x=0.05
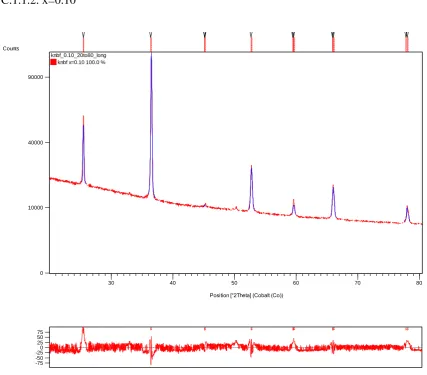
C.1.1.2. x=0.10
Figure C. 2.: Experimental X-ray diffraction data (red), calculated fitting profile (blue) and difference plot for KNBF x=0.10.
Position [°2Theta] (Cobalt (Co))
30 40 50 60 70 80
Counts
0 10000 40000 90000
knbf_0.10_20to80_long knbf x=0.10 100.0 %
0 25 -25 50
-50 75
Atom Wyck. s.o.f. x y z Biso/ 10^4 pm^2
K 2a 0.900000 0.000000 0.000000 0.000000 0.500000
Bi 2a 0.100000 0.000000 0.000000 0.000000 0.500000
Nb 2b 0.900000 0.500000 0.000000 0.529697 0.500000
Fe 2b 0.100000 0.500000 0.000000 0.515500 0.500000
O 2a 1.000000 0.000000 0.000000 0.481000 0.500000
[image:33.595.89.512.317.671.2]o 4e 1.000000 0.500000 0.717720 0.272945 0.500000
Table C. 2.: Occupancy, atomic fract. coordinates and Biso for orthorhombic KNBF x=0.10
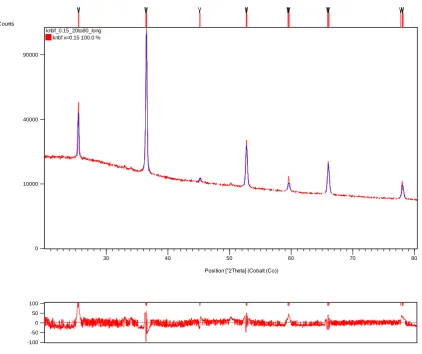
C.1.1.3. X=0.15
Figure C. 3.: Experimental X-ray diffraction data (red), calculated fitting profile (blue) and difference plot for KNBF x=0.15.
Position [°2Theta] (Cobalt (Co))
30 40 50 60 70 80
Counts
0 10000 40000 90000
knbf_0.15_20to80_long knbf x=0.15 100.0 %
0 50
-50 100
K 2a 0.850000 0.000000 0.000000 0.000000 0.500000
Bi 2a 0.150000 0.000000 0.000000 0.000000 0.500000
Nb 2b 0.850000 0.500000 0.000000 0.537619 0.500000
Fe 2b 0.150000 0.500000 0.000000 0.515500 0.500000
0 2a 1.000000 0.000000 0.000000 0.481000 0.500000
[image:34.595.104.508.297.668.2]o 4e 1.000000 0.500000 0.296350 0.279225 0.500000
Table C. 3.: Occupancy, atomic fract. coordinates and Biso for orthorhombic KNBF x=0.15.
C.1.1.4. X=0.20
Figure C. 4.: Experimental X-ray diffraction data (red), calculated fitting profile (blue) and difference plot for KNBF x=0.20.
Position [°2Theta] (Cobalt (Co))
30 40 50 60 70
Counts
0 10000 40000 90000
knbf_0.20_20to80_long knbf x=0.20 100.0 %
0 25 -25 50
-50 75
K 2a 0.800000 0.000000 0.000000 0.000000 0.500000
Bi 2a 0.200000 0.000000 0.000000 0.000000 0.500000
Nb 2b 0.800000 0.500000 0.000000 0.566504 0.500000
Fe 2b 0.200000 0.500000 0.000000 0.515500 0.500000
O 2a 1.000000 0.000000 0.000000 0.481000 0.500000
[image:35.595.87.509.291.671.2]o 4e 1.000000 0.500000 0.305515 0.313098 0.500000
Table C. 4.: Occupancy, atomic fract. coordinates and Biso for orthorhombic KNBF x=0.20
C.1.1.5 X=0.25
Figure C. 5.: Experimental X-ray diffraction data (red), calculated fitting profile (blue) and difference plot for KNBF x=0.25.
Position [°2Theta] (Cobalt (Co))
30 40 50 60 70
Counts
0 10000 40000
90000 knbf_0.25_20to80_long knbf x=0.25 100.0 %
0 50
-50 100
k 2a 0.750000 0.000000 0.000000 0.000000 0.500000
Bi 2a 0.250000 0.000000 0.000000 0.000000 0.500000
Nb 2b 0.750000 0.500000 0.000000 0.538650 0.500000
Fe 2b 0.250000 0.500000 0.000000 0.515500 0.500000
O 2a 1.000000 0.000000 0.000000 0.481000 0.500000
O 4e 1.000000 0.500000 0.252700 0.229800 0.500000
Table C. 5.: Occupancy, atomic fract. coordinates and Biso for orthorhombic KNBF x=0.25.
C.2. EDX measurements
C.2.1. (1-x) KNbO3- x BiFeO3
C.2.1.1. x=0.05
K(%) Nb(%) Bi(%) Fe(%) K/Nb K/Bi K/Fe
[image:36.595.110.488.474.768.2]47.5 47.5 2.5 2.5 1 19 19
Table C. 6.: Atomic weight of K, Nb, Bi, Fe and molar relations for the nominal KNBF x=0.05composition.
K(%) Nb(%) Bi(%) Fe(%) K/Nb K/Bi K/Fe
1 48.90 49.90 4.70 0.50 0.980 10 98
2 44.90 48.00 1.30 0.80 0.935 35 56
3 47.50 48.60 1.50 1.10 0.977 32 43
4 38.10 50.80 1.40 1.10 0.750 27 35
5 46.60 50.80 1.40 1.10 0.917 33 42
6 44.80 48.60 1.50 1.10 0.922 30 41
7 47.20 48.40 3.00 1.10 0.975 16 43
8 46.60 49.30 3.00 1.50 0.945 16 31
10 47.20 48.60 2.40 1.80 0.971 20 26
11 38.80 48.60 2.40 1.80 0.798 16 22
12 44.90 48.00 2.80 2.10 0.935 16 21
13 47.10 48.00 2.90 2.30 0.981 16 20
14 48.90 47.00 4.40 2.40 1.040 11 20
15 50.00 45.90 3.70 3.00 1.089 14 17
16 46.20 44.20 5.60 3.20 1.045 8 14
17 47.00 47.30 4.50 3.40 0.994 10 14
18 47.40 47.30 4.50 3.40 1.002 11 14
19 48.10 45.80 5.60 3.70 1.050 9 13
20 46.20 45.50 10.80 5.60 1.015 4 8
Table C. 7.: Experimental atomic weight of K, Nb, Bi, Fe and molar relations for KNBF x=0.05 composition by EDX spectra.
C.2.1.2. x=0.10
K(%) Nb(%) Bi(%) Fe(%) K/Nb K/Bi K/Fe
[image:37.595.106.490.68.393.2]45 45 5 5 1 9 9
Table C. 8.: Atomic weight of K, Nb, Bi, Fe and molar relations for the nominal KNBF x=0.10 composition
K(%) Nb(%) Bi(%) Fe(%) K/Nb K/Bi K/Fe
1 48.4 47.4 3.4 0.8 1.021 14 61
2 47.8 49.1 1.7 1.5 0.974 28 32
3 46 48.9 3.6 1.5 0.941 13 31
4 46.7 47.1 4.3 1.9 0.992 11 25
[image:37.595.111.488.563.772.2]7 45.6 49.1 2.7 2.7 0.929 17 17
8 46.1 45.9 5.1 3 1.004 9 15
9 45.1 46.1 5.5 3.2 0.978 8 14
10 50.5 36.5 9.3 3.7 1.384 5 14
11 43.9 47.9 4.2 4 0.916 10 11
12 43.4 47.8 4.4 4.4 0.908 10 10
13 43.1 45.8 6.4 4.6 0.941 7 9
14 45 44.4 5.6 5.1 1.014 8 9
15 39.2 41.5 10 9.3 0.945 4 4
16 37.2 34.6 15.5 12.8 1.075 2 3
17 38.5 35.7 12.1 13.6 1.078 3 3
Table C. 9.: Experimental atomic weight of K, Nb, Bi, Fe and molar relations for KNBF x=0.10 composition by EDX spectra.
C.2.1.3. x=0.15
K(%) Nb(%) Bi(%) Fe(%) K/Nb K/Bi K/Fe
42.5 42.5 7.5 7.5 1 5.67 5.67
Table C. 10.: Atomic weight of K, Nb, Bi, Fe and molar relations for the nominal KNBF x=0.15 composition.
K(%) Nb(%) Bi(%) Fe(%) K/Nb K/Bi K/Fe
1 45.8 46.8 5 2.3 0.979 9 20
2 44.4 47.2 5.6 2.7 0.941 8 16
3 47.5 46.3 3.3 3 1.026 14 16
4 47 45.4 4.6 3.1 1.035 10 15
[image:38.595.107.490.68.392.2]6 43.2 47.8 5.6 3.5 0.904 8 12
7 43.3 45.1 6.8 4.8 0.960 6 9
8 43.4 43.3 8 5.3 1.002 5 8
9 42.4 43 6.8 7.7 0.986 6 6
10 42.4 43 6.8 7.7 0.986 6 6
11 38.8 42.3 10.2 8.7 0.917 4 4
12 39.7 38.5 11.1 10.7 1.031 4 4
13 37.9 37.7 12.5 11.9 1.005 3 3
14 37.2 36.4 13.2 13.1 1.022 3 3
15 35.9 32.5 16.5 15.1 1.105 2 2
16 20.8 24.8 30.6 23.8 0.839 1 1
Table C. 11.: Experimental atomic weight of K, Nb, Bi, Fe and molar relations for KNBF x=0.15 composition by EDX spectra.
C.2.1.4. x=0.20
K(%) Nb(%) Bi(%) Fe(%) K/Nb K/Bi K/Fe
40 40 10 10 1 4 4
Table C. 12.: Atomic weight of K, Nb, Bi, Fe and molar relations for the nominal KNBF x=0.20 composition.
K(%) Nb(%) Bi(%) Fe(%) K/Nb K/Bi K/Fe
1 44.90 46.90 5.00 3.20 0.957 9 14
2 46.10 43.70 5.80 4.40 1.055 8 10
3 44.50 44.60 6.30 4.70 0.998 7 9
4 44.50 44.60 6.30 4.70 0.998 7 9
5 42.30 46.90 6.00 4.80 0.902 7 9
[image:39.595.106.491.68.392.2]7 44.30 41.60 7.50 6.50 1.065 6 7
8 41.60 44.30 7.50 6.50 0.939 6 6
9 40.40 41.50 11.40 6.70 0.973 4 6
10 42.30 41.80 8.70 7.20 1.012 5 6
11 41.40 41.20 10.00 7.40 1.005 4 6
12 39.20 40.10 13.30 7.40 0.978 3 5
13 39.30 40.40 11.90 8.50 0.973 3 5
14 40.60 38.70 11.40 9.30 1.049 4 4
15 40.60 38.70 11.40 9.30 1.049 4 4
16 39.70 38.50 11.10 10.70 1.031 4 4
17 32.40 36.10 18.50 12.90 0.898 2 3
18 32.60 31.30 20.50 15.50 1.042 2 2
Table C. 13.: Experimental atomic weight of K, Nb, Bi, Fe and molar relations for KNBF x=0.20 composition by EDX spectra.
C.2.1.5. x=0.25
K(%) Nb(%) Bi(%) Fe(%) K/Nb K/Bi K/Fe
37.5 37.5 12.5 12.5 1 3 3
Table C. 14.: Atomic weight of K, Nb, Bi, Fe and molar relations for the nominal KNBF x=0.25 composition
K(%) Nb(%) Bi(%) Fe(%) K/Nb K/Bi K/Fe
1 44.4 45.3 6.8 3.6 0.980 7 12
2 42 39.5 12.4 6.1 1.063 3 7
[image:40.595.104.491.66.421.2]4 41.4 41.2 10 7.4 1.005 4 6
5 36.2 42.9 13.9 7.1 0.844 3 5
6 40.5 40.4 10.5 8.5 1.002 4 5
7 39.3 40.4 11.9 8.5 0.973 3 5
8 39.7 38.5 11.1 10.7 1.031 4 4
9 39.7 36.7 12 11.7 1.082 3 3
10 33.3 41.7 14.4 10.6 0.799 2 3
11 34.6 37 15.9 12.6 0.935 2 3
12 33.7 37.2 16.5 12.7 0.906 2 3
13 34 34.7 17.4 13.9 0.980 2 2
14 33.8 35.4 15.5 15.2 0.955 2 2
15 32.9 36.1 15.9 15.1 0.911 2 2
16 32.6 31.3 20.5 15.5 1.042 2 2
17 30 38.4 17 14.6 0.781 2 2
18 30.4 32.7 19.4 17.5 0.930 2 2
19 29.5 29.6 21.4 19.5 0.997 1 2
20 27.5 27 23.5 22.1 1.019 1 1
21 26.3 23.8 27.3 22.6 1.105 1 1
APPENDIX D
Chapter 6: System (1-x) KNbO
3- x BiMnO
3D.1. Rietveld Refinements plots
D.1.1. (1-x) KNbO3- x BiMnO3
[image:42.595.85.509.306.687.2]D.1.1.1. x=0.05
Figure D. 1.: Experimental X-ray diffraction data (red), calculated fitting profile (blue) and difference plot for KNBM x=0.05.
Position [°2Theta] (Cobalt (Co))
30 40 50 60 70
Counts
0 40000 160000
KNBMn_0.05_1085 9533-ICSD 22.8 % 190920-ICSD 77.2 %
0 50 -50 100
Figure D. 2.: The pie chart represents the percent quantity of the two polymorphs (orthorhombic and cubic) for KNBM x=0.05.
Atom Wyck. s.o.f. x y z Biso/ 10^4 pm^2
K1 2b 0.950000 0.500000 0.000000 0.513800 0.000000
Nb1 2a 0.950000 0.000000 0.000000 0.000000 0.000000
O1 2b 1.000000 0.500000 0.000000 0.036400 0.000000
O2 4d 1.000000 0.000000 0.252400 0.284200 0.000000
Bi 2b 0.050000 0.500000 0.000000 0.513800 0.000000
[image:43.595.156.440.68.351.2]Mn 2a 0.050000 0.000000 0.000000 0.000000 0.000000
Atom Wyck. s.o.f. x y z Biso/ 10^4 pm^2
K1 1b 0.950000 0.500000 0.500000 0.500000 0.020500
Nb1 1a 0.950000 0.000000 0.000000 0.000000 0.015490
O1 3d 1.000000 0.500000 0.000000 0.000000 0.000000
Bi 1b 0.050000 0.500000 0.500000 0.500000 0.020500
[image:44.595.103.510.325.695.2]Mn 1a 0.050000 0.000000 0.000000 0.000000 0.015490
Table D. 2.: Occupancy, atomic fraction coordinates and Biso for cubic KNBF x=0.05.
D.1.1.2. x=0. 10
Figure D. 3.: Experimental X-ray diffraction data (red), calculated fitting profile (blue) and difference plot for KNBM x=0.10.
Position [°2Theta] (Cobalt (Co))
30 40 50 60 70
Counts
0 40000 160000
KNBMn_0.10_1085 190920-ICSD 85.9 % 9533-ICSD 14.1 %
0 50 -50 100
Figure D. 4.: The pie chart represents the percent quantity of the two polymorphs (orthorhombic and cubic) for KNBM x=0.10.
Atom Wyck. s.o.f. x y z Biso/ 10^4 pm^2
K1 1b 0.900000 0.500000 0.500000 0.500000 0.020500
Nb1 1a 0.900000 0.000000 0.000000 0.000000 0.015490
O1 3d 1.000000 0.500000 0.000000 0.000000 0.000000
bi 1b 0.100000 0.500000 0.500000 0.500000 0.020500
Mn 1a 0.100000 0.000000 0.000000 0.000000 0.015490
Table D. 3.: Occupancy, atomic fraction coordinates and Biso for cubic. KNBF x=0.10.
Atom Wyck. s.o.f. x y z Biso/ 10^4 pm^2
K1 2b 0.900000 0.500000 0.000000 0.513800 0.000000
Nb1 2a 0.900000 0.000000 0.000000 0.000000 0.000000
O2 4d 1.000000 0.000000 0.252400 0.284200 0.000000
Bi 2b 0.100000 0.500000 0.000000 0.513800 0.000000
[image:46.595.92.510.249.605.2]Mn 2a 0.100000 0.000000 0.000000 0.000000 0.000000
Table D. 4.: Occupancy, atomic fraction coordinates and Biso for orthorhombic KNBF x=0.10.
D.1.1.3. x=0.15
Figure D. 5.: Experimental X-ray diffraction data (red), calculated fitting profile (blue) and difference plot for KNBM x=0.15.
Position [°2Theta] (Cobalt (Co))
30 40 50 60 70
Counts
0 40000 160000
KNBMn_0.15_1085 190920-ICSD 94.6 % 9533-ICSD 5.4 %
0 100
-100 200
Figure D. 6.: The pie chart represents the percent quantity of the two polymorphs (orthorhombic and cubic) for KNBM x=0.15.
Atom Wyck. s.o.f. x y z Biso/ 10^4 pm^2
K1 1b 0.850000 0.500000 0.500000 0.500000 0.020500
Nb1 1a 0.850000 0.000000 0.000000 0.000000 0.015490
O1 3d 1.000000 0.500000 0.000000 0.000000 0.000000
Bi 1b 0.150000 0.500000 0.500000 0.500000 0.020500
[image:47.595.168.428.65.327.2]Mn 1a 0.150000 0.000000 0.000000 0.000000 0.015490
Atom Wyck. s.o.f. x y z Biso/ 10^4 pm^2
K1 2b 0.850000 0.500000 0.000000 0.513800 0.000000
Nb1 2a 0.850000 0.000000 0.000000 0.000000 0.000000
O1 2b 1.000000 0.500000 0.000000 0.036400 0.000000
O2 4d 1.000000 0.000000 0.252400 0.284200 0.000000
Bi 2b 0.150000 0.500000 0.000000 0.513800 0.000000
[image:48.595.102.510.346.715.2]Mn 2a 0.150000 0.000000 0.000000 0.000000 0.000000
Table D. 6.: Occupancy, atomic fraction coordinates and Biso for orthorhombic KNBF x=0.15.
D.1.1.4. x=0.20
Figure D. 7.: Experimental X-ray diffraction data (red), calculated fitting profile (blue) and difference plot
Position [°2Theta] (Cobalt (Co))
30 40 50 60 70
Counts
0 40000 160000 360000
KNBMn_0.20_1085 190920-ICSD 100.0 %
0 100
-100 200
Atom Wyck. s.o.f. x y z Biso/ 10^4 pm^2
K1 1b 0.800000 0.500000 0.500000 0.500000 0.020500
Nb1 1a 0.800000 0.000000 0.000000 0.000000 0.015490
O1 3d 1.000000 0.500000 0.000000 0.000000 0.000000
Bi 1b 0.200000 0.500000 0.500000 0.500000 0.020500
[image:49.595.86.510.315.690.2]Mn 1a 0.200000 0.000000 0.000000 0.000000 0.015490
Table D. 7.: Occupancy, atomic fraction coordinates and Biso for cubic KNBF x=0.20.
D.1.1.5. x=0.25
Figure D. 8.: Experimental X-ray diffraction data (red), calculated fitting profile (blue) and difference plot for KNBM x=0.25.
Position [°2Theta] (Cobalt (Co))
30 40 50 60 70
Counts
0 40000 160000 360000
KNBMn_0.25_1085 190920-ICSD 100.0 %
0 100
-100 200
Atom Wyck. s.o.f. x y z Biso/ 10^4 pm^2
K1 1b 0.750000 0.500000 0.500000 0.500000 0.020500
Nb1 1a 0.750000 0.000000 0.000000 0.000000 0.015490
O1 3d 1.000000 0.500000 0.000000 0.000000 0.000000
Bi 1b 0.250000 0.500000 0.500000 0.500000 0.020500
Mn 1a 0.250000 0.000000 0.000000 0.000000 0.015490
Table D. 8.: Occupancy, atomic fraction coordinates and Biso for cubic KNBF x=0.25.
D.2. EDX measurements
D.2.1. (1-x) KNbO3- x BiMnO3
D.2.1.1. x=0.05
K (%) Nb (%) Bi (%) Mn (%) K/Nb K/Bi K/Mn
47.5 47.5 2.5 2.5 1 19 19
Table D. 9: Atomic weight of K, Nb, Bi, Mn and molar relations for the nominal KNBM x=0.05composition
.
K (%) Nb (%) Bi (%) Mn (%) K/Nb K/Bi K/Mn
1 48.32 42.78 8.36 0.55 1.129 6 88
2 48.96 47.16 3.05 0.83 1.038 16 59
3 43.78 45.69 9.46 1.07 0.958 5 41
4 41.44 48.51 7.5 2.54 0.854 6 16
5 48.84 44.27 3.83 3.06 1.103 13 16
6 45.88 46.49 4.26 3.37 0.987 11 14
7 43.97 47.25 5.4 3.38 0.931 8 13
9 44.61 43.67 7.17 4.55 1.022 6 10
10 40.67 45.17 9.63 4.53 0.900 4 9
11 46.01 43.71 4.8 5.48 1.053 10 8
12 43.52 42.11 9.13 5.24 1.033 5 8
13 44.4 43.96 5.9 5.74 1.010 8 8
14 44.88 40.15 8.92 6.05 1.118 5 7
[image:51.595.107.489.68.275.2]15 40.19 44.16 9.78 5.87 0.910 4 7
Table D. 10 Experimental atomic weight of K, Nb, Bi, n and molar relations for KNBM x=0.05 composition by EDX spectra.
D.2.1.2. x=0.10
K (%) Nb (%) Bi (%) Mn (%) K/Nb K/Bi K/Mn
45 45 5 5 1 9 9
Table D. 11: Atomic weight of K, Nb, Bi, Mn and molar relations for the nominal KNBM x=0.10 composition.
K (%) Nb (%) Bi (%) Mn (%) K/Nb K/Bi K/Mn
1 57.04 34.3 5.14 3.53 1.663 11 16
2 56.72 32.89 6.13 4.26 1.725 9 13
3 41.2 45.69 9.51 3.6 0.902 4 11
4 43.09 44.03 8.31 4.58 0.979 5 9
5 43.1 43.1 8.26 5.54 1.000 5 8
6 45.5 39.7 8.88 5.92 1.146 5 8
7 43.07 42.31 8.81 5.81 1.018 5 7
9 41.93 43.23 7.69 7.16 0.970 5 6
10 38.84 33.14 6.56 21.47 1.172 6 2
Table D. 12: Experimental atomic weight of K, Nb, Bi, Mn and molar relations for KNBM x=0.10 composition by EDX spectra.
D.2.1.3. x=0.15
K (%) Nb (%) Bi (%) Mn (%) K/Nb K/Bi K/Mn
42.5 42.5 7.5 7.5 1 5.67 5.67
Table D. 13: Atomic weight of K, Nb, Bi, Mn and molar relations for the nominal KNBM x=0.15 composition.
K (%) Nb (%) Bi (%) Mn (%) K/Nb K/Bi K/Mn
1 1 62.3 28.48 4.63 4.6 2.188 13
2 2 56.23 31.69 5.9 6.19 1.774 10
3 3 48.86 39.68 6.08 5.38 1.231 8
4 4 43.57 41.85 8.66 5.92 1.041 5
5 5 41.79 40.43 11.32 6.46 1.034 4
6 6 41.38 42.94 9.19 6.48 0.964 5
7 7 41.5 41.17 10.3 7.03 1.008 4
8 8 41.9 40.99 9.54 7.56 1.022 4
9 9 40.17 41.76 10.65 7.41 0.962 4
10 10 40.51 40.38 11.58 7.54 1.003 3
11 11 52.56 22.58 4.44 20.41 2.328 12
D.2.1.4. x=0.20
K (%) Nb (%) Bi (%) Mn (%) K/Nb K/Bi K/Mn
40 40 10 10 1 4 4
Table D. 15.: Atomic weight of K, Nb, Bi, Mn and molar relations for the nominal KNBM x=0.20 composition.
K (%) Nb (%) Bi (%) Mn (%) K/Nb K/Bi K/Mn
1 41.54 40.67 10.98 6.82 1.021 4 6
2 40.16 42.01 11.22 6.62 0.956 4 6
3 40.47 41.46 10.72 7.34 0.976 4 6
4 40.52 41.17 10.89 7.42 0.984 4 5
5 40.44 40.23 11.92 7.41 1.005 3 5
6 40.21 42.73 9.44 7.62 0.941 4 5
7 41.66 38.87 11.55 7.92 1.072 4 5
8 40.11 40.59 11.62 7.68 0.988 3 5
9 39.79 40.78 11.72 7.72 0.976 3 5
10 40.25 40.49 11.23 8.03 0.994 4 5
11 39.89 40.26 11.64 8.21 0.991 3 5
12 39.91 39.88 11.97 8.24 1.001 3 5
13 38.72 43 9.99 8.28 0.900 4 5
14 38.61 39.12 13.42 8.85 0.987 3 4
15 38.8 39.98 12.18 9.04 0.970 3 4
[image:53.595.108.491.191.660.2]D.2.1.5. x=0.25
K (%) Nb (%) Bi (%) Mn (%) K/Nb K/Bi K/Mn
37.5 37.5 12.5 12.5 1 3 3
Table D. 17.: Atomic weight of K, Nb, Bi, Mn and molar relations for the nominal KNBM x=0.25 composition.
K (%) Nb (%) Bi (%) Mn (%) K/Nb K/Bi K/Mn
1 35.84 37.97 15.16 11.04 0.944 2 3
2 36.07 37.46 15.05 11.43 0.963 2 3
3 35.47 37.72 15.24 11.57 0.940 2 3
4 35.12 36.96 16.21 11.71 0.950 2 3
5 34.99 36.24 15.86 12.92 0.966 2 3
6 33.86 37.89 15.61 12.63 0.894 2 3
7 34.45 35.66 16.31 13.59 0.966 2 3
8 34.23 35.82 16.37 13.58 0.956 2 3
9 33.91 35.93 16.4 13.76 0.944 2 2
APPENDIX E
Chapter 7: System (1−x) KNbO
3-x BiCoO
3E.1. Rietveld Refinements plots
E.1.1. (1-x) KNbO3-x BiCoO3 (KNBC)
[image:55.595.98.524.332.651.2]E.1.1.1. x=0.05
Figure E. 1: Experimental X-ray diffraction data (red), calculated fitting profile (blue) and difference plot for KNBC x=0.05.
Position [°2Theta] (Cobalt (Co))
30 40 50 60 70
Counts
0 40000 160000
KNCoBi_0.05_1088_bigpellet 190920-ICSD 91.9 % 9533-ICSD 8.1 %
0 50
-50 100
Figure E. 2: Coexistence of two phases, (a) cubic and (b) orthorhombic, refined by Rietveld method for KNBC x=0.05
Figure E. 3.: The pie chart represents the percent quantity of the two polymorphs (orthorhombic and cubic) for KNBC x=0.05.
Atom Wyck. s.o.f. x y z Biso/ 10^4 pm^2
K1 2b 0.950000 0.500000 0.000000 0.513800 0.000000
Nb1 2a 0.950000 0.000000 0.000000 0.000000 0.000000
O1 2b 1.000000 0.500000 0.000000 0.036400 0.000000
O2 4d 1.000000 0.000000 0.252400 0.284200 0.000000
Co 2a 0.050000 0.000000 0.000000 0.000000 0.000000
Table E. 1: Occupancy, atomic fract. coordinates and Biso for orthorhombic KNBC x=0.05
Atom Wyck. s.o.f. x y z Biso/ 10^4 pm^2
K1 1b 0.950000 0.500000 0.500000 0.500000 0.020500
Nb1 1a 0.950000 0.000000 0.000000 0.000000 0.015490
O1 3d 1.000000 0.500000 0.000000 0.000000 0.000000
Bi 1b 0.050000 0.500000 0.500000 0.500000 0.000000
Co 1a 0.050000 0.000000 0.000000 0.000000 0.000000
Table E. 2: Occupancy, atomic fract. coordinates and Biso for cubic KNBC x=0.05
E.1.1.2. x=0.10
Figure E. 4: Experimental X-ray diffraction data (red), calculated fitting profile (blue) and difference plot
Position [°2Theta] (Cobalt (Co))
30 40 50 60 70
Counts
0 10000 40000 90000 160000
KNCoBi_0.10_1088 190920-ICSD 100.0 %
0 50 -50 100
Atom Wyck. s.o.f. x y z Biso/ 10^4 pm^2
K1 1b 0.900000 0.500000 0.500000 0.500000 0.020500
Nb1 1a 0.900000 0.000000 0.000000 0.000000 0.015490
O1 3d 1.000000 0.500000 0.000000 0.000000 0.000000
Bi 1b 0.100000 0.500000 0.500000 0.500000 0.000000
Co 1a 0.100000 0.000000 0.000000 0.000000 0.000000
Table E. 3: Occupancy, atomic fract. coordinates and Biso for cubic KNBC x=0.10
E.1.1.3. x=0.15
Figure E. 5: Experimental X-ray diffraction data (red), calculated fitting profile (blue) and difference plot for KNBC x=0.15.
Position [°2Theta] (Cobalt (Co))
30 40 50 60 70
Counts
0 40000 160000
KNCoBi_0.15_1088 190920-ICSD 100.0 %
0 50
-50 100
Atom Wyck. s.o.f. x y z Biso/ 10^4 pm^2
K1 1b 0.850000 0.500000 0.500000 0.500000 0.020500
Nb1 1a 1.000000 0.000000 0.000000 0.000000 0.015490
O1 3d 1.000000 0.500000 0.000000 0.000000 0.000000
Bi 1b 0.150000 0.500000 0.500000 0.500000 0.000000
Co 1a 0.150000 0.000000 0.000000 0.000000 0.000000
Table E. 4: Occupancy, atomic fract. coordinates and Biso for cubic KNBC x=0.15
E.1.1.4. x=0.20
Figure E. 6: Experimental X-ray diffraction data (red), calculated fitting profile (blue) and difference plot for KNBC x=0.20
Position [°2Theta] (Cobalt (Co))
30 40 50 60 70
Counts
0 10000 40000 90000 160000
KNCoBi_0.20_1088 190920-ICSD 100.0 %
0 50 -50 100
-100 150
Atom Wyck. s.o.f. x y z Biso/ 10^4 pm^2
K1 1b 0.800000 0.500000 0.500000 0.500000 0.020500
Nb1 1a 1.000000 0.000000 0.000000 0.000000 0.015490
O1 3d 1.000000 0.500000 0.000000 0.000000 0.000000
Bi 1b 0.200000 0.500000 0.500000 0.500000 0.020500
Co 1a 1.000000 0.000000 0.000000 0.000000 0.015490
Table E. 5: Occupancy, atomic fract. coordinates and Biso for cubic KNBC x=0.20
E.1.1.5 x=0.25
Figure E. 7: Experimental X-ray diffraction data (red), calculated fitting profile (blue) and difference plot for KNBC x=0.25.
Position [°2Theta] (Cobalt (Co))
30 40 50 60 70
Counts
0 10000 40000 90000 160000
KNCoBi_0.25_1088 190920-ICSD 100.0 %
0 50 -50 100
Atom Wyck. s.o.f. x y z Biso/ 10^4 pm^2
K1 1b 0.750000 0.500000 0.500000 0.500000 0.020500
Nb1 1a 0.750000 0.000000 0.000000 0.000000 0.015490
O1 3d 1.000000 0.500000 0.000000 0.000000 0.000000
Bi 1b 0.250000 0.500000 0.500000 0.500000 0.000000
Co 1a 0.250000 0.000000 0.000000 0.000000 0.000000
Table E. 6: Occupancy, atomic fract. coordinates and Biso for cubic KBBNZ x=0.25
E.2. EDX measurements
E.2.1. (1-x) KNbO3- x BiCoO3
E.2.1.1. x=0.05
K (%) Nb (%) Bi (%) Co (%) K/Nb K/Bi K/Co
47.5 47.5 2.5 2.5 1 19 19
Table E. 7: Atomic percent of K, Nb, Bi, Co and molar relations for the nominal KNBC x=0.05composition.
K (%) Nb (%) Bi (%) Co (%) K/Nb K/Bi K/Fe
1 47.3 47.4 2.9 2.5 0.997 16 19
2 45.5 50.1 2.1 2.3 0.908 22 20
3 46.3 47.8 3.7 2.2 0.968 13 21
4 47.6 47.1 3.3 2.0 1.009 15 23
5 48.1 46.8 3.1 1.9 1.028 15 25
6 46.9 48.3 3.0 1.8 0.970 16 26
7 47.5 48.4 2.3 1.8 0.981 21 27
9 48.6 47.5 2.2 1.8 1.022 22 28
10 47.5 47.1 3.7 1.7 1.007 13 28
11 48.3 47.4 2.7 1.6 1.019 18 29
12 46.9 47.6 4.1 1.5 0.985 12 32
13 48.2 47.2 3.1 1.4 1.021 15 34
14 49.0 47.3 2.3 1.4 1.036 22 35
15 47.2 48.7 2.7 1.3 0.969 17 36
16 47.6 48.3 2.7 1.3 0.985 17 36
17 48.6 47.4 2.7 1.3 1.025 18 37
18 47.8 48.7 2.2 1.3 0.981 22 37
19 46.5 49.3 3.0 1.2 0.943 15 39
20 46.6 49.6 2.6 1.2 0.940 18 39
21 47.5 49.3 2.0 1.2 0.963 23 40
22 49.3 47.0 2.5 1.2 1.047 19 42
23 47.4 49.8 1.7 1.1 0.952 28 44
24 48.2 48.9 2.1 0.8 0.986 23 59
25 48.9 48.3 2.1 0.7 1.013 23 70
26 48.2 49.5 1.7 0.6 0.975 28 83
27 49.5 49.1 0.9 0.6 1.008 55 87
E.2.1.2. x=0.10
K (%) Nb (%) Bi (%) Co (%) K/Nb K/Bi K/Co
45 45 5 5 1 9 9
Table E. 9: Atomic percent of K, Nb, Bi, Co and molar relations for the nominal KNBC x=0.10 composition
K (%) Nb (%) Bi (%) Co (%) K/Nb K/Bi K/Co
1 34.6 36.7 16.4 12.4 0.942 2 3
2 37.7 39.5 13.0 9.8 0.955 3 4
3 41.1 38.8 11.7 8.5 1.060 4 5
4 40.9 40.5 10.5 8.1 1.011 4 5
5 40.3 39.6 12.3 7.8 1.017 3 5
6 42.5 39.2 10.9 7.4 1.086 4 6
7 44.8 36.7 11.4 7.2 1.221 4 6
8 42.7 42.0 8.2 7.1 1.016 5 6
9 42.4 41.2 9.6 6.8 1.031 4 6
10 44.3 38.6 10.6 6.5 1.146 4 7
11 43.2 39.4 11.3 6.2 1.097 4 7
12 43.5 41.6 9.3 5.7 1.045 5 8
13 47.5 37.1 10.1 5.2 1.280 5 9
14 62.8 26.4 6.0 4.8 2.384 10 13
15 47.5 39.1 9.8 3.6 1.215 5 13
E.2.1.3. x=0.15
K (%) Nb (%) Bi (%) Co (%) K/Nb K/Bi K/Co
42.5 42.5 7.5 7.5 1 5.67 5.67
Table E. 11: Atomic percent of K, Nb, Bi, Fe and molar relations for the nominal KNBC x=0.15 composition
K (%) Nb (%) Bi (%) Co (%) K/Nb K/Bi K/Co
1 35.2 48.3 5.6 10.9 0.729 6 3
2 38.3 39.2 12.7 9.9 0.977 3 4
3 38.6 40.0 12.8 8.6 0.964 3 4
4 40.7 43.1 9.5 6.8 0.944 4 6
5 42.0 42.8 9.0 6.2 0.981 5 7
6 43.4 42.8 7.9 6.0 1.015 6 7
7 42.3 41.7 10.1 5.9 1.014 4 7
8 41.1 45.3 7.8 5.8 0.906 5 7
9 41.6 42.7 10.4 5.3 0.975 4 8
10 41.6 42.7 10.4 5.3 0.975 4 8
11 42.7 42.3 9.8 5.1 1.009 4 8
12 44.1 42.7 8.2 5.1 1.032 5 9
13 43.2 45.3 7.3 4.2 0.953 6 10
14 44.1 44.4 7.9 3.6 0.992 6 12
E.2.1.4. x=0.20
K (%) Nb (%) Bi (%) Co (%) K/Nb K/Bi K/Co
40 40 10 10 1 4 4
Table E. 13: Atomic percent of K, Nb, Bi, Co and molar relations for the nominal KNBC x=0.20 composition.
K (%) Nb (%) Bi (%) Co (%) K/Nb K/Bi K/Co
1 30.7 47.8 6.6 14.9 0.643 5 2
2 32.4 43.3 10.0 14.4 0.748 3 2
3 35.6 39.5 14.8 10.1 0.902 2 4
4 38.5 41.9 11.1 8.5 0.917 3 5
5 38.2 43.9 9.9 8.0 0.871 4 5
6 38.8 40.4 13.2 7.6 0.960 3 5
7 39.1 43.0 10.3 7.6 0.910 4 5
8 40.4 41.7 10.6 7.3 0.969 4 6
9 39.8 42.5 10.7 6.9 0.938 4 6
10 38.4 41.3 13.5 6.8 0.928 3 6
11 40.0 41.6 11.8 6.6 0.962 3 6
12 40.7 41.8 11.0 6.5 0.973 4 6
13 40.4 42.9 10.3 6.5 0.940 4 6
14 40.4 41.6 11.5 6.4 0.971 4 6
15 40.8 42.7 10.1 6.4 0.956 4 6
16 40.3 41.2 12.2 6.4 0.976 3 6
17 41.2 41.9 10.7 6.2 0.985 4 7
E.2.1.5. x=0.25
K (%) Nb (%) Bi (%) Co (%) K/Nb K/Bi K/Co
37.5 37.5 12.5 12.5 1 3 3
Table E. 15: Atomic percent of K, Nb, Bi, Co and molar relations for the nominal KNBC x=0.25 composition
K (%) Nb (%) Bi (%) Co (%) K/Nb K/Bi K/Fe
1 33.4 40.7 12.4 13.6 0.821 3 2
2 34.1 40.8 12.4 12.7 0.834 3 3
3 35.7 39.6 13.2 11.5 0.903 3 3
4 35.0 41.2 12.5 11.4 0.850 3 3
5 35.6 40.6 13.2 10.6 0.876 3 3
6 37.1 39.4 13.4 10.1 0.940 3 4
7 38.3 39.2 12.7 9.9 0.977 3 4
8 37.1 39.3 13.8 9.8 0.946 3 4
9 38.0 38.7 13.8 9.5 0.983 3 4
10 37.1 39.0 14.6 9.3 0.953 3 4
11 36.2 39.2 15.3 9.3 0.925 2 4
12 36.9 39.9 14.1 9.1 0.927 3 4
13 36.9 39.9 14.3 8.9 0.926 3 4
14 38.0 40.3 13.1 8.6 0.944 3 4
15 38.1 39.5 14.0 8.4 0.963 3 5
APPENDIX F
Chapter 8: System (1-x) KNbO
3- x BiNiO
3F.1. Rietveld Refinements plots
F.1.1. (1-x) KNbO3- x BiNiO3
F.1.1.1. x=0.05
Figure F. 1: Experimental X-ray diffraction data (red), calculated fitting profile (blue) and difference plot for KNBN x=0.05.
Position [°2Theta] (Copper (Cu))
30 40 50 60 70
Counts
0 10000 40000 90000 160000
KN-BN_0.05_1075 190920-ICSD 72.1 % 9533-ICSD 27.9 %
0 50
-50 100
Figure F. 2: The pie chart represents the percent quantity of the two polymorphs (orthorhombic and cubic) for KNBN x=0.05.
Figure F. 3: Coexistence of two phases, (a) cubic and (b) orthorhombic, refined by Rietveld method for KNBC x=0.05
Atom Wyck. s.o.f. x y z Biso/ 10^4 pm^2
K1 2b 0.950000 0.500000 0.000000 0.513800 0.000000
Nb1 2a 0.950000 0.000000 0.000000 0.000000 0.000000
O1 2b 1.000000 0.500000 0.000000 0.036400 0.000000
O2 4d 1.000000 0.000000 0.252400 0.284200 0.000000
Bi 2b 0.050000 0.500000 0.000000 0.513800 0.000000
Atom Wyck. s.o.f. x y z Biso/ 10^4 pm^2
K1 1b 0.950000 0.500000 0.500000 0.500000 0.020500
Nb1 1a 0.950000 0.000000 0.000000 0.000000 0.015490
O1 3d 1.000000 0.500000 0.000000 0.000000 0.000000
Bi 1b 0.050000 0.500000 0.500000 0.500000 0.020500
Ni 1a 0.050000 0.000000 0.000000 0.000000 0.015490
Table F. 2: Occupancy, atomic fract. coordinates and Biso for cubic KNBN x=0.05
F.1.1.2. x=0.10
Figure F. 4: Experimental X-ray diffraction data (red), calculated fitting profile (blue) and difference plot for KNBN x=0.10.
Position [°2Theta] (Copper (Cu))
30 40 50 60 70
Counts
0 10000 40000 90000 160000
KN-BN_0.10_1075 190920-ICSD 100.0 %
0 50
-50 100
Atom Wyck. s.o.f. x y z Biso/ 10^4 pm^2
K1 1b 0.900000 0.500000 0.500000 0.500000 0.020500
Nb1 1a 0.900000 0.000000 0.000000 0.000000 0.015490
O1 3d 1.000000 0.500000 0.000000 0.000000 0.000000
Bi 1b 0.100000 0.500000 0.500000 0.500000 0.020500
Ni 1a 0.100000 0.000000 0.000000 0.000000 0.000000
Table F. 3: Occupancy, atomic fract. coordinates and Biso for orthorhombic KNBN x=0.10
F.1.1.2.1 Alternative Rietveld refinement for x=0.10 into orthorhombic symmetry.
Figure F. 5: Alternative refinement. Experimental X-ray diffraction data (red), calculated fitting profile (blue) and difference plot for KNBN x=0.10 into orthorhombic phase.
Position [°2Theta] (Copper (Cu))
30 40 50 60 70
Counts
0 40000 160000
KN-BN_0.10_1075 9533-ICSD 100.0 %
0 50 -50 100
Space Group Amm2
Density (Experimental) (g/cm3) 4.2(2)
Density (calculated) (g/cm3) 4.971(3)
Relative Density (%) 84(1)
a (Å) 4.0148(1)
b (Å) 5.6770(2)
c (Å) 5.6731(7)
V/106 (pm3) 64.651(2)
Rexp 0.8102
Rp 2.1539
Rwp 2.6282
GOF 10.5211
Table F. 4: Experimental and theoretical density, lattice parameters and agreement indices calculated by Rietveld Refinement for KNBN (x=0.10)
F.1.1.3. X=0.15
Position [°2Theta] (Copper (Cu))
30 40 50 60 70
Counts
0 10000 40000 90000 160000
KN-BN_0.15_1075 190920-ICSD 100.0 %
0 50
-50 100
Atom Wyck. s.o.f. x y z Biso/ 10^4 pm^2
K1 1b 0.850000 0.500000 0.500000 0.500000 0.020500
Nb1 1a 0.850000 0.000000 0.000000 0.000000 0.015490
O1 3d 1.000000 0.500000 0.000000 0.000000 0.000000
Bi 1b 0.150000 0.500000 0.500000 0.500000 0.000000
Ni 1a 0.150000 0.000000 0.000000 0.000000 0.000000
Table F. 5: Occupancy, atomic fract. coordinates and Biso for orthorhombic KNBN x=0.15.
F.1.1.4. X=0.20
Figure F. 7: Experimental X-ray diffraction data (red), calculated fitting profile (blue) and difference plot for KNBN x=0.20.
Position [°2Theta] (Copper (Cu))
30 40 50 60 70
Counts
0 10000 40000 90000 160000
KN-BN_0.20_1075 190920-ICSD 100.0 %
0 50 -50 100
-100 150
Atom Wyck. s.o.f. x y z Biso/ 10^4 pm^2
K1 1b 0.800000 0.500000 0.500000 0.500000 0.020500
Nb1 1a 0.800000 0.000000 0.000000 0.000000 0.015490
O1 3d 1.000000 0.500000 0.000000 0.000000 0.000000
Bi 1b 0.200000 0.500000 0.500000 0.500000 0.000000
Ni 1a 0.200000 0.000000 0.000000 0.000000 0.000000
Table F. 6: Occupancy, atomic fract. coordinates and Biso for orthorhombic KNBN x=0.20
F.1.1.5. X=0.25
Figure F. 8: Experimental X-ray diffraction data (red), calculated fitting profile (blue) and difference plot for KNBN x=0.25.
Position [°2Theta] (Copper (Cu))
30 40 50 60 70
Counts
0 10000 40000 90000 160000
KN-BN_0.25_1075 190920-ICSD 100.0 %
0 50 -50 100
-100 150
Atom Wyck. s.o.f. x y z Biso/ 10^4 pm^2
K1 1b 0.750000 0.500000 0.500000 0.500000 0.020500
Nb1 1a 0.750000 0.000000 0.000000 0.000000 0.015490
O1 3d 1.000000 0.500000 0.000000 0.000000 0.000000
Bi 1b 0.250000 0.500000 0.500000 0.500000 0.020500
Ni 1a 0.250000 0.000000 0.000000 0.000000 0.015490
Table F. 7.: Occupancy, atomic fract. coordinates and Biso for orthorhombic KNBF x=0.25.
F.2. EDX measurements
F.2.1. (1-x) KNbO3- x BiNiO3
F.2.1.1. x=0.05
K (%) Nb (%) Bi (%) Ni (%) K/Nb K/Bi K/Ni
47.5 47.5 2.5 2.5 1 19 19
Table F. 8: Atomic percent of K, Nb, Bi, Ni and molar relations for the nominal KNBN x=0.05composition.
K (%) Nb (%) Bi (%) Ni (%) K/Nb K/Bi K/Ni
1 46.7 47.3 3.6 2.4 0.988 13 19
2 47.6 46.5 3.7 2.3 1.025 13 21
3 48.4 46.6 3.0 2.0 1.039 16 24
4 46.0 50.1 2.1 1.8 0.917 22 26
5 46.8 47.9 3.6 1.7 0.979 13 28
6 44.6 52.3 1.7 1.4 0.854 27 31
7 48.5 48.1 2.0 1.4 1.007 24 35
8 47.6 49.6 1.5 1.3 0.960 31 37
9 47.6 49.6 1.5 1.3 0.960 31 37
10 47.6 49.6 1.5 1.3 0.960 31 37
11 48.7 47.3 3.0 1.0 1.029 16 51
F.2.1.2. x=0.10
K (%) Nb (%) Bi (%) Ni (%) K/Nb K/Bi K/Ni
45 45 5 5 1 9 9
Table F. 10: Atomic percent of K, Nb, Bi, Ni and molar relations for the nominal KNBN x=0.10 composition
K (%) Nb (%) Bi (%) Ni (%) K/Nb K/Bi K/Ni
1 35.6 37.5 7.3 19.6 0.950 5 2
2 46.5 41.4 6.7 5.4 1.122 7 9
3 46.2 44.0 5.1 4.7 1.051 9 10
4 44.9 43.3 7.3 4.5 1.036 6 10
5 60.9 31.2 3.9 3.9 1.951 15 16
6 49.6 41.6 5.2 3.6 1.190 10 14
7 45.9 43.6 6.9 3.6 1.052 7 13
8 57.7 31.8 7.0 3.5 1.813 8 16
9 47.3 43.2 6.2 3.3 1.095 8 15
10 47.0 43.8 6.0 3.3 1.072 8 14
11 65.4 29.5 2.1 3.0 2.217 32 22
12 47.2 45.2 4.8 2.8 1.043 10 17
13 49.6 43.3 4.3 2.8 1.145 12 18
14 47.2 45.5 4.7 2.7 1.036 10 17
15 49.3 45.8 2.3 2.6 1.078 21 19
16 48.6 45.8 3.2 2.4 1.062 15 20
17 47.7 45.6 4.4 2.3 1.048 11 21
18 48.0 45.9 3.9 2.2 1.046 12 22
19 48.4 45.5 4.4 1.7 1.064 11 28
20 48.3 47.2 2.9 1.5 1.025 16 31
F.2.1.3. x=0.15
K (%) Nb (%) Bi (%) Ni (%) K/Nb K/Bi K/Ni
42.5 42.5 7.5 7.5 1 5.67 5.67
Table F. 12: Atomic percent of K, Nb, Bi, Ni and molar relations for the nominal KNBN x=0.15 composition.
K (%) Nb (%) Bi (%) Ni (%) K/Nb K/Bi K/Ni
1 41.3 41.3 9.9 7.5 1.001 4 6
2 40.4 45.5 8.2 5.9 0.889 5 7
3 40.9 42.6 10.7 5.8 0.961 4 7
4 42.4 41.8 10.3 5.5 1.014 4 8
5 42.9 43.0 8.7 5.3 0.998 5 8
6 43.3 44.4 7.4 4.8 0.974 6 9
7 46.2 44.0 5.1 4.7 1.051 9 10
8 43.1 43.6 8.8 4.5 0.988 5 9
9 44.0 44.8 6.9 4.3 0.983 6 10
10 42.8 45.0 8.0 4.2 0.951 5 10
11 44.7 44.1 7.3 4.0 1.014 6 11
12 44.1 45.0 6.9 4.0 0.979 6 11
13 45.1 43.6 7.5 3.8 1.036 6 12
14 46.4 44.0 5.8 3.8 1.054 8 12
15 45.3 44.2 6.9 3.6 1.025 7 13
16 44.9 44.9 6.6 3.6 0.999 7 12
F.2.1.4. x=0.20
K (%) Nb (%) Bi (%) Ni (%) K/Nb K/Bi K/Ni
40 40 10 10 1 4 4
Table F. 14: Atomic percent of K, Nb, Bi, Ni and molar relations for the nominal KNBN x=0.20 composition.
K (%) Nb (%) Bi (%) Ni (%) K/Nb K/Bi K/Ni
1 38.6 44.8 9.2 7.4 0.862 4 5
2 39.3 43.4 10.1 7.2 0.907 4 5
3 40.3 41.5 11.7 6.5 0.972 3 6
4 39.5 42.6 11.6 6.4 0.927 3 6
5 41.1 42.0 10.8 6.1 0.978 4 7
6 41.7 43.0 9.5 5.8 0.970 4 7
7 41.0 42.2 11.1 5.7 0.972 4 7
8 40.2 42.6 11.6 5.6 0.945 3 7
9 40.2 42.6 11.6 5.6 0.945 3 7
10 42.2 44.4 7.9 5.5 0.951 5 8
11 42.1 43.0 9.5 5.4 0.980 4 8
12 42.8 43.8 8.0 5.4 0.976 5 8
Table F. 15: Experimental atomic percent of K, Nb, Bi, Ni and molar relations for KNBN x=0.20 composition by EDX spectra.
F.2.1.5. x=0.25
K (%) Nb (%) Bi (%) Ni (%) K/Nb K/Bi K/Ni
37.5 37.5 12.5 12.5 1 3 3
Table F. 76: Atomic percent of K, Nb, Bi, Ni and molar relations for the nominal KNBN x=0.25 composition
K (%) Nb (%) Bi (%) Ni (%) K/Nb K/Bi K/Ni
1 32.1 43.2 10.9 13.8 0.743 3 2
2 37.6 39.3 12.8 10.3 0.958 3 4
3 37.5 39.5 13.6 9.4 0.950 3 4
4 37.4 42.0 12.0 8.6 0.889 3 4
7 40.2 39.7 11.9 8.1 1.013 3 5
8 38.9 40.8 12.4 7.8 0.955 3 5
9 38.9 40.8 12.4 7.8 0.955 3 5
10 38.5 40.4 13.3 7.8 0.954 3 5
11 40.3 40.9 11.4 7.4 0.983 4 5
12 39.4 42.2 11.0 7.4 0.933 4 5
13 39.6 43.2 9.8 7.4 0.917 4 5
14 39.6 43.2 9.8 7.4 0.917 4 5
15 41.4 40.3 11.3 6.9 1.028 4 6
16 41.4 40.3 11.3 6.9 1.028 4 6
17 41.9 42.9 9.5 5.7 0.977 4 7
18 73.0 18.5 5.2 3.2 3.936 14 23
APPENDIX G
Cha