Assessing the suitability of the Microsoft Kinect for
calculating person specific body segment parameters
CLARKSON, Sean, WHEAT, Jonathan
<http://orcid.org/0000-0002-1107-6452>, HELLER, Ben <http://orcid.org/0000-0003-0805-8170> and CHOPPIN,
Simon <http://orcid.org/0000-0003-2111-7710>
Available from Sheffield Hallam University Research Archive (SHURA) at:
http://shura.shu.ac.uk/8537/
This document is the author deposited version. You are advised to consult the
publisher's version if you wish to cite from it.
Published version
CLARKSON, Sean, WHEAT, Jonathan, HELLER, Ben and CHOPPIN, Simon (2014).
Assessing the suitability of the Microsoft Kinect for calculating person specific body
segment parameters. In: 4th IEEE Workshop on Consumer Depth Cameras for
Computer Vision, Zurich, Switzerland, 6th Septmber 2014.
Copyright and re-use policy
See
http://shura.shu.ac.uk/information.html
Sheffield Hallam University Research Archive
for Calculating Person Specific Body Segment
Parameters
Sean Clarkson*, Jon Wheat, Ben Heller, Simon Choppin * [email protected]
Centre for Sports Engineering Research, Sheffield Hallam University, Sheffield, United Kingdom
Abstract. Many biomechanical and medical analyses rely on the avail-ability of reliable body segment parameter estimates. Current techniques typically take many manual measurements of the human body, in con-junction with geometric models or regression equations. However, such techniques are often criticised. 3D scanning offers many advantages, but current systems are prohibitively complex and costly. The recent interest in natural user interaction (NUI) has led to the development of low cost (˜£200) sensors capable of 3D body scanning, however, there has been little consideration of their validity. A scanning system comprising four Microsoft Kinect sensors (a typical NUI sensor) was used to scan twelve living male participants three times. Volume estimates from the system were compared to those from a geometric modelling technique. Results demonstrated high reliability (ICC>0.7, TEM<1%) and presence of a systematic measurement offset (0.001m3), suggesting the system would be well received by healthcare and sports communities. . . .
Keywords: Body Segment Parameters, BSP, Kinect, Depth Camera, Measurement, Body Scanning
1
Introduction
Within biomechanical and healthcare communities, reliable estimates of body segment parameters (BSPs) are desirable for a number of analyses [1]. For ex-ample, calculation of body volume index (BVI) is reliant on accurate measures of segment volume [2], whilst inverse dynamics models require estimates of segment mass to calculate joint force and power [3]. Accuracy is paramount [4], as small changes have been shown to greatly influence subsequent calculations [5–7].
Previous studies have used medical imaging and scanning systems (DEXA, MRI and CT) to obtain accurate subject specific BSP estimates [8–11]. However, the required investment [11], lengthy scan time of MRI [11], and health risks of DEXA and CT [9] have led to their criticism as viable methods.
results in BSPs of an inherently generic nature [15]. Such methods are also criticised as the data underpinning the models typically comes from small sample groups [16] that have a lack of gender and racial diversity [10], and is therefore unrepresentative of the wider population.
Geometric modelling techniques [17], [18] involve more measurements of the body, but typically offer significant accuracy improvements [19]. Wicke and Du-mas [20] and Challis [19] suggested that limb segments can be reliably modelled using geometric shapes, but the trunk segment is difficult. For example, partic-ipants with a large stomach may not be well represented by the stadium solid shapes used in Yeadon’s model [18], leading to an underestimation of volume. The complexity of approximating the trunk segment is further increased due to its likelihood of changing shape during the breathing cycle [19], leading to poor accuracy and reliability. These limitations have left researchers seeking alterna-tive methods of estimating BSPs that are quicker, offer greater accuracy, and take into account the very specific nature of body segment shape.
Handheld laser scanners have previously been used to obtain subject specific BSPs within laboratory [1] and training environments [21]. Although offering high point accuracy [22] without associated health risks [23], their convention-ally cited accuracy may be reduced when scanning living humans due to the possibility of involuntary movement over the lengthy scanning duration (˜30 minutes). Full body scanners based on laser [24], and structured light [25] of-fer shorter scan times (<30 seconds), but are prohibitively expensive for the majority of sports and healthcare research laboratories [26].
The recent interest in natural user interaction (NUI) has led to the develop-ment of low cost (in the region of£200 [27]) sensors which use a combination of 3D structured light scanning [28] and computer vision techniques [29] to capture human motion in 3D [30]. 3D scan data is typically captured at a rate of 30Hz and can be accessed in raw point cloud form [31]: providing a low cost method of 3D scanning. Their launch has led to significant interest in a range of commu-nities including: robotics [32], body scanning [30], healthcare [33], graphics [34] and apparel [35].
The purpose of this study was to compare two methods of obtaining first order BSP estimates (volume) of a living human participant’s trunk segment. The trunk segment was chosen due to the well cited problems with modelling the trunk using geometric shapes. BSP estimates were obtained using a scanning system - comprising four NUI sensors - and with a geometric modelling technique. Intra participant reliability and the difference between methods was assessed. If the scanning system is able to produce comparable volume estimates and reliability then it could be used to replace current techniques, offering many advantages, and opening up numerous possibilities for the use of BSPs in a range of sports and health analysis environments.
2
Method
2.1 Scanning System
The Microsoft Kinect NUI sensor (Microsoft Corporation, Redmond, USA) was chosen for this study, owing to its low price point, support of a full software development kit (SDK), and the favourable results presented in previous studies [37–39].
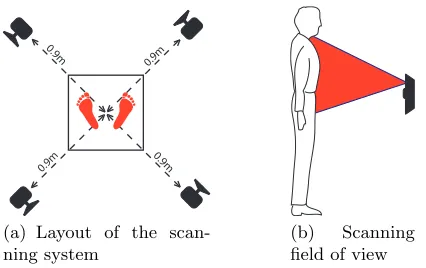
The scanning system comprised four Microsoft Kinect sensors mounted in a vertical orientation (figure 1a). The vertical orientation increased the vertical field of view (figure 1b), allowing the Kinects to be positioned closer to object being scanned, and resulting in an increased point cloud resolution [40]. The Kinects were affixed to four tripods, and located 0.9m from the centre of a 0.4m x 0.4m x 1.1m calibrated volume. The experimental setup was determined from previous investigations, and known to be sufficient to contain a participant’s trunk segment within the calibrated volume, without the outer extremities of the body becoming too close to the Kinect to prevent reliable resolution of depth.
2
0.9 m
0.9 m
0 .9
m 0.9
m
(a) Layout of the scan-ning system
(b) Scanning
[image:4.414.103.316.426.560.2]field of view
A single computer running custom software (created using the Microsoft Kinect SDK- Microsoft Corporation, Redmond, USA) was used to control the Kinects, perform calibration, and capture scans. The software was used to switch the Kinect’s infra-red (IR) projectors on and off during scanning to prevent interference between neighbouring sensors [38]. This resulted in a scan time of ˜1.5 seconds, simultaneously capturing 3D and colour data.
Previous research has shown the Kinect to exhibit significant distortion of the depth data [39]. Therefore a device specific calibration procedure was followed prior to collection [39], with the requisite calibration parameters used to correct the 3D data from each device.
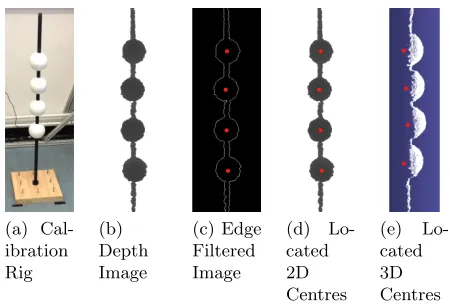
The local coordinate system of each Kinect was aligned to a global frame using an initial calibration procedure [38]. A calibration object - comprising four spheres mounted on a vertical rod (figure 2a) - was placed in nine different positions within the capture volume. Point cloud scans and corresponding depth images were captured by each Kinect. Sphere centres were identified using a combination of Hough transforms [43] and a minimisation technique (figure 2c and 2e). A rigid body transformation algorithm [41] and RANSAC optimisation [38] used the sphere centre locations to calculate the requisite transformation matrices.
(a) Cal-ibration Rig
(b) Depth Image
(c) Edge Filtered Image
(d)
Lo-cated 2D Centres
(e)
[image:5.414.94.319.278.432.2]Lo-cated 3D Centres
Fig. 2.Global calibration procedure
2.2 Manual Measurement Protocol
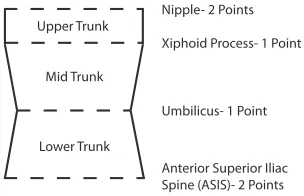
Trunk segment anatomical landmarks defined by Yeadon’s model (figure 3) were located by an ISAK (International Society for the Advancement of Ki-nanthropometry) trained examiner, and palpated using 10mm diameter blue markers.
Upper Trunk
Mid Trunk
Lower Trunk
Nipple- 2 Points
Xiphoid Process- 1 Point
Umbilicus- 1 Point
[image:6.414.131.283.102.200.2]Anterior Superior Iliac Spine (ASIS)- 2 Points
Fig. 3.Anatomical landmarks and segmentation process
Circumference measurements and breadths were taken at each segmentation level using anatomical tape and callipers respectively. The height of each segment was also recorded using a pair of callipers. Each measurement was repeated three times and an average value taken. These measurements were used in conjunction with Yeadon’s formulae [18] to model the three segments and calculate the overall volume of the trunk.
2.3 Scanning Protocol
After measurement and palpation, the participants were asked to enter the scan-ning area. Each participant was scanned a total of three times, with one initial scan to allow the participant to become familiarised with the protocol and the data to be checked. Each scan took ˜1.5 seconds to complete, due to the delay in turning on/off the Kinect’s IR projectors in sequence. A break of one minute was included between each scan, with the participants being asked to leave and re-enter the scanning area.
Footprints were placed in the centre of the capture volume to ensure the participants stood in the correct place, which also aided with improving inter scan measurement variability. The position of the footprints was determined with reference to Kirby et al [42] in order to maximise body stability.
Participants were asked to adopt a modified version of the anatomical pose defined by ISO 20685 [43] for the duration of the scan, with their arms externally rotated by 35◦with reference to their trunk (figure 4). This ensured the underarm area of each participant was included in the scan, as these data were required to define the top of the upper trunk segment.
Fig. 4.The scanning pose (adapted from ISO 20685-1 [43])
the index finger and not mechanical support [44–46]. Height and position of the supports were adjusted prior to scanning, with the aid of a goniometer to ensure the participant’s arms were in the correct place.
Participants were asked to hold their breath at the end of the expiration cycle (end-tidal expiration) throughout the short scanning duration [21]. This ensured the diaphragm was empty, which limited shape change of the trunk between scans, and hence aided with scan reliability.
2.4 Scan Post Processing and Volume Calculation
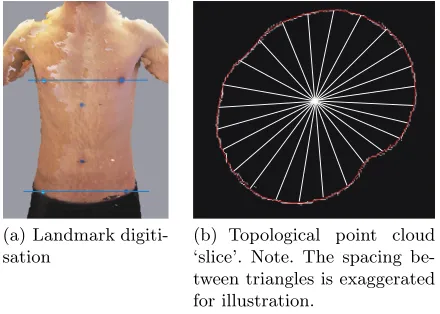
After collection, each 3D scan was manually digitised by a single operator using bespoke software (figure 5a). Unlike Yeadon’s technique which models the trunk as three separate segments, the 3D scan includes a complete geometry of the trunk, and was therefore treated as a single object. Two markers were digitised on each scan, one of the ASIS markers, and one of the nipple markers: defining the top and bottom of the area of interest. For consistency, the participants right most markers were always digitised. Participants were assumed to be stood perpendicular to the global coordinate system whilst adopting the scanning pose, which allowed two segmentation planes to be constructed from the two digitised points (figure 5a).
An automated technique was developed to calculate the enclosed volume of the region of interest. Firstly, the scan was constrained to only include the main cluster of points relating to the torso segment, removing outlying points-such as the arms. This was achieved by calculating the inter point distance, and removing any points with a distance greater than a pre-defined threshold.
(a) Landmark digiti-sation
[image:8.414.98.318.34.191.2](b) Topological point cloud ‘slice’. Note. The spacing be-tween triangles is exaggerated for illustration.
Fig. 5.The digitisation and segmentation technique
5b). The area of each triangle was summed and multiplied by the slice height (2 mm) to calculate the volume of the slice. This process was repeated throughout the scan, and the volume of each slice summed to estimate the total segment volume.
3
Results
3.1 Agreement Between Methods
After post processing, volumes estimated from the three repeated 3D scans per participant were compared with those calculated using Yeadon’s geometric model (table 1).
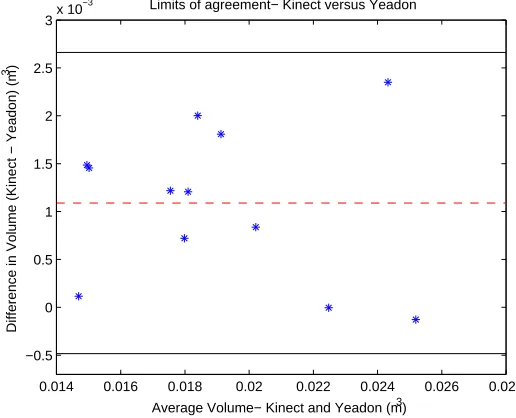
Agreement between methods was assessed using limits of agreement (LOA) [50], allowing identification of systematic and random noise differences (figure 6).
Figure 6 shows the difference between the two methods to be greater than zero in all but two cases, suggesting presence of a fixed measurement bias (0.001m3). Figure 6 also suggests possibility of a proportional bias, with the trend of the difference between methods being reduced as mean volume increases. However, this cannot be reliably interpreted from the figure above.
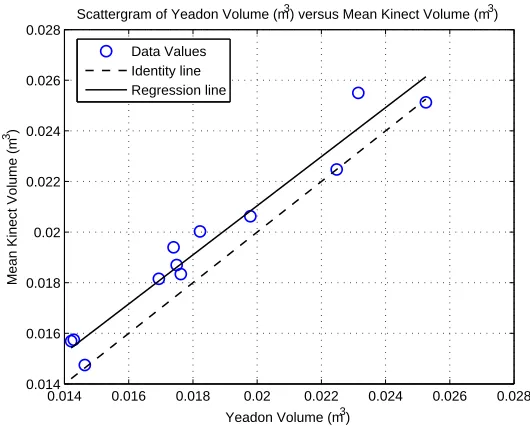
To investigate further, ordinary least products regression (OLP) [51] was used to identify fixed and proportional measurement bias (figure 7), combined with anr2 value to indicate random differences between the two techniques.
Table 1.Summary data for the 12 participants
Mean Difference Kinect vs Yeadon (%) Kinect Standard Deviation CoV (%)
6.90 0.83 0.78
10.19 1.04 0.94
10.46 1.25 1.13
-0.02 1.41 1.41
-0.51 1.02 1.03
4.23 0.39 0.37
7.19 0.32 0.30
10.15 0.26 0.24
0.79 0.38 0.38
4.09 0.93 0.90
11.51 1.40 1.25
9.92 0.59 0.54
0.014 0.016 0.018 0.02 0.022 0.024 0.026 0.028
−0.5 0 0.5 1 1.5 2 2.5
3x 10
−3 Limits of agreement− Kinect versus Yeadon
Average Volume− Kinect and Yeadon (m3)
Difference in Volume (Kinect − Yeadon) (m
3)
[image:9.414.72.330.318.527.2]0.014 0.016 0.018 0.02 0.022 0.024 0.026 0.028 0.014
0.016 0.018 0.02 0.022 0.024 0.026 0.028
Yeadon Volume (m3)
Mean Kinect Volume (m
3)
Scattergram of Yeadon Volume (m3) versus Mean Kinect Volume (m3)
[image:10.414.68.333.36.249.2]Data Values Identity line Regression line
Fig. 7.Ordinary least products plot to compare the two measurement techniques
The OLP analysis agrees with the previous Bland Altman plot, showing a ≈ 0, with a small confidence interval (0.003) whose lower limit is at a = 0. From this, we can be confident there is presence of a fixed measurement bias. Visual inspection of figure 7 also shows this to be the case, with the Kinect scanning system appearing to overestimate volume in comparison to Yeadon’s geometric model. The OLP analysis suggests a lack of proportional bias (b ≈ 1), with visual inspection of figure 7 also agreeing. However, the confidence interval of b is wide (0.306) and has upper and lower bounds either side of one. Therefore, we cannot be confident in the findings of b, based upon the current dataset. Additional data is required as this should lead to a more reliable value of b, allowing conclusions to be formed. Ostensibly, high correlation is demonstrated between the two techniques (r2 = 0.95), suggesting the presence of limited random noise.
3.2 Reliability
The relative technical error of measurement (TEM) [52], [53] was calculated across the 3 repeated scans for all 12 participants and shown to be on average 0.88% (±0.1).
4
Discussion
This report compares trunk segment volume estimates of 12 living male par-ticipants obtained using a low cost 3D scanning system and conventional ge-ometric modelling techniques. The motivation for this study was to develop a method of estimating volume of the human trunk segment that is quicker than current techniques, whilst demonstrating comparable accuracy and reliability. This would give wider access to such measurements within sports and health-care environments, as current techniques are often prohibitively time consuming. Furthermore, it demonstrates the possibility to obtain additional measurements (such as centre of mass and moment of inertia) directly from the 3D data, rather than relying on generic assumptions or models.
Both the Bland Altman and OLP analysis clearly show presence of a sys-tematic measurement offset between the two techniques. Results show the scan-ning system to on average overestimate volume when compared with Yeadon’s geometric model. Previous research has shown such scanning systems to over-estimate shape [39], whilst the inability of Yeadon’s model to accurately model some somatotypes is also well reported [19,20]. For example, visual inspection of figure 6 shows there are some participants whose trunk volume is more closely comparable between both techniques. This could simply be related to random measurement errors in the 3D scans, or the manual measurements used in con-junction with Yeadon’s model. Alternatively, it is more likely those participant’s trunk segments are not well represented by a stadium solid shape, leading to overestimation of volume according to Yeadon’s model, and hence a reduction in the seemingly systematic measurement offset. Future studies should look to investigate this further, grouping participants based on somatotypes or partic-ular body measurements, and analysing how the difference between the two techniques varies.
Results from the OLP analysis did not permit a reliable conclusion regarding the presence of proportional bias, largely due to the relatively small sample size. Additional data - particularly at the higher end of the volume spectrum - is required to enable a reliable conclusion to be formed.
anatom-ical landmarks can usually be digitised with ease, but can sometimes be occluded in areas where the scans overlap. For this reason, it may be better to digitise using the individual 2D colour images from each Kinect, and later convert to 3D via automated techniques. This suggests the potential for a further study, which compares both the accuracy and reliability of 2D and 3D digitisation techniques.
The steps introduced to limit such errors ensured intra participant reliability was high (table 1), which further suggests presence of a systematic measurement bias. Putting the results into context, ISAK state acceptable intra examiner relative TEMs of≤1% for a level 2 examiner taking body measurements (girths, lengths etc) [47]. The 12 participants in this study have an average TEM of 0.88% (0.10), suggesting the system presented here would be well received within sports and healthcare communities. A recent study by Outram et al [48] investigated the accuracy of trunk segment volume estimates using a slightly modified version of Yeadon’s geometric model. ICC was used to assess reliability, which has been deemed appropriate for use in healthcare environments [49]. Average ICC across the trunk segment was shown to be 0.887, in comparison to an average ICC of 0.998 by the scanning system. Acceptable accuracy is typically deemed by an ICC≥0.70 [50], again suggesting the system would be well received within sports and healthcare communities.
The system developed here is low cost (˜£1500), easy to setup, calibrate, and use. The system is capable of obtaining BSP estimates much quicker than current techniques, increasing the availability of BSP estimates, and enabling their use in environments (such as sports training and competition) where current techniques are often prohibitively time consuming. Perhaps the biggest advantage of the system presented here is that all the measurements are directly calculated from the 3D scans, and are therefore specific to the person, and not reliant upon generic assumptions or models whose accuracy may vary with participant age, gender, or physique. In addition to the first order BSP presented here, the 3D scans allow the possibility of directly calculating higher order BSPs such as centre of mass and moment of inertia, as well as lower order anthropometrics such as circumferences, surface distances, and Euclidian distances. The ability to archive the 3D scans means additional measurements can be taken at any point in the future, also allowing historical scans to be overlaid on one another to compare changes in physique over time.
5
Conclusions
This study presents a simple, low cost 3D body scanning system (˜£1500) which is able to calculate the volume of a living human’s body segments using a semi-automated approach. The volume of 12 living male participants’ trunk segments was estimated with the system, and compared to estimates obtained with Yeadon’s geometric modelling technique. Results showed the 3D scanning system to systematically overestimate volume, in comparison to Yeadon’s tech-nique. Without gold standard data it is impossible to conclude whether this is a systematic measurement offset in the scanning system, or due to the well cited problems of modelling the trunk segment using geometric shapes. Reliability was high, within ISAK level 2 limits, and greater than that offered with Yeadon’s geometric modelling techniques. Considering all these factors, and the unique advantages offered by the 3D scanning system, this study suggests great poten-tial for use of the system within sports and healthcare environments to assess person specific BSPs: giving access to data which is currently infeasible due to prohibitively time consuming techniques.
6
Acknowledgements
The authors would like to acknowledge the assistance of Alice Bullas in the collection of anthropometric measurements in accordance with ISAK techniques.
References
1. Lerch, T., MacGillivray, M., Domina, T.: 3D Laser Scanning: A Model of Multidis-ciplinary Research. Journal of Textile and Apparel Technology and Management
5(3) (2006) 1–22
2. Robinson, A., Mccarthy, M., Brown, S., Evenden, A., Zou, L.: Improving the Quality of Measurements through the Implementation of Customised Reference Artefacts. In: 3D Body Scanning Technologies, Lugano, Switzerland (2012) 235– 246
3. Piovesan, D., Pierobon, A., Dizio, P., Lackner, J.R.: Comparative analysis of methods for estimating arm segment parameters and joint torques from inverse dynamics. Journal of Biomechanical Engineering133(3) (March 2011) 31003(1)– 31003(15)
4. Durkin, J.L., Dowling, J.J., Andrews, D.M.: The measurement of body segment inertial parameters using dual energy X-ray absorptiometry. Journal of Biome-chanics35(12) (December 2002) 1575–1580
5. Damavandi, M., Farahpour, N., Allard, P.: Determination of body segment masses and centers of mass using a force plate method in individuals of different morphol-ogy. Medical Engineering & Physics31(9) (November 2009) 1187–1194
6. Pearsall, D.J., Costigan, P.A.: The effect of segment parameter error on gait analysis results. Gait & Posture9(3) (July 1999) 173–183
8. Bauer, J.J., Pavol, M.J., Snow, C.M., Hayes, W.C.: MRI-derived body segment parameters of children differ from age-based estimates derived using photogram-metry. Journal of Biomechanics40(13) (January 2007) 2904–2910
9. Pearsall, D.J., Reid, J.G., Livingston, L.a.: Segmental inertial parameters of the human trunk as determined from computed tomography. Annuals of Biomedical Engineering24(2) (1996) 198–210
10. Cheng, C.K., Chen, H.H., Chen, C.S., Chen, C.L., Chen, C.Y.: Segment inertial properties of Chinese adults determined from magnetic resonance imaging. Clinical Biomechanics15(8) (October 2000) 559–566
11. Martin, P.E., Mungiole, M., Longhill, J.M.: The use of magnetic resonance imaging for measuring segment inertial properties. Journal of Biomechanics 22(4) (1989) 367–376
12. Dempster, W.: Space Requirements of the Seated Operator. Technical report, Michigan (1955)
13. Zatsiorsky, V.: The Mass and Inertia Characteristics of the Main Segments of the Human Body. BiomechanicsVIII(B) (1983) 1152–1159
14. Leva, P.D.: Adjustments to Zatsiorsky-Seluyanov’s Segment Inertia Parameters. Journal of Biomechanics29(9) (1996) 1223–1230
15. Gittoes, M.J.R., Kerwin, D.G.: Component inertia modelling of segmental wob-bling and rigid masses. Journal of Applied Biomechanics22(2) (May 2006) 148–154 16. Pearsall, D., Reid, J.: The Study of Human Body Segment Parameters in Biome-chanics: A Historical Review and Current Status Report. Sports Medicine18(5) (1994) 126–140
17. Hanavan, E.P.: A Mathematical Model of the Human Body. PhD thesis, USAF Institute of Technology, Ohio (1964)
18. Yeadon, M.R.: The simulation of aerial movement–II. A mathematical inertia model of the human body. Journal of Biomechanics23(1) (January 1990) 67–74 19. Challis, J.H.: Precision of the Estimation of Human Limb Inertial Parameters.
Journal of Applied Biomechanics15(1999) 418–428
20. Wicke, J., Dumas, G.A.: Influence of the Volume and Density Functions Within Geometric Models for Estimating Trunk Inertial Parameters. Journal of Applied Biomechanics26(2010) 26–31
21. Schranz, N., Tomkinson, G., Olds, T., Daniell, N.: Three-dimensional anthropomet-ric analysis: differences between elite Australian rowers and the general population. Journal of sports sciences28(5) (March 2010) 459–469
22. Nikon Corp: Metris D100 Laser Scanner (2011)
23. Henderson, R., Schulmeister, K.: Laser Safety. Taylor and Francis (2003) 24. Vitronic: Vitus 3D Body Scanner. (2011)
25. TC2: TC2 NX-16 3D Body Scanner. Technical report, Cary, USA (2010) 26. Weiss, A., Hirshberg, D., Black, M.J.: Home 3D Body Scans from Noisy Image and
Range Data. In: 13th International Conference on Computer Vision, Barcelona, Spain (2011)
27. Amazon: Kinect & Kinect Adventures for XBox 360 (2012)
28. Primesense Ltd: Three Dimensional Scanning using Speckle patterns (2009) 29. Shotton, J., Sharp, T., Fitzgibbon, A., Cook, M., Finocchio, M., Moore, R.,
Kip-man, A., Blake, A.: Real-Time Human Pose Recognition in Parts from Single
Depth Images. IEEE CVPR3(2011) 1297–1304
31. Khoshelham, K.: Accuracy analysis of Kinect depth data. In Lichti, D., Habib, A., eds.: ISPRS Workshop Laser Scanning, Calgary (2010) 1–6
32. Henry, P., Krainin, M., Herbst, E., Ren, X., Fox, D.: RGB-D mapping: Using Kinect-style depth cameras for dense 3D modeling of indoor environments. The International Journal of Robotics Research31(5) (February 2012) 647–663 33. Labelle, K.: Evaluation of Kinect joint tracking for clinical and in home stroke
rehabilitation tools. PhD thesis, Notre Dame, Indiana (2011)
34. Izadi, S., Kim, D., Hilliges, O., Molyneaux, D., Newcombe, R., Kohli, P., Shotton, J., Hodges, S., Freeman, D., Davison, A., Fitzgibbon, A.: KinectFusion : Real-time 3D Reconstruction and Interaction Using a Moving Depth Camera. In: UIST Symposium, Santa, Barbara, CA (2011) 559–568
35. Stampfli, P., Rissiek, A., Trieb, R., Seidi, A.: SizeITALY - The Actual Italian Measurement Survey. In: 3D Body Scanning Technologies, Lugano, Switzerland (2012) 261–268
36. Boehm, J.: Accuracy Investigation for Natural User Interface Sensors. In: Low Cost 3D Sensors, Algorithms and Applications, Berlin, Germany (2011)
37. Menna, F., Remondino, F., Battisti, R., Nocerino, E.: Geometric investigation of a gaming active device. Proceedings of the SPIE 8085(XI) (2011) 80850G(1)– 80850G(15)
38. Clarkson, S., Choppin, S., Hart, J., Heller, B., Wheat, J.: Calculating Body Seg-ment Inertia Parameters from a Single Rapid Scan Using the Microsoft Kinect. In Hometrica Consulting, ed.: 3D Body Scanning Technologies, Lugano, Switzerland, Hometrica Consulting (2012) 153–163
39. Clarkson, S., Wheat, J., Heller, B., Webster, J., Choppin, S.: Distortion Correction of Depth Data from Consumer Depth Cameras. In Hometrica Consulting, ed.: 3D Body Scanning Technologies, Long Beach, California, Hometrica Consulting (2013) 426–437
40. Khoshelham, K., Elberink, S.O.: Accuracy and resolution of Kinect depth data for indoor mapping applications. Sensors12(2) (January 2012) 1437–54
41. Soderkvist, I., Wedin, P.A.: Determining the movements of the skeleton using well configured markers. Journal of Biomechanics26(12) (1993) 1473–1477
42. Kirby, R., Price, N., MacLeod, D.: The Influence of Foot Position on Standing Balance. Journal of Biomechanics20(4) (1987) 423–427
43. International Standards Office: ISO 20685, 3-D Scanning Methodologies for Inter-nationally Compatible Anthropometric Databases (2010)
44. Kouzaki, M., Masani, K.: Reduced postural sway during quiet standing by light touch is due to finger tactile feedback but not mechanical support. Experimental brain research188(1) (June 2008) 153–158
45. Lackner, J., Rabin, E., DiZio, P.: Stabilization of posture by precision touch of the index finger with rigid and flexible filaments. Experimental Brain Research139(4) (August 2001) 454–464
46. Schranz, N., Tomkinson, G., Olds, T., Petkov, J., Hahn, A.G.: Is three-dimensional anthropometric analysis as good as traditional anthropometric analysis in predict-ing junior rowpredict-ing performance? Journal of sports sciences30(12) (January 2012) 1241–1248
47. Stewart, A., Sutton, L.: Body Composition in Sport, Exercise and Health. 1 edn. Routledge, Oxon, UK (2012)
49. Munro, B.: Statistical Methods for Health Care Research. 4th edn. Lippincott Williams and Wilkins, Philadelphia (2000)
![Fig. 4. The scanning pose (adapted from ISO 20685-1 [43])](https://thumb-us.123doks.com/thumbv2/123dok_us/734878.578128/7.414.165.249.33.158/fig-scanning-pose-adapted-iso.webp)