Measuring low pay: Measures and precision
Authors:
Carwyn Griffiths, Catrin Ormerod and Felix Ritchie Earnings Analysis Branch
Social Economic Micro Analysis and Reporting Division Office for National Statistics
01633 81(2019)
Summary
Introduction
The Annual Survey of Hours and Earnings (ASHE)1 is the main source of information on earnings in the UK. It is used to generate the official estimates of the low paid. The ONS measures the numbers of low paid as the percentage of jobs paid below the National Minimum Wage (NMW)2. This estimate is based on comparing individuals’ hourly earnings with the appropriate NMW rate3. The National Statistics on low pay are therefore calculated from ASHE by comparing the derived hourly rate with the NMW: earnings for the period divided by hours worked.
Since 2004 ASHE has also collected a stated rate of pay, for those workers who are paid an hourly rate. ONS currently uses this hourly rate for the validation of the derived rate, which is believed to be the more accurate and appropriate measure.
In 2006 the authors were asked to review the hourly pay variables. This investigation studied differences between the stated and derived rates, and the results are reported here. These show that, while a large part of the difference can be explained, there is still a significant amount of unexplained differential.
The review shows that methodology counts. An alternative measure of the low paid is available from the Labour Force Survey (LFS)4. As the ASHE only holds a limited range of personal characteristics the LFS is still used to give supporting estimates of the number of low paid when these are required by ethnicity, skill, etc. Hence the LFS methodology continues to be used. Since the inclusion of a new question on the hourly rate of second jobs in 2004 the LFS methodology has recently been improved (see Ormerod (2006)). Differences between ASHE and LFS estimates of the number of low paid have always been put down to differences in data collection. Our results show that much of the differences may be explained by different methodologies. Also, as a by-product of the investigation, it became clear that small changes in the precision of the estimates can affect the estimated low pay disproportionately. This is due to the nature of ‘low pay’ as a yes/no condition.
Hourly rate measures
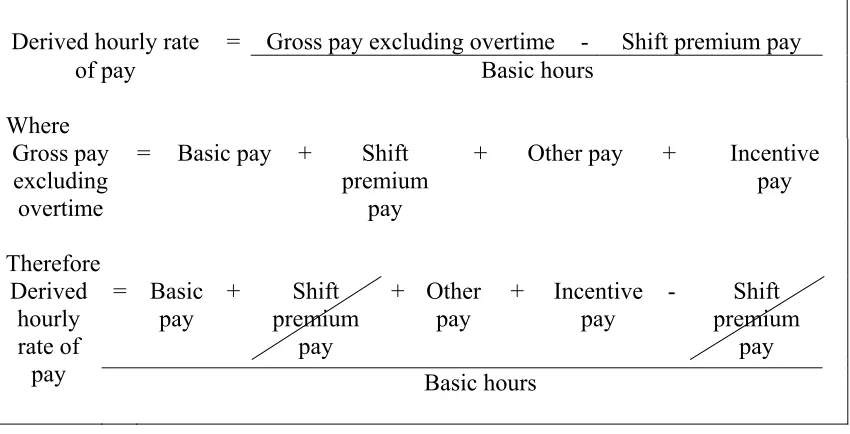
[image:3.595.87.512.213.430.2]In ASHE derived hourly pay is obtained by dividing gross pay excluding shift premium by the number of basic hours worked. Gross pay is derived by summing basic pay, shift premium pay, other pay and incentive pay. The derived hourly pay is therefore defined as the sum of basic pay, other pay and incentive pay, divided by the number of basic hours worked. This is illustrated in figure 1.
Figure 1: Calculation of derived hourly rate
Derived hourly rate = Gross pay excluding overtime - Shift premium pay
of pay Basic hours
Where Gross pay excluding overtime
= Basic pay + Shift premium
pay
+ Other pay + Incentive pay
Therefore
= Basic pay
+ Shift premium
pay
+ Other pay
+ Incentive pay
- Shift premium
pay Derived
hourly rate of
pay Basic hours
From 2004 respondents were also asked for a stated hourly rate. On the ASHE survey a routing question is provided to filter responses to the stated hourly rate question. Respondents are asked:
“Was the employee’s basic pay calculated by multiplying the number of hours they worked by an hourly rate of pay?”
If the answer to this question is “No” respondents are not routed to the basic pay question. If the response is “Yes” respondents are then asked:
“What was the employee’s hourly rate of pay?”
This investigation is complicated by the fact that the basic pay question changed in 2005. In 2004 there was an inconsistency in the basic pay question title and guidance. Whilst the question asked for basic pay the guidance suggested that other pay should also be included. In 2005 this was changed and the question wording and guidance were consistent. To try to resolve this issue in the dataset the basic pay variables were examined to identify records that may have included other payments. Where this was found to be likely the other pay variable was imputed. The basic pay variable
remained unchanged and therefore for 2004 basic pay either includes basic pay or basic pay and other pay. As it is impossible to identify which records have this issue analysis was carried out for 2004 and 2005 records in the same way.
There is a fourth measure of hourly pay which can be compared to the measure used to examine low pay in the LFS. The LFS methodology uses the stated rate if it is provided; otherwise an hourly rate is imputed using a nearest neighbour model where the derived rate of pay has the most influence. This imputation is applied in order to overcome problems with the LFS derived rate (see Ormerod 2006). As the ASHE does not suffer the same problems the records with a missing stated rate can more simply be filled using the derived rate; this is known as the combined hourly rate, and is the closest approximation in ASHE to the LFS rate.
Differences between stated and derived rates in ASHE
Aggregate level
Table 1 shows the values of various summary statistics for the stated, derived and basic-derived hourly pay variables. The 10th, 25th, 50th, 75th and 90th percentile values are shown along with the mean. ASHE results are published for the mean and median although emphasis is placed on the median as it is less influenced by outliers.
As only half the dataset holds a stated rate and individuals are more likely to have a stated rate if they are in the lower part of the earnings distribution, summary statistics are not expected to be comparable.
The value of all percentile points for the derived rate are higher than the percentile points for the stated rate (column a compared with column d). This is expected as high earners are less likely to have a stated hourly rate. Except for the value of the 10th percentile the other summary statistics for the basic-derived rate of pay (column g) are higher than the derived. The additional components in the derived rate make a
difference mainly at the top end of the distribution. The mean rate for the derived is higher than for the basic-derived for this reason. The pattern is similar for records involved in the low pay estimates (columns b, e and h).
Table 1: Summary statistics for stated, derived and basic-derived hourly pay, 2004-2005
Stateda Stateda Stateda Derived Derived Derived
Basic-derived derived Basic- Basic-derived
All records
Hours and low
pay weight
Hours and low
pay weightb
Derived
presentc
All records
Hours and low
pay weight
Hours and low
pay weightb
Stated presentd
All records
Hours and low pay
weightb
Hours and low pay weight
Stated presentd
a b c d e f g h i
£ £ £ £ £ £ £ £ £
2004 10% 4.60 4.63 4.63 4.94 5.00 4.69 4.88 4.99 4.65
25% 5.21 5.21 5.25 5.25 6.01 6.16 5.35 5.92 6.01
50% 6.49 6.49 6.59 6.59 8.45 8.63 6.91 8.22 8.42
75% 9.27 9.27 9.51 9.51 12.83 13.08 9.92 12.60 12.83
90% 14.36 14.36 14.47 14.47 19.11 19.35 14.91 18.73 18.97
Mean 11.03 11.03 11.31 11.31 10.89 11.08 8.89 10.66 10.84
2005 10% 4.88 4.90 4.90 5.18 5.25 4.95 5.10 5.15 4.90
25% 5.39 5.39 5.40 5.40 6.29 6.40 5.50 6.10 6.21
50% 6.50 6.50 6.53 6.53 8.76 8.94 6.92 8.41 8.58
75% 9.05 9.05 9.24 9.24 13.39 13.61 9.69 12.87 13.12
90% 13.62 13.62 14.00 14.00 20.03 20.26 14.14 19.16 19.37
Mean 12.78 12.78 13.15 13.15 11.75 11.62 8.72 10.92 11.10
Notes:
a Following amendments for factor error
b For records with a positive value for basic hours and low pay weight c For records where a derived rate of pay is also present
Individual level
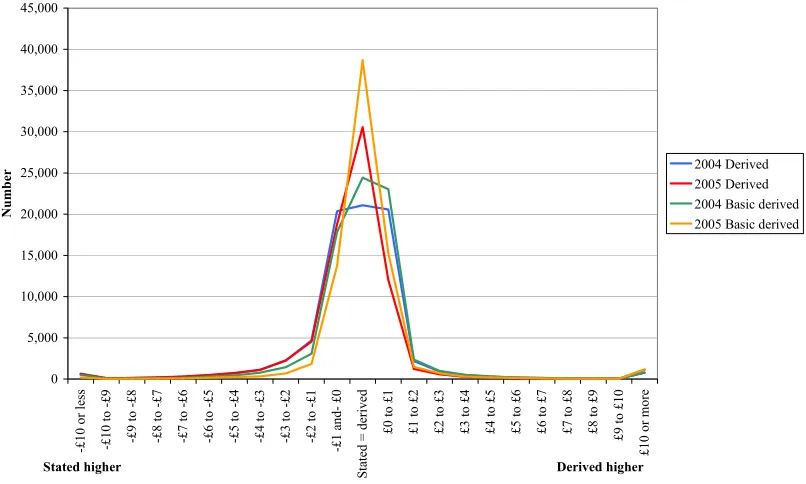
Figure 2 shows the difference between the stated and the two different derived rates in £1 bands for records having both a stated and derived variables. Both variables were rounded to the nearest penny before comparison to avoid negligible differences affecting the analysis. Table 2 summarises the number and percentage of record involved. 0 5,000 10,000 15,000 20,000 25,000 30,000 35,000 40,000 45,000 -£ 10 or le ss -£
10 to -£
9
-£9 to -£
8
-£8 to -£
7
-£7 to -£
6
-£6 to -£
5
-£5 to -£
4
-£4 to -£
3
-£3 to -£
2
-£2 to -£
1 -£ 1 a £ 0 St at ed = der ived £0 to £ 1 £1 to £ 2 £2 to £ 3 £3 to £ 4 £4 to £ 5 £5 to £ 6 £6 to £ 7 £7 to £ 8 £8 to £ 9 £9 to £1 0 £10 or mor e Nu mb
er 2004 Derived2005 Derived
2004 Basic derived 2005 Basic derived
Stated higher Derived higher
Table2: Number and percentage of records with differences between the stated and derived rates, 2004-2005
Stated and derived Stated and basic-derived 2004 2004 2005 2005 2004 2004 2005 2005
Number % Number % Number % Number % Derived higher 30,968 40 29,337 39 24,841 32 17,452 23 Stated higher 25,798 33 15,726 21 28,567 37 19,490 26 Variables equal 21,081 27 30,555 40 24,420 31 38,676 51
Total records 77,847 100 75,618 100 77,828 100 75,618 100
The number of records that can be compared for the stated and derived rate is
Can we explain the differences between the stated and derived rate?
As expected from the definition, when comparing the stated and basic-derived rate of pay more are equal, 31 per cent in 2004 and 51 per cent in 2005. This compares with 27 per cent in 2004 and 40 per cent in 2005 for the stated and derived rate. In both years the derived value tends to be higher than the stated and the basic-derived lower, but with substantial variation. This suggests that the reasons for the differences vary over individuals.
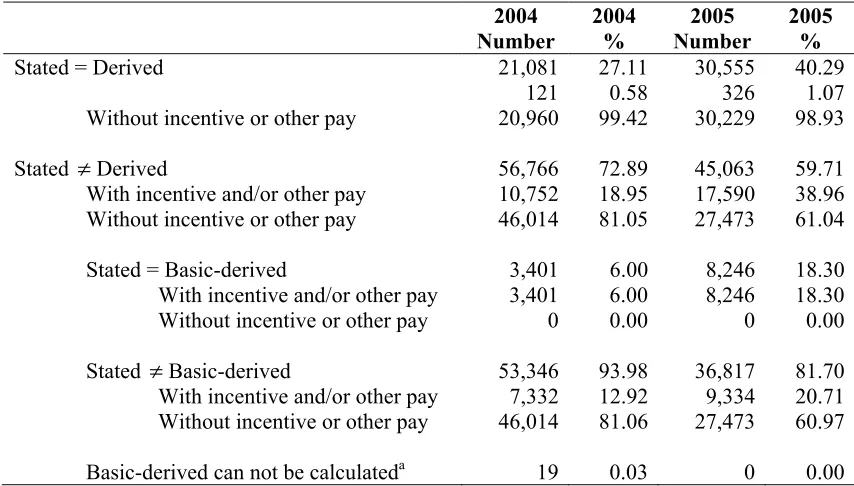
[image:7.595.83.510.307.550.2]It is useful to break down Table 2 by the components of basic pay to try to identify any systematic effects. Table 3 shows the presence or absence of incentive and/or other payments by whether the stated and derived rate are equal or not.
Table 3: Presence of incentive and / or other payments by differences between stated and derived hourly rate, 2004-2005
2004 2004 2005 2005 Number % Number %
Stated = Derived 21,081 27.11 30,555 40.29
121 0.58 326 1.07 Without incentive or other pay 20,960 99.42 30,229 98.93
Stated ≠Derived 56,766 72.89 45,063 59.71 With incentive and/or other pay 10,752 18.95 17,590 38.96
Without incentive or other pay 46,014 81.05 27,473 61.04
Stated = Basic-derived 3,401 6.00 8,246 18.30 With incentive and/or other pay 3,401 6.00 8,246 18.30 Without incentive or other pay 0 0.00 0 0.00
Stated ≠Basic-derived 53,346 93.98 36,817 81.70 With incentive and/or other pay 7,332 12.92 9,334 20.71
Without incentive or other pay 46,014 81.06 27,473 60.97
Basic-derived can not be calculateda 19 0.03 0 0.00
Notes:
a The basic-derived can not be calculated, despite the fact that the derived can as these records do not have basic pay information but have incentive and / or other payments
As expected, for records where the stated rate is equal to the derived rate almost all of these records do not have incentive or other payments. Only a small number of
records with incentive and/or other payments do not follow the guidance on the form and include incentive and/or other payments in their stated hourly rate.
These records would be expected to have an equal stated and basic-derived rate. However, of the 11,000 records in 2004 that are expected to have an equal stated and basic-derived rate only 3,400 are actually equal, the other 7,400 have differences that can not be explained by the difference in definition between the stated and derived. Of the 18,000 records in 2005 that are expected to have an equal stated and basic-derived rate only 8,000 are actually equal, the other 9,000 have differences that can not be explained by the difference in definition between the stated and derived. Table 4 summarises the errors.
There are a small number of cases where basic pay is missing but one or more of the other components involved in the derived rate are present. In this case the derived rate is calculated but the basic-derived rate cannot be calculated. As individuals should not have a basic pay of zero it is recommended that derived rates for these individuals be recorded as missing.
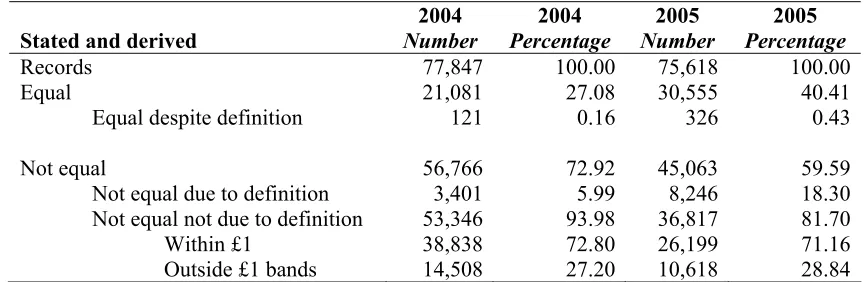
[image:8.595.80.513.375.516.2]If numbers are not exactly equal, there may be rounding or calculation errors. Table 5 breaks down the problematic totals in Table 4 into those which might be due to rounding error.
Table 4: Difference between stated and derived rate that can be explained by definitional differences and rounding, 2004-2005
2004 2004 2005 2005 Stated and derived Number Percentage Number Percentage
Records 77,847 100.00 75,618 100.00 Equal 21,081 27.08 30,555 40.41
Equal despite definition 121 0.16 326 0.43
Not equal 56,766 72.92 45,063 59.59 Not equal due to definition 3,401 5.99 8,246 18.30 Not equal not due to definition 53,346 93.98 36,817 81.70 Within £1 38,838 72.80 26,199 71.16 Outside £1 bands 14,508 27.20 10,618 28.84
Individual records were examined in detail to look at other possible reasons for the differences a very small number of records showed differences due to providing a stated rate with components included twice or incorrect components included. However, the number of these was not significant. It is recommended that further investigation be carried out, by contacting respondents, to investigate these differences, especially where they are large.
therefore this record has one variable showing the individuals as being paid less than the NMW and one variable showing the individual is paid above the NMW. The effect on the low pay estimates is investigated in the next section.
Further investigation has been carried out on the individual records to look at the differences between the stated and derived rate where these cannot be explained. The results of this have been inconclusive as it is difficult to make inferences only from observed responses. For example, it is thought that employers following inappropriate advice about using a 52-week year to calculate wages (see below) may be responsible for some of the low estimates for derived rates. A counter-factual calculation suggest that this is plausible for a small number of employees. However, given the small numbers, this may just be coincidence. In summary, it is unlikely that the unexplained differences can be resolved retrospectively.
Effect on low pay estimates
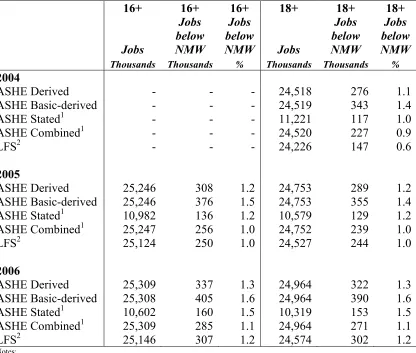
The ASHE methodology for low pay involves creating weighted tables of the number of individuals above and below the NMW. This estimate is based on the derived hourly rate. It is possible to apply the same methodology to create estimates based on the stated, basic-derived and combined rate. Table 5 shows these estimates for 2004 to 2006. The LFS estimates are included for comparison purposes.
Table 5: Estimates of the number of jobs paid below the NMW using various hourly pay measures, 2004-2006
16+ 16+ 16+ 18+ 18+ 18+
Jobs
Jobs below NMW
Jobs below
NMW Jobs
Jobs below NMW
Jobs below NMW Thousands Thousands % Thousands Thousands %
2004
ASHE Derived - - - 24,518 276 1.1
ASHE Basic-derived - - - 24,519 343 1.4
ASHE Stated1 - - - 11,221 117 1.0
ASHE Combined1 - - - 24,520 227 0.9
LFS2 - - - 24,226 147 0.6
2005
ASHE Derived 25,246 308 1.2 24,753 289 1.2
ASHE Basic-derived 25,246 376 1.5 24,753 355 1.4
ASHE Stated1 10,982 136 1.2 10,579 129 1.2
ASHE Combined1 25,247 256 1.0 24,752 239 1.0
LFS2 25,124 250 1.0 24,527 244 1.0
2006
ASHE Derived 25,309 337 1.3 24,964 322 1.3
ASHE Basic-derived 25,308 405 1.6 24,964 390 1.6
ASHE Stated1 10,602 160 1.5 10,319 153 1.5
ASHE Combined1 25,309 285 1.1 24,964 271 1.1
LFS2 25,146 307 1.2 24,574 302 1.2
Notes:
- Not applicable as 16-17 year rate not introduced
1 Some basic validation carried out on stated rate where factor errors were obvious 2 Revised LFS methodology devised in 2005 based on calendar quarters
Figure 3: Estimates of the percentage of jobs paid below the NMW using various hourly pay measures for individuals aged 18 and over, 2004-2006
0.0 0.2 0.4 0.6 0.8 1.0 1.2 1.4 1.6 1.8
2004 2005 2006
P
ercen
ta
ge
[image:10.595.100.433.544.746.2]The ASHE combined measure is closer to the LFS measure, even in 2004 when the stated rate was subject to a number of problems. In 2005 the difference is negligible. Note that the combined measure is always below the stated measure, implying that, amongst the low paid, the stated rate is generally higher than the derived rate when only the latter is present.
This is consistent with Ormerod and Ritchie (2007a), who found the same result in the LFS data. They also showed that the level of low paid estimated in the LFS varies depending upon how close the NMW is to certain ‘focal points’, due to rounding in the derived rate; it is rare for the LFS stated rate to be below the NMW. Something similar may be at work here, although Ormerod and Ritchie (2007a) note that there is no evidence that the ASHE data is being rounded. The employee may have a stated rate at or above the NMW, but the actual hourly rate paid in the survey week may simply resolve itself into a different amount.
Ormerod and Ritchie (2007b) showed that part of the difference between the LFS and ASHE estimates can be a timing issue, as the proportion of low paid varies
continually throughout the year. Alongside this and the rounding argument of
Ormerod and Ritchie (2007a), it seems, then, that another source of the differences in estimates of the low paid has been identified.
Precision affects estimates
One final concern reflects the mathematical reality of calculating complex estimates based upon a simple yes/no answer such as the number of people earning below the NMW. As noted above, stated rates may be on the NMW, but actual rates might be resolved differently. Although the overall impact on earnings on some variation around the minimum wage is negligible, the impact on the minimum wage is not, as the low pay calculation only sees one side of the variation.
For example, if two employees have a stated rate of £5.05 per hour, both are being paid the 2006 NMW and the number of low paid is zero. If inaccuracies in
calculations by employers lead to these wages being derived as £5.03 and £5.07 per hour, the mean earnings are unchanged. However, the number of low paid has now increased by one, while the number at or below the NMW has fallen.
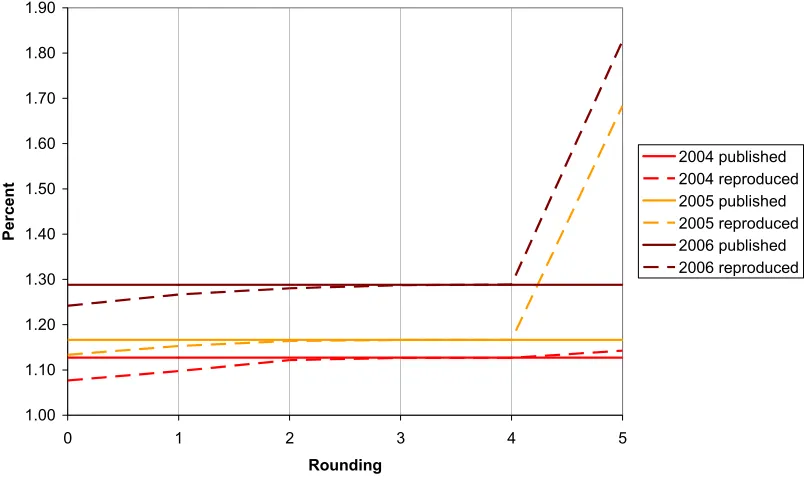
Figure 4: Proportion of low paid, with rounding to different decimal places at intermediate stages in the calculation of estimates, 2004-2006
1.00 1.10 1.20 1.30 1.40 1.50 1.60 1.70 1.80 1.90
0 1 2 3 4 5
Rounding
Pe
rc
ent
2004 published 2004 reproduced 2005 published 2005 reproduced 2006 published 2006 reproduced
The estimated percentage of low paid increases as the ‘precision’ of estimates is increased. This is because numbers just below the NMW cut-off are less likely to be rounded up to the NMW. The decision to round at four decimal places in intermediate calculations was taken as this seemed to be indicate a point of some stability.
It was also observed that even the transfer of data between statistical packages caused small, but noticeable changes in the low pay estimates. This is still being investigated. The sensitivity of the results to small changes in the data or calculation is exacerbated by the fact that the low pay estimates are based upon small numbers of observations, and then need to be weighted up to give population estimates. Hence moving a small number of observations from one side of the NMW cut-off point to the other makes a large difference.
Conclusion
This work supports the use of the derived rate of pay in the ASHE low pay estimates. The derived hourly rate is the most accurate measure of pay per hour. However when the information on total hours and total earnings comes from household surveys the derived rate is inaccurate. In this case the stated rate should be used. The ASHE and LFS low pay estimates are therefore based on a different measure of hourly pay.
ASHE estimates produced on the same basis as the LFS estimates are very similar. This suggests that the estimates can be partially reconciled on the basis of the methodology used. Previously users of low pay estimates assumed that differences mainly arose from the differences in the sources. This analysis suggests that this is not the case. Other investigations have also showed that ASHE and LFS data are more similar than previously thought.
Additional validation, based on the relationship between the stated and derived hourly rate, have also been identified. These are important for the accuracy of the estimates because small differences have a big impact, due to the way that the estimates are created.
Endnotes
1 The ASHE is a one per cent sample of employees on the Pay As You Earn (PAYE) register. Employers are surveys, requesting information about hours and earnings of their employees. Since the ASHE replaced the New Earnings Survey (NES) in 2004 it is considered the most reliable source of information on earnings including those of low earners. The NES sample was extended to improve the coverage of the low paid and imputation and weighting was applied to ensure the sample was representative of the population. For more information on ASHE see:
http://www.statistics.gov.uk/STATBASE/Source.asp?vlnk=1319&More=Y
3 The National Minimum Wage (NMW) was introduced in the UK in 1999. The Low Pay Commission (LPC) makes recommendation to the government on the level of the NMW. There are three NMW rates:
• The Adult Rate for workers aged 22 and over.
• The Development Rate for workers aged 18 - 21 inclusive.
The Development Rate can also apply to workers aged 22 and above during their first 6 months in a new job with a new employer and who are receiving accredited training.
• The 16 - 17 year old rate.
The NMW rates at April (1999-2007) are:
Youth Development Adult (Aged 16-17) (Aged 18-21) (Aged 22 and over)
1999 3.00 3.60
2000 3.00 3.60
2001 3.20 3.70
2002 3.50 4.10
2003 3.60 4.20
2004 3.80 4.50
2005 3.00 4.10 4.85
2006 3.00 4.25 5.05
2007 3.30 4.45 5.35
The NMW is uprated in October of each year. ONS official estimates measure the rate at April due to the data source being available at this time.
4 The Labour Force Survey (LFS) is a survey of households living at private addresses in Great Britain. It is the main source for information on the labour market in the UK. It is a random household survey of approximately 57,000 households every three months. As well as private households, the survey includes people living in student residence halls and NHS accommodation. For more information on the LFS see:
http://www.statistics.gov.uk/STATBASE/Source.asp?vlnk=358
Acknowledgements
The authors would like to thank colleagues from ONS, Low Pay Commission,
References
Ormerod (2006) ‘Labour force survey low pay estimates: Method of dealing with second jobs’. Labour Market Trends, Volume 114, No. 7, pp 233-239.
www.statistics.gov.uk/downloads/theme_labour/LMT_July06.pdf
Ormerod C and Ritchie F (2007a) ‘Measuring low pay: The importance of timing’. http://www.statistics.gov.uk/cci/article.asp?id=1730