Session Number: Plenary Session 3: Measurement of Knowledge and Intangible Capital Time: TUESDAY, AUGUST 26, MORNING
Paper Prepared for the30th General Conference of
The International Association for Research in Income and Wealth
Portoroz, Slovenia, August 24-30, 2008
The UK Research and Development Satellite Account: A Preliminary Analysis
Fernando Galindo-Rueda, Damian Whittard, Peter Evans and Michael Hatcher (Cardiff University)
For additional information please contact:
Name: Fernando Galindo-Rueda
Affiliation: The Department for Business, Enterprise & Regulatory Reform, United Kingdom
Paper Prepared for the 30
thGeneral Conference of the International
Association for Research in Income and Wealth
Portorož, Slovenia August 24–30, 2008
The UK Research and Development Satellite Account:
A Preliminary Analysis
Authors: Fernando Galindo-Rueda (The Department for Business, Enterprise & Regulatory Reform), Damian Whittard and Peter Evans (Office for National Statistics, UK), Michael Hatcher (Cardiff University)
Abstract
This paper presents preliminary analysis treating the consumption of research and experimental development (R&D) as investment in an intangible scientific asset, in line with proposed revisions to the United Nations System of National Accounts. The purpose of this analysis is to communicate to users of statistics the potential impacts of capitalising R&D in the National Accounts in a new set of satellite accounts. Capitalising R&D raises the level of UK GDP by approximately 1.5 percent, but has limited impact on estimates of recent GDP growth. In addition, we investigate the robustness of our results to key assumptions, finding significant sensitivity only at a relatively disaggregated level. The figures presented are preliminary, based on experimental methods, and should therefore be interpreted with caution. The authors welcome comments and complementary evidence that can be used to substantiate or revise the assumptions made throughout the paper.
Keywords: National Accounts, R&D, UK, Investment
Developing an R&D satellite account for the UK: a
preliminary analysis
SUMMARY
This paper presents preliminary analysis treating expenditure on research and experimental development (R&D) as investment in an intangible scientific asset, in line with ongoing revisions to the UN System of National Accounts. The purpose of this analysis is to communicate to users of statistics the potential impacts of
capitalising R&D in the National Accounts in a new set of satellite accounts.
Capitalising R&D raises the level of UK GDP by approximately 1.5 per cent, but has limited impact on estimates of recent GDP growth. We also investigate the robustness of our results to key assumptions, finding significant sensitivity only at a relatively disaggregated level. Our figures are preliminary, based on experimental methods, and should therefore be interpreted with caution. The authors welcome comments and complementary evidence that can be used to substantiate or revise the assumptions made throughout the paper.
Introduction
There is considerable consensus amongst economists, politicians and the public in general that research and experimental development (R&D) is a key determinant of economic growth and improvements in living standards. This is reflected by the importance of R&D performance indicators in policy making, as demonstrated by the UK Government’s Public Service Agreements and the EU Lisbon competitiveness indicators, which track R&D expenditure as a ratio to gross domestic product (GDP). ONS plays a major role in collecting the required evidence and publishing such indicators, which have National Statistics status.
The Organisation for Economic Co-operation and Development (OECD) provides detailed guidance on how R&D expenditure should be measured in its Frascati Manual (FM).1 This measurement framework is independent from the National Accounts (NA), which provide a systematic statistical framework for summarising and understanding economic events and the wealth of an economy. It is therefore legitimate for users of statistics to ask how R&D is reflected in the official statistics and whether the measurement framework enables an adequate understanding of the economic impacts of R&D.
International standards within the 1993 System of National Accounts (SNA) and the 1995 European System of Accounts (ESA) set out how countries must record economic transactions and wealth in their National Accounts. According to these guidelines, business expenditure on R&D is treated as intermediate consumption, namely goods produced and consumed in the same period for the production of other goods and services. For instance, the output of an R&D laboratory, affiliated to a
1
pharmaceutical company or undertaking R&D on its behalf, is counted as output of the R&D sector but as intermediate consumption of the ‘using’ pharmaceutical sector. By treating its use as a current expenditure, the production of R&D does not directly contribute to increasing gross value added (GVA) or GDP, which net out such expenses from gross output. 2
The treatment of R&D consumption as current expenditure is at odds with the
evidence that the knowledge acquired as a result of R&D often delivers benefits to the owner of the intellectual property over several years. That is in essence the National Accounts definition of investment. From that point of view, R&D should be treated no differently from the production of a new piece of capital equipment with an expected service life over a year.3 The current treatment is unsatisfactory for three main reasons. Firstly, it is inconsistent that the artistic and literary originals are recognised in the System as produced assets while scientific originals achieved through R&D are not. Secondly, exclusion from the production boundary leads to estimates of GDP that may provide a partial picture of the flow of goods and services produced in the economy at the point in which structural changes may lead to
increased specialisation in the production of intellectual goods. Thirdly, the analysis of the sources of productivity growth can also be incomplete as a result, because productivity changes will not be attributable to the accumulation of knowledge assets. This could in turn distort fiscal and monetary policy making insofar as potential supply could be underestimated.
Statistical agencies, including ONS, are aware of these limitations and agree that measurement frameworks need to evolve to reflect the changes in the economy and users’ needs. These demands need to be assessed against the need for comparability across countries and over time, while addressing the problems involved in the reliable valuation of R&D as an asset. It is in this context that the United Nations Statistical Commission officially called in 2003 for an update of the 1993 SNA in order to reflect new user needs and developments in the economy. Once agreed, the SNA revisions will lead to a revision of the ESA. This is likely to result in a pan-European requirement for member countries to produce supplementary tables reporting the new proposed treatment for R&D. Some countries have already published preliminary satellite accounts on R&D and a few, including the United States, have already developed a satellite account as a prelude to capitalisation in the core accounts. Satellite accounts are extensions to the main National Accounts that seek to facilitate
2
Currently, it is only when R&D is consumed by non-market producers or by the rest of the world that R&D contributes directly to GVA and GDP. For example, government’s health expenditure includes expenditure on medical R&D. This is part of non-market health output which is accounted for as government’s final consumption. R&D also contributes directly to GDP through is impact on the trade position. Since the UK delivers more R&D services to, than it buys from, the rest of the world, the net impact is positive.
3
the analysis of the wider impact of economic change using similar concepts and classifications while avoiding conflict with the core conceptual framework.
This paper documents the preliminary outcomes of an ongoing research programme aiming to develop satellite accounts that treat R&D consumption as investment in an intangible ‘scientific knowledge’ asset. While the revision timetable spans a number of years up to 2014 and detailed guidance is yet to be produced, Eurostat has asked statistical agencies to conduct early assessments and communicate the potential impacts to users before detailed mandatory guidance is issued. Figures in this paper should therefore be treated with caution, noting their preliminary and experimental status.
Part I: The capitalisation of R&D expenditure
Challenges and methods
What are the main R&D measurement challenges?
R&D exhibits a number of features that complicate its measurement on a conceptual and practical basis within an accounting framework:
• R&D knowledge exhibits public good features because it is not depleted as it is consumed
• access to R&D knowledge can be restricted, but companies use secrecy to prevent their knowledge from being used by others without paying for it • partly as a result, R&D is often performed on own-account, for internal use
within companies
• each R&D project is unique, therefore limiting the basis for value comparisons • the public good features of R&D knowledge provide a rationale for Government
involvement in the funding and performance of R&D, thus affecting valuations
The recording of scientific knowledge transactions in the SNA
Market contract research involves the undertaking of an R&D project by one firm on behalf of another, with the objective of obtaining knowledge that will be owned by the customer firm. A producer’s R&D output is treated as intermediate consumption by the purchaser of the services. In the SNA revision, the consumption of R&D would be treated as Gross Fixed Capital Formation (GFCF) instead of intermediate
consumption. While it is often the case that the internal R&D transactions within companies are not recorded, the output of R&D should always be captured in the SNA revision because its use will no longer be treated as intermediate consumption that offsets output, but as GFCF of a produced intangible asset which adds to GDP.
A key problem with the current methodology is that no connection is made between the R&D activity that leads to improved scientific knowledge and its appearance as intellectual property. When a patent or other form of protection to scientific
revision, the recognition of scientific originals requires the outright removal of patented entities from the System.4 In the 1993 SNA, the licensing of intellectual property is treated as lessors’ output but matched by lessees’ intermediate
consumption. This treatment is also appropriate for the SNA revision because the licensee only buys services from the asset rather than the knowledge asset itself.
Scope of the R&D capitalisation exercise
Defining R&D
The first step in this exercise is to define what economic activities can be consistently characterised as R&D for the purposes of capitalisation within the National Accounts. The SNA provides a functional description rather than a formal definition of R&D, excluding related activities such as routine technical testing and market research, and placing a strong emphasis on the fact that R&D must help deliver new goods and improved processes. The Frascati Manual definition has potentially a wider scope, defining research and experimental development as ‘… creative work undertaken on a systematic basis in order to increase the stock of knowledge, including knowledge of man, culture, and society, and the use of this stock of knowledge to devise new applications’ (OECD, 2002). In the absence of ‘an appreciable element of novelty and the resolution of scientific uncertainty’, activities are not considered to be R&D. While it has been agreed that the FM definition should provide the basis for
recognising a new scientific knowledge asset, it has been made clear this should not be interpreted as including human capital as capital formation within the System.
Success, failure and the ‘at cost’ valuation approach
Accounting standards do not allow individual businesses to capitalise R&D
expenditure when there is substantial uncertainty about its value. While many projects are unlikely to recoup their costs, a few will succeed. For profit-seeking firms,
economic theory argues that they are willing to invest in R&D up to a level where the marginal pound spent is expected to deliver a marginal return at least as high as the next best investment opportunity. This ‘at cost’ approach is the preferred basis for the valuation of the output of R&D because, as explained, it is not systematically traded in transparent markets where prices aggregate all the relevant information. This is consistent with the approach adopted for capitalising mineral exploration costs, which are included in GFCF whether or not the exploration is successful.
R&D in the social sciences
R&D in the social sciences and humanities is an R&D subsector and a product subcategory in the SNA. Both the concept and units in this sector are also covered by the FM definition and sources. Although there may be some measurement bias against including social science R&D, for example, due to their ineligibility for R&D tax credits, this article assumes no adjustment is required to account for omitted R&D in
4
the social sciences. In the UK, the social science R&D sector accounts for a very small fraction of business R&D expenditure, less than 1 per cent, with approximately £30 million worth of estimated R&D. This is in contrast with the reported turnover for the sub-sector which is £170 million, which suggests that an upward adjustment may be necessary once more detailed international guidance is available.
Potential overlap with other recognised intangible investments
R&D and software development are intimately related, but software is already recognised as a produced asset in the National Accounts while scientific originals are not. The methodology for estimating own-account software development includes the earnings of programmers that could be working on genuine R&D projects. Given the lack of auxiliary information, the complexities of the interdependencies, and the willingness to avoid revising software estimates, this analysis deducts 50 per cent of total R&D in the computer services industry, assuming that such magnitude is already counted in and correctly assigned to software estimates.
Inclusion of non-market R&D, exclusion of spillovers
In line with OECD recommendations, only the portion of economic benefits arising from the acquisition of R&D should be recorded as an asset in the System. It is this magnitude that will theoretically match with the R&D cost estimate used to estimate R&D output. Neither rented knowledge (through patent licensing for example) nor knowledge freely available following a patent expiration would count as an asset. However, R&D undertaken and effectively owned by non-market producers such as government is to be included in the System. This treatment is analogous to that of toll-free roads.
Capitalisation methodology options
There are three possible approaches to compiling an experimental set of accounts that treat R&D knowledge as an asset:
Same sources, different allocation to uses
This option entails using data on R&D services currently recorded in the Input-Output Supply and Use Tables (SUTs) and reclassifying expenditure from intermediate consumption to investment. This method is fairly straightforward to implement but has two key shortcomings. Firstly, SUTs underestimate the extent of R&D output because many businesses do not report separately on their own-account R&D
activities by identifying a separate establishment, as recommended by the 1993 SNA. Although this underestimation has no impact on GDP when R&D is treated as
intermediate consumption, capitalising only identified R&D output would underestimate the true impact on GDP. Secondly, expenditure on R&D by
New integrated sources and methods
This option would lead to revised statistical inquiries with more detailed questions on R&D output and purchases which can then be built into core systems. This would involve considerable changes to the Annual Business Inquiry, which is the major source of output and purchases data used for constructing SUTs. Although this should be considered thoroughly as a long-term alternative for full consistency with the core accounts, the substantial resource implications make it unfeasible for the purposes of a preliminary satellite account.
Bridging approach from Frascati Manual sources
This approach has been adopted by all the statistical agencies that have already produced R&D capitalisation estimates, including Australia (Australian Bureau of Statistics 2004), the US (Robbins 2005; Okubo et al 2006; Robins and Moylan 2007), Israel (Peleg and Brenner 2006) and The Netherlands (De Haan et al 2006).
Because the FM methodology differs from National Accounts measurement
principles, a number of adjustments need to be made to adjust FM R&D expenditure to measures which are conceptually consistent with the National Accounts. The main advantage of this method is that, by and large, it is not necessary to collect additional sources at the current development stage and despite the need for assumptions, it makes the preferred choice for the purposes of evaluating the impacts of R&D
capitalisation in a satellite account. This is also the OECD recommended approach on the compilation of R&D satellite accounts within its forthcoming Handbook on Measuring Intellectual Property, to be released in 2008, in coordination with Eurostat (OECD 2007).
Evaluating the impact of R&D capitalisation in the National
Accounts: R&D resources and uses
Outline of the FM-SNA bridging methodology
This article proposes a methodology to estimate the impact of R&D capitalisation on the National Accounts that is consistent with the product by product balancing of supply and demand of resources. This is done within the context of the latest available SUTs, consistent with the ONS Blue Book 2006 (BB06), which includes figures from 1997 up to 2004 (ONS 2006a, 2006b, 2006c).
Because the FM sources gather information on the cost of performing (the FM byword for ‘producing’) R&D, the first step involves adding up such costs leading to an overall estimate of R&D gross output. This is calculated by adding intermediate consumption, compensation of employees, gross operating surplus and taxes less subsidies on production linked to R&D production across all sectors. In this version, no detailed industry analysis is provided. In future development stages, detailed production accounts should be built up from the individual establishment level. The gross output estimate at basic prices is used to define the domestic output of R&D in the supply table. Additional imports and tax information helps estimate the full value of R&D resources. This total will be balanced to total uses (demand) of R&D.
to apportion total demand across different uses and users, completing a full picture of R&D supply and uses.
In this exercise, the new supply-use estimates for R&D services ‘replace’ BB06 R&D estimates. However, further steps are required. By recognising an additional asset in the System, its consumption by non-market producers needs to be added to their output, which is generally measured at cost of production. Furthermore, since the FM may capture R&D in these units assigned to other public services in BB06, it is then necessary to make corrections to avoid double-counting of non-market output.
The Frascati sources for the experimental R&D satellite account
Due to an emphasis on simplicity and transparency of estimates in this preliminary satellite account, this article builds on two main sets of published inputs:
‘Research and Development in UK Business’ (MA14) is an ONS publication based on business surveys that documents R&D expenditure in the Business Enterprise (BE) sector, with detail by type of expenditure on inputs, funding sector, civil versus defence uses and functional type of R&D (e.g. basic or applied research), R&D
personnel and product field the R&D contributes to, for example, pharmaceuticals and transport equipment. The BERD expenditure split by input is crucial in identifying the necessary bridging changes to a National Accounts-consistent output figure. In the absence of similar input data for non-market producers, this article assumes all sectors have identical cost structures.
[image:10.595.73.563.570.764.2]The second and main source of information is the ONS release on ‘UK gross domestic expenditure on R&D (GERD)’. This provides FM-consistent estimates for the total R&D expenditure performed in, and funded by, the different FM sectors, building on a number of statistical and administrative sources. The construction of bridge tables for capitalisation in the National Accounts relies heavily on Table 1 in the release, which reports R&D performed in the UK in each sector according to source of funding. This helps translate the performance and funding information in GERD into ‘National Accounts-comparable’ information about supply and use. Figures for 2004 are reported in Table 1.
Table 1
R&D performed in the UK in each sector according to source of funding, 2004
£ million, current prices Sector carrying out the work (performer)
Sector providing the
funds (funder) Gov RCs HE BE PNP Total (UK) Abroad Total
Government (Gov) 1,053 120 242 1,325 82 2,822 428 3,250
Research councils (RCs) 3 630 1,354 9 88 2,084 220 2,304
Higher education funding
councils (HEFC) 0 0 1,804 0 0 1,804 0 1,804
Higher education (HE) 1 10 212 0 6 229 0 229
Business enterprise (BE) 158 37 243 8,484 69 8,991 1,421 10,412
Private non-profit (PNP) 11 78 761 5 105 960 0 960
Abroad 15 54 388 2,993 57 3,507 - 3,507
Total 1,241 929 5,004 12,816 407 20,397 2,069 22,466
Performance, funding and ownership of R&D
For bridging purposes, it is necessary to draw a correspondence between the FM sectors and the institutional sectors in the SNA. For the purposes of the satellite account, some simplifying assumptions are made and summarised in Table 2.
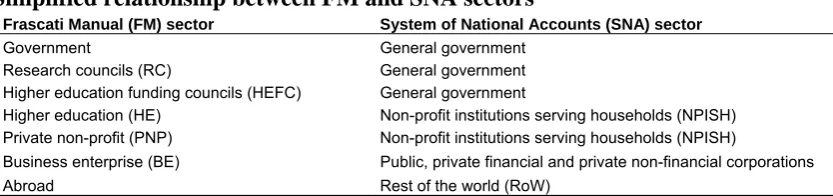
[image:11.595.94.511.315.413.2]Government, research councils and the higher education funding councils make up the total of the general government sector for R&D purposes. Higher education (HE) is entirely assigned to the non-profit institutions serving households (NPISH) sector, grouped with private non-profit (PNP) organisations, which includes charitable organisations that perform R&D. The business enterprise (BE) sector comprises three different SNA sectors: public corporations, private financial corporations and private non financial corporations. They account for 5, about 1 and 94 per cent of BE R&D, respectively. Quasi-corporations such as partnerships and sole traders account for a very marginal share of BERD. Finally, the FM ‘abroad’ sector is identified with the rest of the world sector in the SNA.
Table 2
Simplified relationship between FM and SNA sectors
Frascati Manual (FM) sector System of National Accounts (SNA) sector
Government General government
Research councils (RC) General government Higher education funding councils (HEFC) General government
Higher education (HE) Non-profit institutions serving households (NPISH) Private non-profit (PNP) Non-profit institutions serving households (NPISH)
Business enterprise (BE) Public, private financial and private non-financial corporations
Abroad Rest of the world (RoW)
Source: National Statistics
Introducing R&D as an asset in the system requires a clear definition of ownership. The characteristics of R&D make this task particularly difficult, which is partly why the FM methodology does not attempt to measure ownership. However, information about who funds R&D can provide a reasonable first-order approximation to
identifying who owns the output of R&D. There are two main problems to using funding data without further adjustments:
Firstly, funding of R&D is constrained to equal total R&D expenditure and is in most cases collected from the performers rather than the funders of R&D. As a result, it will fail to reflect the full costs of R&D to the user of the R&D services. The
assumption made in this article is that funding provides a good approximation to the share (rather than the level) of R&D output performed in a sector which is funded by another.
Table 3
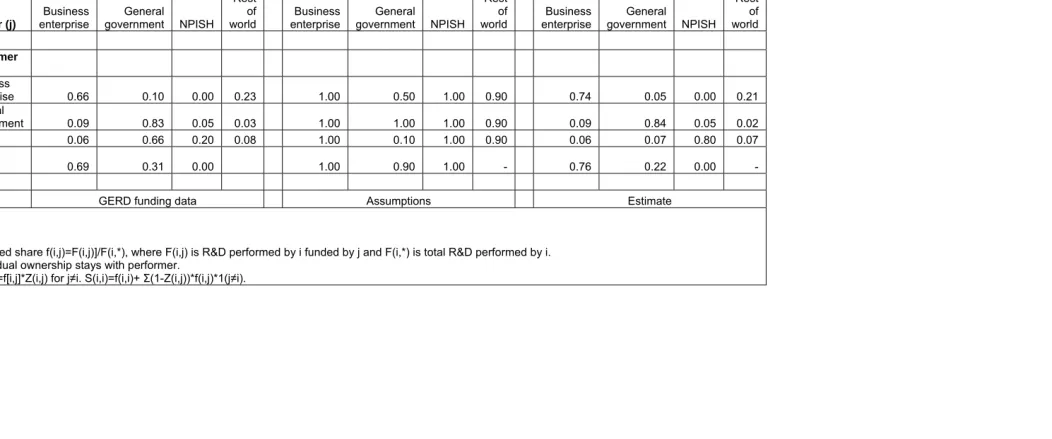
Funding of R&D in 2004 and sectoral ownership assumptions Share of sector i’s R&D funded by
sector j
Share of sector i’s R&D funded by j that is owned by sector j
Share of sector i’s R&D owned by sector j
f[i,j]1 Z(i,j)2 S(i,j)3
Funder (j)
Business enterprise
General
government NPISH Rest
of world
Business enterprise
General
government NPISH Rest
of world
Business enterprise
General
government NPISH Rest
of world
Performer (i)
Business
enterprise 0.66 0.10 0.00 0.23 1.00 0.50 1.00 0.90 0.74 0.05 0.00 0.21
General
government 0.09 0.83 0.05 0.03 1.00 1.00 1.00 0.90 0.09 0.84 0.05 0.02
NPISH 0.06 0.66 0.20 0.08 1.00 0.10 1.00 0.90 0.06 0.07 0.80 0.07
Rest of
world 0.69 0.31 0.00 1.00 0.90 1.00 - 0.76 0.22 0.00 -
Source GERD funding data Assumptions Estimate
Notes:
1 Funded share f(i,j)=F(i,j)]/F(i,*), where F(i,j) is R&D performed by i funded by j and F(i,*) is total R&D performed by i. 2 Residual ownership stays with performer.
Table 3 is structured in three main panels. The panel in the left depicts the share of R&D performed in sector ‘i’ in each row funded by each sector ‘j’ in columns, using the estimates for 2004 provided in Table 2 above. The central panel summarises the assumptions about the share of funds provided by ‘j to ‘i’ which do not involve ownership by ‘j’. For example, of the total funds provided by government to the business sector, the table indicates this article assumes that only 50 per cent is undertaken as procurement (owned by government) while the rest consists of grants. This proportion falls to 10 per cent for funds provided to the NPISH sector, because of the significant share of grants to the HE sector allocated by the funding councils. R&D funded by the rest of the world is adjusted for the possibility that some of the funds provided to domestic sectors are grants from abroad. Similarly, R&D performed abroad funded by the UK government is adjusted for the possibility of grants being provided to R&D performers abroad. This article assumes that the residual ‘non-owned’ component of funds is effectively owned by the performer. This is reflected in the estimation of ownership shares over each sector’s R&D output, displayed on the right-hand panel. The assumptions made imply that the business and NPISH sectors own significantly higher shares of their own output than implied by the funding shares, 74 per cent and 80 per cent respectively, compared with 66 per cent and 20 per cent implied by funding. It is important to emphasise that this is entirely based on assumptions that will be tested against more detailed information on R&D grants and procurement data.
Estimating R&D output
Adopting an ‘at cost’ valuation approach for R&D output requires summing over the full range of economic costs incurred in performing R&D. This article relies on input expenditure for R&D available for the business sector to estimate such costs. Table 4 summarises the main similarities and discrepancies between the BERD sources and the requirements of an SNA consistent valuation approach.
Table 4
Relationship between components of R&D expenditure and output
FM R&D expenditure NA economic cost of R&D production Source
Wages and salaries current expenditure Compensation of employees Data from BERD, MA14 Other current expenditure Purchases of goods and services other than R&D Data from BERD, MA14 - Intermediate consumption of R&D services Estimated, various sources
Capital expenditure - Data from BERD, MA14
- Consumption of fixed capital used in R&D production Estimated, various sources - Net operating surplus (net return on capital used) Estimated, various sources - Taxes less subsidies on R&D production ONS from R&D tax credits data
Sum: Intramural R&D expenditure Sum: Gross R&D output at basic prices
Compensation of employees
detailed occupational groups such as scientists, engineers and technicians which can be matched to the BERD occupational categories.
Intermediate consumption of goods and services other than R&D
Information on ‘other current expenditure’ captures all purchases of goods and services necessary for R&D excludes extramural R&D to avoid duplication of primary R&D expenditure in the computation of an overall GERD estimate. This category should include payments for the use of intellectual property such as licence fees to patent holders. According to the Frascati Manual, this is also supposed to include gross taxes on the production of R&D. There is no information about the relevant subcomponents of other current expenditure. For simplicity, this article uses a deflator that combines, equally weighted, the aggregate PPI for purchases of goods and the deflator for technical and testing services output as a reasonable proxy for the specific services required to undertake R&D.
Intermediate consumption of R&D services
There is limited information about the purchases of R&D services required for the production of R&D. If all R&D is treated as GFCF, then the R&D cost component of doing R&D follows from the consumption of R&D capital services as long as there is some residual value for the R&D asset which can be used for other purposes. Some countries have identified all acquisition of extramural R&D as an input in R&D production. Because counting R&D extramural purchases as R&D costs inflates R&D output and R&D intermediate consumption, the impact on most indicators of interest turns out to be nil. However, it seems conceptually preferable to impute only those R&D purchases as R&D intermediate consumption when the R&D performer does not use the outcomes for the production of other goods and services. In this article all the R&D intermediate consumption derives from the R&D purchases by companies in the R&D sector.
Gross operating surplus
Capital expenditure is the third and final component of intramural R&D expenditure. According to the BERD survey guidance, this includes both acquisition and lease of fixed capital goods. For simplicity, this article assumes that reported capital
expenditure only includes purchases or long-term financial leases, with rental
payments included in the other current expenditure figure. The BERD survey collects more detailed information on two types of assets, land and buildings on one hand and plant, machinery and equipment (PME) on the other. Among the first, buildings are an asset within the production boundary and its formation is already captured in the National Accounts. This article treats the land and buildings figure as the current investment in a buildings asset strictly used for R&D activity. Expenditure on plant, machinery and equipment is broadly equivalent to the formation of the National Accounts asset which includes computers and purchased software. This expenditure should therefore not count as R&D production costs, but build assets, the use of which for R&D purposes generates economic costs to their owners.
development, mineral exploration or artistic and literary originals. Abstracting from these problems, stocks of fixed assets used for R&D for the two separate categories reported in BERD are estimated. Constant-price investments in such assets are estimated by deflating land and buildings expenditure with the buildings deflator for the business services sector (ONS series RIWW) and PME with the equipment (including computers) deflator for the R&D sector (ONS series RKZA). Stocks are calculated using the perpetual inventory model (PIM) and geometric depreciation rates of 1.5 per cent and 15 per cent respectively. Capital services for the use of both stocks are calculated using an assumed net rate return of 7 per cent nominal applied to the Hall-Jorgenson formula, which characterises an equilibrium in the rental market for assets, to infer rental rates that equal the sum of a net return plus depreciation net of capital gains (Hall and Jorgenson 1967).
Taxes less subsides on production
BERD sources do not explicitly collect information on this item but, as noted, the FM requires other current expenditure to include taxes on R&D production. The FM states that subsidies should not be netted out from gross R&D expenditure and are therefore excluded. For National Accounting purposes, it is, however, necessary to discount such subsidies in order to arrive at a gross output figure at basic prices. R&D tax credits in the UK provide incentives to companies to perform R&D, which reduce the required return on investments for companies to undertake R&D.
There has been some discussion about whether R&D tax credits, which are integrated in the corporation tax system, should be counted as production subsidies rather than tax adjustments. Because small and medium companies can claim an enhanced relief on what they spend on R&D for corporation tax purposes and claim a credit when there is no net tax liability, ONS decided to treat payable tax credits as a subsidy on production for R&D (ONS 2002). HMRC (2006) currently publishes data on claims for the various R&D tax credit schemes as a new set of National Statistics. This article adopts the ONS R&D subsidy figures in Mahajan (2006).
Estimates of output for the business sector
For this sector, gross output at basic prices is calculated as follows: Half of the R&D performed by the computer services sector is subtracted from the total R&D
expenditure performed by the business sector. Capital expenditure is also subtracted and replaced by estimates of capital services for buildings and equipment used for R&D. An estimate of intermediate consumption of R&D services equal to the estimated extramural expenditure in R&D by the R&D sector is added. Gross output at basic prices is estimated by subsidies on R&D production. Estimates of gross output at purchasers’ prices are derived by adding taxes less products on R&D services, as obtained from the SUTs.
Adjustments for non-market sectors
The earlier calculations for the business sector provide an indicative adjustment factor for the FM R&D expenditure in the government and non-profit sectors to be
producers, consistency with National Accounts methods requires imposing a nil rate of return in estimating the capital services of fixed assets used in R&D production.
Estimating total R&D supply
The FM methodology largely focuses on the identification of R&D performed in individual countries. However, a country has access to a larger scope of R&D
resources if it can acquire these services from abroad. Understanding the total level of resources is crucial in estimating how much the UK economy invests in scientific knowledge.
Imports and international trade in R&D
There are two alternative sources of information for estimating R&D imports (and exports). GERD figures on R&D performed abroad, funded by domestic UK sectors (R&D performed in the UK funded by the rest of the world), provide a possible estimate of R&D imports (exports). An alternative source is the UK Balance of Payments (BoP) (Pink Book), which provides official estimates for the UK’s international trade in services, including a separate category for R&D services’ exports and imports. These are essentially based on quarterly and annual business surveys on International Trade in Services (ITIS). Although the definitions of R&D in Frascati and ITIS sources are identical, there are conceptual and practical differences between these sources which can lead to differences in values.
For the purposes of this analysis, stronger emphasis is placed on the internal
consistency of the estimates by using the export and import figures implied by the FM R&D sources, subject to the adjustment for grants explained above. Full incorporation into the National Accounts will require the complete resolution of discrepancies between the BoP and ITIS figures and a better understanding of knowledge flows within multinational companies.
Resources
Table 5
Estimation of R&D output and resources from Frascati R&D expenditure
£ million, current prices Corporations General government NPISH All domestic sectors
Starting point: Frascati Manual intramural R&D
expenditure 12,816 2,170 5,411 20,397
less software adjustment -550 0 0 -550
equals: within scope R&D expenditure 12,267 2,170 5,411 19,848
plus adjustment for tangible fixed assets 1,316 -36 -89 1,191
equals: cost of R&D production excluding R&D IC 13,582 2,134 5,322 21,039 plus intermediate consumption (IC) of R&D in production
of R&D 72 39 2 113
equals: R&D output at producers' prices 13,655 2,173 5,325 21,152
less subsidies on production -717 0 0 -717
equals: R&D gross output at basic prices 12,938 2,173 5,325 20,435
plus taxes less subsidies on R&D services 324 0 0 324
equals: R&D gross output at purchasers’ prices 13,262 2,173 5,325 20,760
plus imports of R&D 1,421 583 0 2,004
plus intermediation margins 0 0 0 0
equals: total R&D supply 14,683 2,756 5,325 22,764
Source: Authors’ calculations on a number of ONS sources
Estimating R&D uses
Consistency with National Accounts methodology requires supply and demand for R&D to be fully balanced. Since the bridging methodology relies on a single main source, this condition is automatically imposed by equating total R&D uses to estimated total R&D supply. Uses of R&D are then apportioned to the various institutional sectors using the estimated ownership shares for each sector’s output in Table 3. The results are provided in Table 6.
Table 6
Estimates of uses of R&D services
£ million, current prices
1997 1998 1999 2000 2001 2002 2003 2004 2005 Total uses ( = total resources) 16,066 17,069 18,366 19,320 20,046 21,608 21,991 22,764 24,700
Uses by corporations 8,874 9,244 10,062 10,561 10,527 11,049 10,892 11,702 12,309
Intermediate consumption 45 57 76 77 66 96 96 72 88
Gross fixed capital formation 8,829 9,187 9,986 10,484 10,461 10,953 10,797 11,630 12,221
Uses by general government 2,707 2,726 2,762 2,922 2,512 2,543 3,228 3,440 3,474
Intermediate consumption 33 36 43 39 32 39 48 39 37
Gross fixed capital formation 2,673 2,690 2,719 2,883 2,480 2,503 3,180 3,401 3,438
Uses by NPISH 2,436 2,581 2,789 3,162 3,583 4,060 4,145 4,377 4,995
Intermediate consumption 1 2 2 3 2 3 3 2 2
Gross fixed capital formation 2,434 2,579 2,786 3,159 3,581 4,057 4,142 4,375 4,993
Uses by rest of world (exports) 2,050 2,518 2,754 2,675 3,424 3,956 3,725 3,244 3,922
Source: Authors’ calculations on a number of ONS sources
[image:17.595.88.575.489.694.2]services for purposes other than the production of R&D in the R&D sector. The residual uses within each sector are subsequently allocated to GFCF in the R&D knowledge asset. It is important to note that neither government nor NPISH undertake final consumption of R&D services in this analysis. This happens to be currently the case only for government, although NPISH are currently portrayed as final consumers of R&D services. The solution to this problem is to treat the use of R&D as
investment, with the R&D asset contributing to an activity other than R&D, for
example, health services for medical research. Further detail will be provided in future analysis.
R&D projects can extend over more than one accounting period. This implies that they should be treated as work in progress before completion. Because the knowledge arising from a research project follows continuously and can be used for other
purposes, this article ignores any gestation lag times in R&D knowledge production, therefore excluding changes in inventories (work in progress) for R&D.
The impact of R&D capitalisation on the National Accounts
In order to incorporate a new set of estimates for R&D uses and resources in the accounts, it is necessary to perform a number of adjustments to the SUTs.
In the case of R&D services, the first step is to remove current estimates of R&D supply and uses, in order to avoid double-counting. However, further adjustments are required. Treating most of R&D uses as capital formation and estimating their value from independent Frascati sources has a number of impacts on the supply and use of other goods and services in the SUTs.
Avoiding non-market output double-counting
By measuring R&D output ‘at cost’, this article adopts a very similar methodology to that generally used for valuing the output of non-market producers, particularly at current prices. If R&D output by non-market producers is fully reflected in the
Table 7
Comparison of alternative R&D output estimates, by institutional sector, 2004
£ million, current prices
Corporations
General
government NPISH
All domestic sectors
R&D FM gross expenditure 12,816 2,170 5,411 20,397
R&D gross output at basic prices (NA)1 6,587 723 723 8,032
(Estimates based on SUT total output)
R&D gross output at basic prices 12,938 2,173 5,325 20,435 (Bridging methodology: Satellite account)
Difference: experimental satellite less NA 6,351 1,450 4,602 12,403
Difference: experimental satellite less FM 122 3 -86 38
Note:
1 Imputed on basis of R&D employment shares.
Source: ONS and authors’ calculations on a number of ONS sources.
Levels of R&D performed (FM definition) and produced by sector (as estimated above) are reported against those estimated in BB06. Since the split of R&D output in the National Accounts is not available by institutional sector, indicative values are estimated by apportioning the reported total, using R&D employment shares from the IDBR establishment data. These suggest that NPISH and general government
accounted each for about 9 per cent of total R&D establishment employment. These shares are used to estimate the share of National Accounts R&D output that would theoretically correspond to each sector. The results for the business sector are as expected, with R&D basically doubling, which is consistent with the estimate from MA14 that about half of business intramural R&D expenditure is financed out of own funds. However, the results also suggest that R&D output in the government and NPISH sectors is substantially underestimated. Since the valuation methodologies for overall output should be near identical, the only plausible explanation is that
government and NPISH output estimates for other goods and services include part of the costs allocated to R&D in the FM methodology. This implies that a negative adjustment should be made to the output of other products and services and, indirectly, to their associated uses, including final consumption.
Consumption of capital services of the new asset by non-market producers
While the above suggests that capitalisation of R&D implies no contribution to the revised GDP estimate from non-market producers of R&D, because of the identical basis for measurement ‘at cost’, an additional adjustment needs to be made to account for additional production in these sectors. The rationale for the upward adjustment stems from the fact that by introducing a new intangible asset in the system, the ‘at cost’ output of these institutions needs to recognise the cost of consuming part of that new asset. This adjustment is not required for market producers because the
R&D knowledge stocks and services
The special treatment of consumption of R&D knowledge by non-market producers requires the upfront estimation of R&D knowledge stocks and their depreciation. This will also turn out to be useful in estimating the impact of knowledge accumulation on productivity growth, as discussed further below. There are three main steps required to estimate the services form the new R&D asset.
Deflation of R&D investment
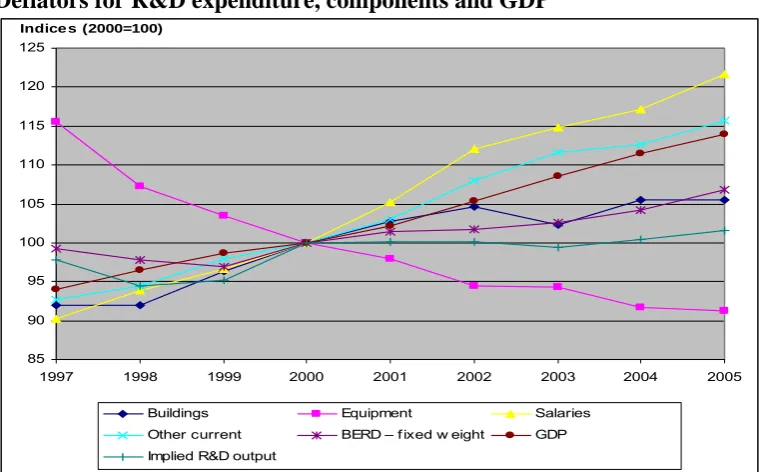
[image:20.595.93.476.300.536.2]In order to produce constant price series for R&D investment by sectors, it is necessary to calculate an appropriate R&D deflator. The deflators for various subcomponents of R&D expenditure were discussed in an earlier section and the results are summarised in Figure 1.
Figure 1
Deflators for R&D expenditure, components and GDP
85 90 95 100 105 110 115 120 125
1997 1998 1999 2000 2001 2002 2003 2004 2005
Buildings Equipment Salaries
Other current BERD – f ixed w eight GDP Implied R&D output
Indice s (2000=100)
Source: Authors’ calculations on a number of ONS sources
The profile for R&D wages and salaries shows that labour is the most inflationary R&D input, while equipment prices exhibit negative growth, probably reflecting reductions in the cost of computers which are predominantly used for R&D. A steeper profile for the GDP deflator suggests that if the ratio of nominal BERD to GDP stays constant, its constant price equivalent should be increasing. This phenomenon is more accentuated if we look at the behaviour of the implied deflator for R&D output, which is broadly flat over the period. This Paasche chain-linked price deflator for R&D is calculated using estimated rentals of fixed assets instead of payments for new fixed assets. It is referred to as an implied deflator because it is derived from and consistent with a chain-linked Laspeyres volume index for R&D output. This article uses this deflator to estimate R&D output and investment volumes.
appears to be mixed. In future work, deflation and productivity adjustments would have to be made at a lower level of aggregation, in order to reflect differences in R&D performance across activity sectors in terms of technology, but also market structure. It is plausible that some of the productivity gains could be captured by the R&D workforce, and R&D employers may agree to pay higher wages to retain their control over the knowledge asset.
Compilation of R&D (scientific originals) stocks
Based on constant price series for R&D GFCF, a PIM model with a geometric depreciation rate is used to estimate R&D stocks at the end of each period. This is considered to be a reasonable approximation to the behaviour of the aggregate stock which would certainly exhibit a much more stochastic behaviour at the level of individual ‘pieces’ of knowledge. Following completion of an R&D project, many individual companies write off a projects’ costs if it has not been ‘successful’, while a successful outcome could in principle lead to the revaluation of the knowledge asset to a much higher level, reflecting the commercial value of the intellectual property. It is of course a subject for future investigation to test whether an aggregate geometric depreciation rate is a reasonable approximation to the knowledge asset value
dynamics. Future revisions will also allow for ‘in-year’ depreciation, as opposed to assuming instant depreciation at the end of each accounting period.
Implementing a PIM estimation of R&D stocks requires a number of assumptions about the depreciation of the stocks. This article applies a depreciation rate of 20 per cent is used for the business sector’s R&D stock, which is consistent with a ten-year service life under a double-declining balance rate. This assumption fits with the upper bound of the estimates by Baruch and Sougiannis (1999) and Ballester et al (2004), and close to the 24 per cent depreciation rate estimated by Schankerman and Pakes (1986), based on patent renewal methods applied to the UK. However, a 5 per cent geometric depreciation rate, close to that of buildings, is adopted for assets owned by the government and NPISH sectors on the basis that it is likely to depreciate more slowly than knowledge owned by individual companies. This is due to systematic differences in the type of knowledge produced by non-market producers, which tends to be general as opposed to focused on specific applications. Furthermore, the use of a lower depreciation rate also contributes – in steady state – to a more conservative estimate of the contribution of R&D to non-market output.
The levels of R&D net stocks for corporate, government and NPISH sectors grow over the estimation period 1997-2004 at an average rate of 3, 1 and 7 per cent, respectively. Business and government stocks start from very similar levels, approximately £40 billion, while NPISH starts at about £35 billion in 2003 prices. Because of the acute differences in growth rates, the NPISH stock catches up and overtakes the government R&D stock.
Calculation of R&D capital services
consists of a return to capital (an opportunity cost), depreciation and a deduction for expected real holding gains. For R&D assets owned by non-market producers, consistency of treatment with other assets requires reflecting their consumption as part of non-market output, gross operating surplus (through capital consumption) and final use as final government or NPISH consumption. Because National Accounts assume a nil net operating surplus for non-market producers, capital services for these sectors are estimated to comprise only depreciation.
Summary of impacts on the ‘goods and services account’
The analyses above have provided all the necessary building blocks to evaluate the joint impact of R&D capitalisation and using FM sources to estimate R&D resources and uses. The ‘goods and services account’ provides the basic framework on which to evaluate the new treatment of R&D as it balances total resources, from output and imports, against all possible uses. A summary of the impacts for the 2004 reference year is provided in Table 8. On the resource side, the bridging approach leads to an increase in R&D gross output above £12 billion. Because some of that increase is due to the reallocation of output from other goods and services (OGS) to R&D for non-market producers, a deduction of about £9 billion is imputed for the government and NPISH sectors. A net increase in the output of OGS follows from the inclusion of the consumption of £4 billion of R&D capital services by these sectors. Finally, a small deduction applies to imports reflecting the use of an FM-derived measure as opposed to the BoP figure in the National Accounts.
The impact on demand is split over a wider number of categories. The adjustments to avoid double-counting of non-market output are reflected in reductions in
intermediate consumption of OGS and final consumption of government and NPISH, marked as double-counting adjustments. Capitalisation raises R&D investment from zero to close to £20 billion, reflecting cuts to R&D intermediate consumption, identification of own-account R&D output and reductions to final consumption of non-market sectors. Adjustments are also made to eliminate work in progress for R&D in the National Accounts and to record exports from FM sources as opposed to BoP data. By construction, these adjustments not only balance total supply and demand, but also uses and resources by product. To estimate the adjustments to OGS on the supply and use sides, this article imposes the constraint that non-market GVA only increases by the value of R&D capital consumption in the government and NPISH sectors. Further analysis will be required to allow for market output by non-market producers.
Impacts on key economic indicators
Table 8
Summary of impacts on the goods and services account, 2004
£ million, current prices
Resources Uses
R&D output 12,403 R&D intermediate consumption -5,274
Output of other goods and services (OGS) (double
counting) -9,089 Intermediate consumption OGS (double counting) -1,363
Output of OGS from non-market consumption of R&D
capital services 4,216 R&D gross fixed capital formation 19,407
R&D imports (adjustment from BoP to FM sources) 197 Gross fixed capital formation (other assets) 0 Changes in inventories (elimination of work in progress) 12 Final consumption of R&D by NPISH (elimination) -325 Final consumption of OGS by NPISH (double counting) -5,084 Final consumption of services from R&D capital by
NPISH 1,776
Government final consumption of OGS (double counting) -2,641 Final consumption of services from R&D capital by
government 2,440 R&D exports (adjustment from BoP to FM sources) -1,219
Total supply of R&D 12,600 Total demand of R&D 12,600
Total supply of OGS -4,873 Total demand of OGS -4,873
Total supply 7,727 Total demand 7,727
Table 9
Summary of impacts on current price GDP and NDP
£ million, current prices
Gross domestic product (GDP) Net domestic product (NDP)
Blue Book 2006
Satellite account (market
only) Percentage change
Satellite account (all
sectors) Percentage change
Blue Book 2006
Satellite account (market
only) Percentage change
Satellite account (all
sectors) Percentage change
1997 811,194 820,472 1.144 823,758 1.549 719,259 720,511 0.174 720,511 0.174
1998 860,796 870,110 1.082 873,368 1.461 765,745 767,161 0.185 767,161 0.185
1999 906,567 916,233 1.066 919,620 1.440 805,512 806,954 0.179 806,954 0.179
2000 953,227 963,456 1.073 967,125 1.458 846,855 848,074 0.144 848,074 0.144
2001 996,987 1,007,165 1.021 1,010,958 1.401 886,553 887,414 0.097 887,414 0.097
2002 1,048,767 1,059,404 1.014 1,063,311 1.387 932,760 933,850 0.117 933,850 0.117
2003 1,110,296 1,120,428 0.913 1,124,437 1.274 991,057 991,436 0.038 991,436 0.038
2004 1,176,527 1,186,479 0.846 1,190,695 1.204 1,048,100 1,047,990 -0.010 1,047,990 -0.010
Table 9 shows that the overall impact on the current level of GDP ranges from 1.5 to 1.2 per cent, with a slight negative trend over the period. The market sector is
responsible for almost two thirds of the overall impact, ranging between 0.8 and 1.1 per cent of GDP. Another economic indicator of interest is the net domestic product (NDP) which equals GDP less consumption of fixed capital. Because business-owned R&D knowledge is a relatively fast-depreciating asset, the impact on NDP is quite small and, in 2004, even negative. Although it may be of concern that R&D has limited direct impact on nominal NDP, which if expressed in real consumption terms is an indicator of the sustainability of consumption opportunities, it should also be noticed that this analysis does not capture the impact of R&D spillovers on such opportunities.
R&D intensity indicators
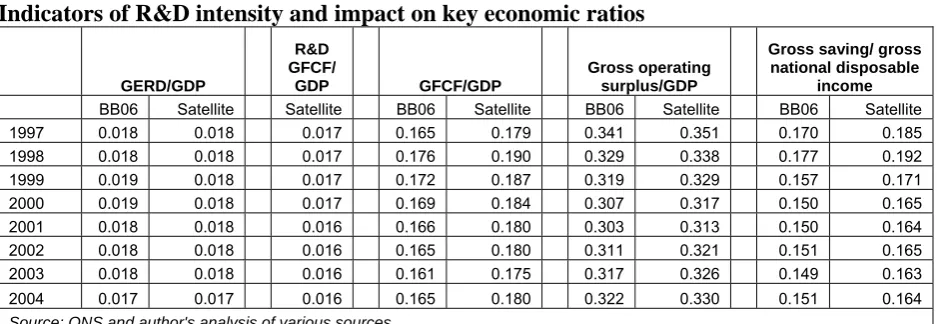
[image:25.595.91.560.390.552.2]Many users will also find of interest to see how the R&D capitalisation methodology impacts on the headline R&D intensity indicator. The results are provided in Table 10. The headline GERD to GDP ratio is only affected by changes to the denominator, but the impact is barely noticeable. The new methodology enables the estimation of new R&D indicators that can help provide new insights on the R&D intensity of the UK economy, one of which is a genuine R&D investment share, defined as the proportion of GDP that goes to R&D GFCF.
Table 10
Indicators of R&D intensity and impact on key economic ratios
GERD/GDP R&D GFCF/
GDP GFCF/GDP
Gross operating surplus/GDP
Gross saving/ gross national disposable
income
BB06 Satellite Satellite BB06 Satellite BB06 Satellite BB06 Satellite
1997 0.018 0.018 0.017 0.165 0.179 0.341 0.351 0.170 0.185
1998 0.018 0.018 0.017 0.176 0.190 0.329 0.338 0.177 0.192
1999 0.019 0.018 0.017 0.172 0.187 0.319 0.329 0.157 0.171
2000 0.019 0.018 0.017 0.169 0.184 0.307 0.317 0.150 0.165
2001 0.018 0.018 0.016 0.166 0.180 0.303 0.313 0.150 0.164
2002 0.018 0.018 0.016 0.165 0.180 0.311 0.321 0.151 0.165
2003 0.018 0.018 0.016 0.161 0.175 0.317 0.326 0.149 0.163
2004 0.017 0.017 0.016 0.165 0.180 0.322 0.330 0.151 0.164 Source: ONS and author's analysis of various sources
Table 10 also documents a significant revision to the investment intensity of the UK economy. The share of GFCF over GDP increases by approximately 1.5 percentage points, as R&D now counts for about 9 per cent of total gross investment. This is also reflected in an increase in value of a profit indicator, namely the share of operating surplus (here including mixed income) relative to GDP and the share of gross savings relative to national disposable income. The impact on both magnitudes is positive at around 1 to 2 percentage points. Capitalisation of R&D expenditure increases relative profits, investment and savings.
Volume GDP growth and impacts on productivity growth
index (series YBEU) and the estimated adjustment volume index, using their
respective nominal shares in the lagged ‘new’ current price GDP as weights. Annual volume GDP growth is only revised from an average of 2.93 per cent over 1997 to 2004 in Blue Book 2006 to 2.91 per cent, while money-GDP growth is revised from 5.46 to 5.41 per cent.
Growth accounting
A final question of interest is how much R&D accumulation has contributed to productivity growth. Growth accounting is a technique designed to attribute changes in the volume of GDP to changes in the volume of various inputs. A weighted index of inputs can be derived to estimate a measure of multi-factor productivity growth, based on the assumption that the contributions of each input are proportional to their share in national income. Although this relies on strong assumptions about the competitive nature of the economy and its production opportunities, it is a powerful tool for analysis (ONS, 2007). Failure to control for particular inputs can imply that the growth rate of output steers away from the aggregate growth of inputs and is counted as residual productivity growth. Thus the question is how much capitalising R&D, as set out in the SNA revision, can help reduce this gap.
Additional analysis on this issue has drawn on data reported by Goodridge (2007), also based on Blue Book 2006. Over the period, constant price GVA (excluding dwellings) grows at an average rate of 2.8 per cent. Accumulation of other capital assets accounts for 1.4 per cent and quality-adjusted labour for 0.8 per cent. R&D accumulation only contributes 0.05 per cent to observed GVA growth, which is mostly the result of a particularly low income share of less than 1 per cent and an average growth of 2 per cent. Thus, the contribution of R&D accumulation to growth is minimal over this period. This result should be interpreted with caution, as the growth accounting exercise only considers the direct contribution from ‘owned’ R&D knowledge. To the extent that economic performance also depends on the stock of freely available knowledge, the growth accounting exercise can lead to an
underestimation of the real contribution of scientific knowledge to growth.
Part II: Sensitivity Analysis
In this second section we present the result of sensitivity analysis on the goods and services account (GSA), gross domestic product (GDP) and net domestic product (NDP) estimates, R&D intensity indicators, other key economic ratios and our growth accounting results. The focus of the analysis is the key assumptions made with respect to depreciation rates for R&D and fixed assets, the inclusion of software estimates, and the funding and ownership assumptions regarding R&D across various sectors. The sensitivity analysis is carried out holding all other variables at their values in the benchmark analysis given in Part I, unless otherwise stated.
The Key Assumptions
Depreciation Rates
a. R&D Stocks
Using a constant price series for R&D gross fixed capital formation, end-of-period R&D stocks were calculated using the perpetual inventory model (PIM). In our original benchmark analysis discussed above, a depreciation rate of 20% was applied to the business sector’s R&D stock, while a 5% rate was applied to the government and NPISH sectors.In the empirical literature, it has been estimated that R&D capital depreciates at 2 to 7 times the rate of physical capital, with estimates ranging from 10 to 25% depending on the sector considered (Edworthy and Wallis, 2007).
[image:27.595.88.514.378.512.2]A comparison of depreciation rates used in international R&D satellite accounts is given in Table 11.5 On the basis of these rates and estimates in the literature, we consider three scenarios for the business sector: 10%, 20% (original) and 25%, and three scenarios for the government and NPISH sectors: 5% (original), 10% and 15%.6 It is assumed that the same depreciation rate always applies in the government and NPISH sectors.
Table 11 – Comparison of service lives and depreciation rates in international R&D satellite accounts
Country Av. Service life (years) Annual depreciation rate
Comments
Australia 5, 10 and 20 NA 3 scenarios
Canada NA 5%, 10% and 15% 3 scenarios
Israel NA 15% None
Netherlands 9.5 to 15.5 NA Vary across industry
groups
UK NA 20% (Business)
5% (Gov and NPISH)
None
US NA 11-18% (Business)
15% (Gov and NPISH)
Vary across 4 industry groups
Source: OECD (2008)
b. Fixed Assets Stocks
In our benchmark analysis, stocks of fixed assets used for R&D for the two separate categories in the BERD survey (land and buildings and plant, machinery and
equipment) depreciate geometrically according to the PIM, with capital services for the use of both stocks calculated assuming a net rate of return (ROR) of 7%. A 1.5% depreciation rate was applied to land and buildings, and 15% for machinery and equipment.
These rates are broadly consistent with the finding that physical capital depreciates more slowly than R&D capital, though the latter is well above the R&D depreciation
5
Table 17 is based on “Methods for obtaining R&D service lives”, prepared for the OECD Task Force on R&D and other Intellectual Property Products, April 24-25 2008.
6
rate in the government and NPISH sectors and only slightly below the business sector’s R&D capital depreciation rate of 20%. In this analysis we consider three scenarios: 1.5% (original), 3% and 6% for land and buildings, and 5%, 10% and 15% (original) for plant, machinery and equipment. We do not consider a 20% scenario for plant, machinery and equipment, though quantitatively the effect is the same as for the reduction to 10% with the proviso that the direction of change is reversed. The net ROR of 7% is applied in each case.
Software Estimates
To avoid double counting of software, which is currently recognised as a produced asset in the National Accounts (NA), and scientific originals (R&D) which are not, 50% of total R&D in the computer services industry was deducted in the benchmark analysis (it is assumed this proportion is already correctly accounted for in software estimates). In addition, we consider 60 and 40% deductions.
Performance, Funding and Ownership of R&D
In the benchmark analysis a number of assumptions are made about the share of each sector’s R&D that is funded and owned by another sector (see Table 3 above). We also investigate the sensitivity to changes in some of these assumed shares, again using three scenarios. The assumptions used in the sensitivity analysis are presented in Table 12, with the original assumptions highlighted in bold font.
Table 12 – Funding ownership assumptions considered in the sensitivity analysis
Share of sector i's R&D funded by sector j that is owned by sector j
Funder (i)
Business Enterprise
General
Government NPISH Rest of the world
Performer (j) Business
Enterprise 1 0.4 0.5 0.6 1 0.85 0.9 0.95
General
Government 1 1 1 0.85 0.9 0.95
NPISH 1 0.05 0.1 0.15 1 0.85 0.9 0.95
Rest of the
Results:
Impacts on the Goods and Services Account (GSA)
The GSA balances total resources, from output and imports, against possible uses. Like the analysis of Part I, we concentrate on the impacts of capitalisation of R&D, so the figures reflect the changes relative to NA values for the 2004 reference year. We consider the sensitivity with regard to depreciation rates first.
Depreciation Rates
a. NPISH and Government R&D Capital
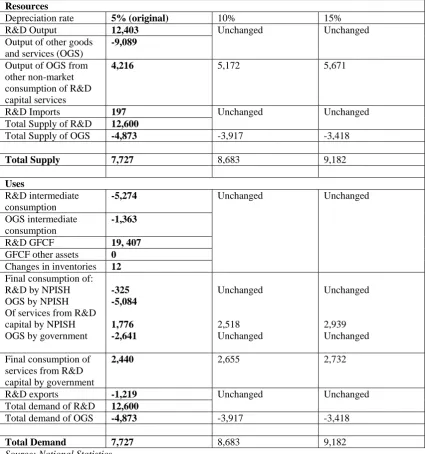
The changes, which are documented in Table 13, are non-trivial. The impact on total demand rises by approximately 12.4% if the depreciation rate is increased from the original 5% value to 10%. However, this does result solely from an increase in final consumption of R&D services from capital by government, which experiences a significant increase of almost 42%. Interestingly, increasing the depreciation rate from 10% to 15% increases total demand through the same channel, but the effect is less marked; the total demand impact stands at 18.8% above the original value. Thus while total demand shows significant sensitivity to an increase in the assumed depreciation rate from 5% to 10%, a further increase to 15% has less effect.
b. Business R&D Capital
Changing the business R&D capital depreciation rate has no effect on the GSA. This result follows from the elimination of the channel discussed above via the imposed constraint, used to estimate adjustments to OGS on the supply and use sides, that non-market gross value added (GVA) increases only by the value of R&D capital
consumption in the government and NPISH sectors.
c. Land and Buildings
Changing the depreciation rate leads to changes in almost all the components of total demand, but the overall impact is small. Increasing the rate from the original value of 1.5% to 3% reduces total demand by 1.7%, resulting mainly from a reduction in the capitalisation of R&D investment from £19,407m to £19,152m. For a small change in the depreciation rate this is certainly non-trivial, but increasing the rate further to 6% actually lessens the impact on total demand. This is the result of a smaller
proportionate reduction in R&D investment, which is balanced by increases in final consumption of R&D services from capital by government and NPISH (see Table 14).
d. Plant and Machinery
Table 13–Sensitivity of GSA impacts to NPISH and government R&D capital depreciation rates, 2004 (£m, current prices)
Resources
Depreciation rate 5% (original) 10% 15%
R&D Output 12,403 Output of other goods
and services (OGS)
-9,089
Unchanged Unchanged
Output of OGS from other non-market consumption of R&D capital services
4,216 5,172 5,671
R&D Imports 197 Total Supply of R&D 12,600
Unchanged Unchanged
Total Supply of OGS -4,873 -3,917 -3,418
Total Supply 7,727 8,683 9,182
Uses R&D intermediate consumption -5,274 OGS intermediate consumption -1,363
R&D GFCF 19, 407 GFCF other assets 0 Changes in inventories 12
Unchanged Unchanged
Final consumption of: R&D by NPISH OGS by NPISH Of services from R&D capital by NPISH OGS by government
-325 -5,084 1,776 -2,641 Unchanged 2,518 Unchanged Unchanged 2,939 Unchanged
Final consumption of services from R&D capital by government
2,440 2,655 2,732
R&D exports -1,219 Total demand of R&D 12,600
Unchanged Unchanged
Total demand of OGS -4,873 -3,917 -3,418
Total Demand 7,727 8,683 9,182