Matrix-assisted ionisation in vacuum mass spectrometry
and imaging on a modified
quadrupole-quadrupole-time-of-flight mass spectrometer
HARDING, AJ, HOUGH, J, CURTIS, C, KINSMAN, D and CLENCH, Malcolm
<http://orcid.org/0000-0002-0798-831X>
Available from Sheffield Hallam University Research Archive (SHURA) at:
http://shura.shu.ac.uk/25092/
This document is the author deposited version. You are advised to consult the
publisher's version if you wish to cite from it.
Published version
HARDING, AJ, HOUGH, J, CURTIS, C, KINSMAN, D and CLENCH, Malcolm (2019).
Matrix-assisted ionisation in vacuum mass spectrometry and imaging on a modified
quadrupole-quadrupole-time-of-flight mass spectrometer. Journal of Spectral
Imaging, 8, a12.
Copyright and re-use policy
See
http://shura.shu.ac.uk/information.html
Sheffield Hallam University Research Archive
Correspondence
M.R. Clench ([email protected])
Received: 8 December 2017
Revised: 2 July 2019
Accepted: 9 July 2019 Publication: 15 July 2019
doi: 10.1255/jsi.2019.a12
ISSN: 2040-4565
Citation
A.J. Harding, J. Hough, C. Curtis, D. Kinsman and M.R. Clench, “Matrix-assisted ionisation in vacuum mass spectrometry and imaging on a modi
-fied quadrupole-quadrupole-time-of-flight mass spectrometer”, J. Spectral Imaging 8, a12 (2019). https://doi.org/10.1255/jsi.2019.a12
© 2019 The Authors
This licence permits you to use, share, copy and redistribute the paper in any medium or any format provided that a full citation to the original paper in this journal is given.
In thIs Issue:
spectral preprocessing to compensate for packaging film / using neural nets to invert the PROSAIL canopy model
JOURNAL OF
SPECTRAL
IMAGING
Peer Reviewed Paper openaccessMatrix-assisted ionisation in vacuum mass
spectrometry and imaging on a modified
quadrupole-quadrupole-time-of-flight mass
spectrometer
Alex James Harding,a James Hough,a Charlotte Curtis,a Daniel Kinsmana and Malcolm R. Clenchb,*
aCentre for Mass Spectrometry Imaging, Biomolecular Sciences Research Centre, Sheffield Hallam University, Howard Street, Sheffield S1 1WB,
UK
bCentre for Mass Spectrometry Imaging, Biomolecular Sciences Research Centre, Sheffield Hallam University, Howard Street, Sheffield S1 1WB,
UK. E-mail: [email protected], https://orcid.org/0000-0002-0798-831X
Matrix-Assisted Ionisation in Vacuum (MAIV) is a new ionisation technique which ionises non-volatile compounds producing electrospray ioni -sation-like spectra. Its simple, matrix-assisted laser desorption/ioni-sation-like sample preparation allows for rapid analysis, with no requirement for external energy in the form of a laser or high voltage to produce ions. Ionisation occurs when the matrix (often 3-nitrobenzonitrile) is exposed to sub-ambient pressure. Here, the first use of this revolutionary new ionisation technique to image biological samples is reported. A commercial quadrupole-quadrupole-time-of-flight mass spectrometer was modified to incorporate control of the ion source pressure and a reduced sampling cone orifice diameter. In initial experiments, optimisation of source pressure and matrix composition was carried out to increase the longevity of ion formation. It was noted during these experiments that ion production was only observed when the sample was directly under the sampling cone. Optimisation of sample extraction into the MAIV matrix by the addition of 5 % chloroform enabled MAIV mass spectrometry imaging of lipids in rat brain sections to be carried out in raster imaging mode. Modification of the size and position of the sampling cone improved the selec -tivity obtainable in these images. Although the quality of these initial images is relatively poor, work is underway to improve the spatial resolution by further modification of the ion source and progress is reported.
Introduction
Over the last ten years there have been many advances in ambient ionisation techniques. One new technique announced by the group of Professor Sarah Trimpin in 2012 is matrix-assisted ionisation in vacuum (MAIV).1 Trimpin and co-workers observed that as 3-nitrobenzoni
-trile (3-NBN), a solid-state crystal matrix, sublimed under an intermediate vacuum and at ambient temperature, gas-phase analyte ions were observed. Mass spectra recorded
under these conditions contained multiply charged ions and were strikingly similar to those produced by electro -spray ionisation (ESI).
2 MAIV Mass Spectrometry and Imaging on a Modified QqTOF Mass Spectrometer
which light is emitted. This is observed when the crystal structure of 3-NBN fractures.2 In this explanation of the ionisation mechanism of MAIV, the formation of ions is explained by the generation of charge when the matrix crystals fracture. The fracturing of two oppositely charged surfaces within the matrix is believed to cause both the triboluminescence and the formation of analyte ions. The fracturing is explained by the expanding solvent within the crystals, or by sublimation at sub-ambient pressure. Both of these phenomena would lead to the fracturing of the matrix causing charge separation and production of gas-phase analyte ions.3 Further research
by the Trimpin group found several other compounds that were capable of acting as a matrix for MAIV in a similar manner, although 3-NBN was still the matrix of choice due to its ability to generate analyte ions from a variety of compounds.4
MAIV has subsequently been used to record mass spectra from a wide range of compounds, including large proteins, synthetic polymers, additives and small molecules. One of the biggest advantages of MAIV is the generation of multiply charged ions from peptides and proteins. This is of interest in tissue imaging and profiling experiments, due to the difficulties in obtaining good quality product-ion spectra containing sufficient sequence information to allow protein identification in “on-tissue digest” matrix-assisted laser desorption/ionisa
-tion (MALDI) experiments.5
During experiments to optimise MAIV conditions on an Applied Biosystems QStar XL mass spectrometer, it was noted that ions were only produced in the inter -mediate vacuum MALDI source when the sample was placed directly under the instrument sampling cone. This seemed counter intuitive as it was expected that subli -mation of matrix and hence ionisation would be occur -ring at all times that the sample was in the intermediate vacuum region. The observation suggested, however, that if ions were only being sampled from one defined position, it should be possible to acquire images from sample surfaces using MAIV. In order to achieve this the sample surface would need to be coated with the MAIV matrix and moved under the sampling cone. Here, in order to achieve a sufficiently slow rate of sublimation to allow images to be recorded the instrument has been modified to allow control of the source pressure during pump down. The size of the orifice in the sampling cone has also been reduced and its position in relation to the sample surface adjusted. The optimisation of MAIV ioni
-sation on the modified instrument is reported along with data showing its use for low spatial resolution imaging. These are believed to be the first data showing the acqui
-sition of MAIV images.
Experimental
Materials
Unless stated otherwise all chemicals and matrices were purchased from Sigma-Aldrich Company Ltd (Dorset, UK).
Instrumentation
The initial MAIV experiments were conducted on an Applied Biosystems/MDS Sciex QStar Pulsar I mass spec -trometer (Applied Biosystems, Concord, Ontario, Canada) fitted with an Applied Biosystems/MDS Sciex oMALDI 2 source. Subsequent experiments were carried out an Applied Biosystems/MDS Sciex QStar XL mass spec -trometer also fitted with an Applied Biosystems/MDS Sciex Source. In order to allow control of the interme -diate pressure region inside the oMALDI 2 source during pump down this instrument was modified by incorpo -rating a “SpeediVac” valve (Edwards, Crawley, UK) along with vacuum “T-piece” fitted with a Leybold Pirani gauge attached to an Edwards Combivac CM31 digital vacuum meter into the source roughing line.
Sample preparation for initial experiments
and matrix optimisation
The matrix 3-nitrobenzonitrile (3-NBN) was prepared by dissolving 250 mg of 3-NBN in 5 mL 100 % acetoni -trile with 0.1 % formic acid. Solutions of angiotensin II (12.5 pmol µL–1) and lysozyme (12.5 pmol µL–1) were prepared in 100 % water.
Initially samples were prepared using a similar protocol to that reported by Trimpin and Inutan:1 0.2 µL of the analyte solution was spotted onto the MALDI plate then 0.2 µL of the matrix was spotted on top and left to air dry, usually taking between 5 s and 10 s.
The volume of matrix : analyte was optimised; by increasing the volume of matrix and analyte solutions by 0.1 µL up to 0.6 µL of each (total volume spotted 1.2 µL). The optimal volume was determined by measuring ion
and 1 : 4 ion abundance for the base peak, time to fully sublime and overall ion count were evaluated in each measurement.
Optimisation of source pressure
The source pump down pressure was optimised by anal -ysis of spots of optimised angiotensin II matrix prepa -ration (0.5 µL angiotensin II 12.5 pmol µL–1 spotted initially followed by 2 × 0.5 µL of 3-NBN 50 mg mL–1 100 % acetonitrile 0.1 % formic acid). The source pump
down pressure was adjusted between 1 Torr and 20 Torr. Experiments were conducted in triplicate. The intensity and duration of ion production was recorded.
Initial angiotensin II images
Initial images were recorded by spotting three aliquots of the optimised angiotensin II matrix preparation (0.5 µL angiotensin II 12.5 pmol µL–1spotted initially followed by 2 × 0.5 µL of 3-NBN 50 mg mL–1 100 % acetonitrile 0.1 % formic acid) onto a MALDI target plate at a spacing of 10 mm. The spots were of approximately 2 mm in diam-eter. Images of the three sample spots were recorded in raster imaging mode6 on the slow speed setting. Images were recorded at source pump down pressures of 1.0, 4.0, 8.0, 2 × 101, 6 × 101 and 1 × 10² Torr.
Lipid profiles from tissue: optimisation of
matrix composition
The effect of solvent composition on the profiles of lipids observed from rat brain tissue was investigated by preparing MAIV matrices containing 50 mg mL–1 3-NBN in CH3CN containing 0 %, 2 %, 5 %, 10 % and 20 % CH3Cl
(all 1 % formic acid) v/v. For lipid profiling experiments 0.5 µL of the matrix solutions were manually spotted onto the brain tissue. MAIV mass spectra were acquired in positive-ion mode over 30 s and summed for compar -ison.
Lipid imaging experiments conducted with
“normal” 4 mm sampling cone
Horizontal sections of rat brain were manually sprayed using an air bush (Iawata Custom Micron-2, The Airbrush Company, Lancing, UK) with 2.5 mL of 50 mg mL–1 3-NBN in 95 % CH3CN : 5 % CH3Cl, overall 1 % formic
acid. Samples were imaged on an Applied Biosystems QStar XL mass spectrometer in raster imaging mode at 1 mm horizontal and vertical spacing (pixel size). The “slowest” stage movement speed setting was used. Data
were recorded in positive-ion mode using Analyst QS1.1 software and converted to Analyse 7.5 format using the Applied Biosystems oMALDI server 5.1 software for viewing using “Biomap” (https://ms-imaging.org/wp/).
Imaging experiments conducted with 2 mm
sampling cone positioned 2 mm closer to the
sample target
A modified sampling cone was fabricated. The inner face of the back plate was reduced in thickness by 1 mm and the orifice in the cone was reduced in size to 2 mm and extended 1 mm from the original. The combined effects of these to changes were to create a sampling cone with a 2 mm orifice that was positioned 2 mm closer to the sample surface than the original cone with the 4 mm orifice. For initial imaging experiments, spots of 0.5 µL 3-NBN followed by angiotensin II 10 pmol in 0.5 µL water were placed on the standard Applied Biosystems oMALDI sample plate at 10 mm intervals. The spots were manually spotted to give a diameter of approximately 2 mm. Samples were imaged on an Applied Biosystems QStar XL mass spectrometer in raster imaging mode at 1 mm horizontal and vertical spacing (pixel size). The “slowest” stage movement speed setting was used. Data were recorded in positive-ion mode using Analyst QS1.1 software and converted to Analyse 7.5 format using the Applied Biosystems oMALDI server 5.1 software for viewing using “Biomap” (https://ms-imaging.org/wp/).
Horizontal sections of rat brain were manually sprayed using an air brush (Iawata Custom Micron-2, The Airbrush Company, Lancing, UK) with 2.5 mL of 50 mg mL–1 3-NBN in 95 % CH3CN : 5 % CH3Cl, overall 1 % formic
acid. Samples were imaged on an Applied Biosystems QStar XL mass spectrometer in raster imaging mode at 1.5 mm horizontal and vertical spacing (pixel size). The “slowest” stage movement speed setting was used. Data were recorded in positive-ion mode using Analyst QS1.1 software and converted to Analyse 7.5 format using the Applied Biosystems oMALDI server 5.1 software for viewing using “Biomap” (https://ms-imaging.org/wp/).
Results and discussion
Initial profile data from unmodified
instrument
4 MAIV Mass Spectrometry and Imaging on a Modified QqTOF Mass Spectrometer
was found that the “normal” intermediate vacuum of the QStar instrument’s o-MALDI2 source was suitable for MAIV experiments. As can be seen, typical “electrospray-like” MAIV spectra were obtained. The MAIV mass spec -trum of angiotensin II (Figure 1) shows both the doubly charged [M + 2H]2+ ion at m/z 523.831 along with the
singly charged [M + H]+ ion at m/z 1046.670. One of the
[image:5.595.41.286.96.292.2] [image:5.595.103.485.385.696.2]major advantages of the use of MAIV that it is intended to exploit in this work is the generation of multiply charged ions from peptides that arise from trypsin digest. Figure 2 shows the results of the MAIV-MS analysis of an in-solution trypsin digest of horse heart cytochrome C (a) and MS/MS data from the doubly charged precursor ion of peptide T29-39 TGPNLHGLFGR m/z 584.8 (b). Whilst the sample could be identified from the peptide mass fingerprint by MASCOT search, it is also identified as the only significant hit by MASCOT search of the data from the product-ion spectrum (c). This is important when consideration is given to the difficulties encountered in identifying proteins from product-ion data obtained by
Figure 1. MAIV mass spectrum of angiotensin II (5 pmol). Data obtained but initial spotting of 0.5 µL of 3-NBN (50 mg mL–1 CH
3CN 1.0 % formic acid) followed by
0.5 µL of angiotensin II 10 µmol–1. [M + H]+m/z1046.6,
[M + 2H]2+m/z523.8 along with many fragment ions are
clearly observable.
MALDI and with further improvements in sensitivity of the interface could be useful when used with “on-tissue” digests.
Optimisation of source pump down pressure
Using the modified instrument, the source pump down pressure was optimised by recording both the intensity and duration of signals for spots of angiotensin II held under the sampling cone as the pressure was varied from 1 Torr to 20 Torr. It was found that at source pump down pressures of 8–18 Torr, the sample gave good signal intensity, with a maximum duration of signal of around 7 min (Figure 3 a and b).Initial imaging experiments
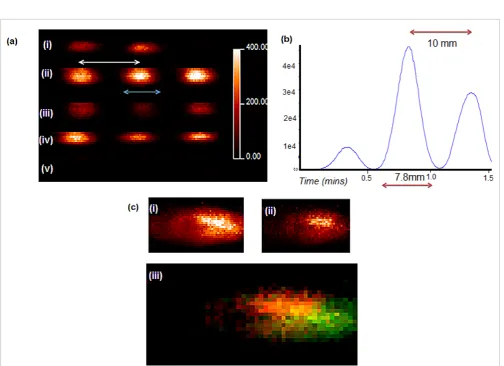
The data from the initial imaging experiments carried out on spots of 10.0 pmol angiotensin II at a range of source pressures are shown in Figure 4 (a). As can be seen, some spatial information is retained in these data. The angiotensin II spots had a horizontal spacing of 10 mm and each spot an approximate diameter of 2 mm. Extracting the linescan information across the centre of one row of spots (Figure 4b) using the centre of spot to centre of spot distance to give the 10 mm scale the spots have an apparent width of 7.8 mm, suggesting a sampling area of 7.8 mm diameter. Importantly in these images it can be seen that the data are clearly obtained from discrete regions. This would indicate that whilst ions are sampled for a period before the sample is directly under the hole in the sampling cone and are obtained for a period after it has passed through it, with this ion source geometry they are clearly not sampled continuously. A possible explanation of this difference to the initial work of Trimpin et al.1 arises from the different way in which the ion source “curtain gas” is delivered in the Applied Biosystems QStar instrument used here, compared to the Waters Synapt instrument used in the initial work. In the Waters intermediate pressure ion MALDI source, the curtain gas is delivered from behind the sample plate whereas in the Applied Biosystems oMALDI 2 intermediate pressure ion source the curtain gas is delivered in between a curtain plate and the sampling orifice cone. Curtain gas will clearly be coming out of the hole in the curtain gas plate onto the sample surface and aiding declustering of MAIV clusters but also possibly deflecting desorbed particles from the edges of the area impacted away from the sampling orifice cone.
Imaging lipid distribution in rat brain with the
4 mm sampling cone
Imaging the distribution of species in rat brain is a common test for mass spectrometry imaging (MSI) of biological tissue.6 In the initial tissue profiling experi -ments carried out, it was found that the signal intensity observed for MAIV-MS of lipids in rat brain sections was very low when a conventional MAIV matrix of 3-MBN in acetonitrile/formic acid was used. It was thought that this matrix was not efficiently extracting lipids from the rat brain tissue. In order to improve the extraction efficiency, matrix solutions containing chloroform were prepared. The use of a 5 % chloroform-containing matrix resulted in
a three-fold improvement in sensitivity (data not shown). Using previous work to make putative assignments6 the most abundant phosphatidyl choline (PC) molecular species observable in the positive-ion MAIV spectra were PC 16 : 0/16 : 0 ([M + H]+ m/z 734.4) and PC 16 : 0/18 : 1
([M + H]+ m/z 760.5). An interesting observation in these
data is the absence of the corresponding sodium/potas -sium alkali metal adduct ions, e.g. m/z 756.5 the [M + Na]+
ion for PC 16 : 0/16 : 0. These are commonly observed in MALDI-MSI or desorption electrospray-MSI experiments, lead to spectral complexity and are often misassigned. Evaluation of data from the incorporation of chloroform into the MAIV matrix for profiling experiments led to the matrix containing 5 % chloroform being selected for the brain imaging experiments.
Selected data from MAIV-MSI of lipids in rat brain horizontal section are shown in Figure 4c. These data have been normalised to the ion arising from 3-NBN at m/z 131. The region that appeared to generate the most intense lipid ions was the cerebellum region of the brain.
Imaging experiments conducted with the
2 mm sampling cone positioned 2 mm closer
to the sample surface
6 MAIV Mass Spectrometry and Imaging on a Modified QqTOF Mass Spectrometer
[image:7.595.42.547.317.683.2]Figure 4. MAIV-MS images recorded using the 4 mm sampling cone with modified pumping regime. (a) Images of 3 × 2 mm diameter spots of 10 pmol angiotensin II spaced 10 mm apart recorded at source pressures of 1.0, 4.0, 8.0, 2 × 101, 6 × 101 and 1 × 10² Torr. (b) Extracted “linescan” profile of signal intensity taken across row (b) taking the peak to peak distance as being equivalent to 10 mm gives an apparent diameter of the spots, i.e. sampling area of 7.8 mm diameter. (c) Initial images of a horizontal section of rat brain acquired on the instrument with the 4 mm sampling cone (i) m/z 760.5, (ii)m/z 734.4 and (iii) an overlay of these two images.
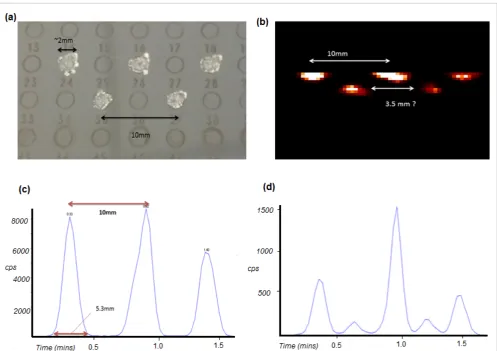
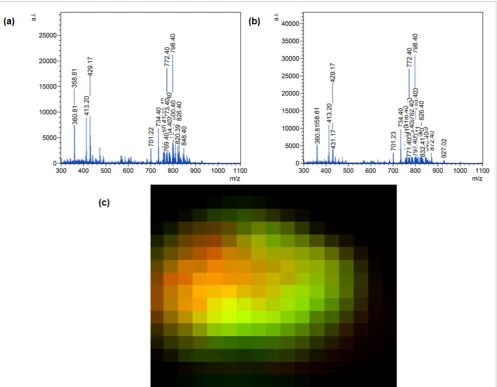
an apparent spot width of 5.3 mm, suggesting that ions are sampled from a 5.3 mm diameter area. Figure 5 (d) indicates that this estimation of the sampling area is realistic showing that although the spots were separated vertically in reality (Figure 5a) in the MAIV-MS image there is vertical “cross-talk” with the lower spots being observed whilst the bottom end of the upper spots is sampled. Comparison with Figure 4 (b) shows that the “selectivity” has been improved from a ~7.8 mm diameter sampling area to a sampling area of ~5.3 mm diameter. The modified cone was used to record the MAIV-MS image of a horizontal section of rat brain shown in Figure 6 (a–c). As can be seen the lipids’ signals were recorded with good sensitivity and again selected signals can be
overlaid (Figure 6c) to show that some spatial informa -tion is retained.
Conclusions
[image:8.595.55.553.95.446.2]MAIV-MS has been implemented on a commercial quad -rupole-quadrupole-time-of-flight mass spectrometer fitted with an orthogonal intermediate pressure MALDI source. During these experiments it was observed that ions were not observed continuously when the sample was under vacuum but only when it was “under” the instrument’s sampling cone. Investigation of this phenom -enon lead to the modification of the sampling cone from
Figure 5. MAIV-MS images recorded using the 2 mm sampling cone extended 2 mm towards the sample surface with the modified pumping regime. (a) Optical images of the 5 × 2 mm diameters spots of 10 pmol angiotensin II spaced 10 mm apart recorded. (b) MAIV-MS image of the angiotensin II [M + 2H]2+ ion at m/z523.8 obtained from these spots in raster imag
8 MAIV Mass Spectrometry and Imaging on a Modified QqTOF Mass Spectrometer
an initial 4 mm orifice to a 2 mm orifice extended 2 mm towards the sampling plate. This modification reduced the diameter of the area sampled from ~7.8 mm to ~5.3 mm. Using the modified instrument MAIV-MS images have been recorded for the first time.
Further work is now required in order to ascertain the relationship between sample height, sampling cone diam -eter and the curtain gas flow impinging on the sample surface (as it exits the sample orifice plate) on the area sampled. It remains to be seen whether the selectivity in sampling area obtainable in MAIV-MS experiments conducted in the way described here would make it a viable technique for imaging, but the data acquired to date do suggest that there may be a role for it as a complementary technique to aid compound identifica -tion/change analyte selectivity that could be used in
much the same way as liquid extraction surface analysis (LESA)7 is in imaging experiments at present.
Acknowledgements
This work was in part funded by a Summer Studentships awarded to Alex Harding and Charlotte Curtis by the British Mass Spectrometry Society.
References
1. J. Li, E.D. Inutan, B. Wang, C.B. Lietz, D.R. Green, C.D. Manly, A.L. Richards, D.D. Marshall,
S. Lingenfelter, Y. Ren and S. Trimpin, “Matrix
[image:9.595.46.544.95.482.2]assisted ionization: New aromatic and nonaromatic matrix compounds producing multiply charged lipid, peptide, and protein ions in the positive and nega -tive mode observed directly from surfaces”, J. Am. Soc. Mass Spectrom. 23, 1625–1643 (2012). https:// doi.org/10.1007/s13361-012-0413-z
2. J.L. Zink, “Triboluminescence”, Acc. Chem. Res. 11, 289–295 (1978). https://doi.org/10.1021/
ar50128a001
3. S. Trimpin and E.D. Inutan, “Matrix assisted ioniza -tion in vacuum, a sensitive and widely applicable ionization method for mass spectrometry”, J. Am. Soc. Mass Spectrom. 24, 722−732 (2013). https://doi. org/10.1007/s13361-012-0571-z
4. E.D. Inutan and S. Trimpin, “Matrix assisted ioniza -tion vacuum (MAIV), a new ioniza-tion method for biological materials analysis using mass spectrome -try”, Mol. Cell Proteomics 12, 792–796 (2013). https:// doi.org/10.1074/mcp.M112.023663
5. R. Lemaire, A. Desmons, J.C. Tabet, R. Day, M. Salzet and J. Fournier, “Direct analysis and MALDI imaging of formalin-fixed, paraffin-embedded tissue sec -tions”, Proteome Res. 6, 1295–1305 (2007). https:// doi.org/10.1021/pr060549i
6. P.J. Trim, S.J. Atkinson, A.S. Princivalle, P.S. Marshall, A. West and M.R. Clench, “Matrix-assisted laser desorption/ionisation mass spectrometry imaging of lipids in rat brain tissue with integrated unsuper -vised and super-vised multivariant statistical analy -sis”, Rapid Commun. Mass Spectrom. 22, 1503–1509 (2008). https://doi.org/10.1002/rcm.3498
7. J.G. Swales, J.W. Tucker, N. Strittmatter, A. Nilsson, D. Cobice, M.R. Clench, C.L. Mackay, P.E. Andren, Z. Takáts,P.J.H. Webborn and R.J.A. Goodwin, “Mass spectrometry imaging of cassette-dosed drugs
for higher throughput pharmacokinetic and biodistri -bution analysis”, Anal. Chem. 86, 8473–8480 (2014).