ISSN Print: 2160-049X
DOI: 10.4236/wjm.2019.96011 Jun. 28, 2019 163 World Journal of Mechanics
Offside Detection System Using an Infrared
Camera Tracking System
Esteban Lopez, Peter E. Jenkins
*Mechanical Engineering Department, University of Colorado, Denver, USA
Abstract
This paper describes an experimental offside detection system that will be capable of detecting offside passes during a game of soccer. Soccer is the world’s most popular and most televised sport. In recent years, FIFA has im-plemented goal line technology in order to end controversial goals/missed goals during high profile competitive matches. The most contentious aspect of the sport is the offside rule and its many controversial calls or lack of calls. Sometimes the linesmen cannot see the passage of playing fast enough to make a correct decision. Being similar to goal line technology, people have requested offside technology to help the linesmen and to reduce the number of incorrect offside calls in a game. This paper describes a working offside detection system that can accurately detect offside passes. Positional data was exported from a VICON infrared motion tracking camera system and a MATLAB script was written so that it can analyze the positions of the players and the ball and determine if a pass was offside.
Keywords
Soccer, Motion Simulation
1. Introduction
The purpose of this project is to design and develop an experimental offside de-tection system that will be capable of detecting offside passes during a game of soccer. Soccer is the world’s most popular and most televised sport. Every year, thousands of players from all across the world compete in some of the most competitive and prestigious leagues. In recent years, FIFA [1], soccer’s govern-ing body, has implemented goal line technology in order to end controversial goals/missed goals during high profile competitive matches. This has been a step in the right direction, however, there are still many issues in the world of soccer. How to cite this paper: Lopez, E. and
Jen-kins, P.E. (2019) Offside Detection System Using an Infrared Camera Tracking System. World Journal of Mechanics, 9, 163-176. https://doi.org/10.4236/wjm.2019.96011
Received: May 29, 2019 Accepted: June 25, 2019 Published: June 28, 2019
Copyright © 2019 by author(s) and Scientific Research Publishing Inc. This work is licensed under the Creative Commons Attribution International License (CC BY 4.0).
DOI: 10.4236/wjm.2019.96011 164 World Journal of Mechanics enough to make a correct decision. There are many cases in which a ball is played too quickly for anyone to make the correct call. Being similar to goal line tech-nology, people have called out for offside technology to help the linesmen and to reduce the number of incorrect offside calls in a game. That is why the objective of this project is to create a working offside detection system that can accurately detect offside passes. Positional data will be exported from the system and a MATLAB script will be written so that it can analyze the positions of the players and the ball and determine if a pass was offside.
2. Methods
1) The Offside Rule
In order to understand how this offside detection system is going to function, one must understand the offside rule first. The offside rule is defined as follows
[2]: “A player is offside when he/she is nearer to the opponent’s goal line than the second to last opponent when the ball is played/passed from one player to the player that is nearest to the goal line. Being level with the second to last op-ponent does not constitute being offside, neither does being level with both the last two opponents if they happen to be in line”. When judging the condition of being “nearer”, only a player’s head, torso, legs, and feet are taken into consider-ation. The player’s arms do not count. A player cannot be offside in his/her own half of the pitch regardless of where he/she is positioned in relation to the ball or members of the opposing team. In order for a player to be considered offside, he/she must be involved in active play. This can be accomplished in two ways. One is to be interfering with the play, or if the player is interfering with an op-ponent.
2) VICON System Specifications & Setup
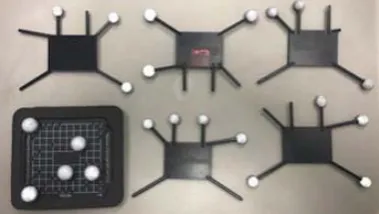
DOI: 10.4236/wjm.2019.96011 165 World Journal of Mechanics positions of rigid bodies and exports that data as a file, or in real time if needed. VICON was generous and provided a free month-long trial of their Tracker software for this project. The Bonita 10 cameras track rigid bodies via the use of reflective markers. In order to create a rigid body in the system, the reflective markers need to be grouped into unique clusters [4]. Each pattern must be unique, otherwise the cameras will confuse one cluster for another and combine or remove desired rigid bodies. Figure 1 shows some of the reflective markers used in this project.
Once the reflective markers have been put into unique clusters, the next step is to strap them onto the desired rigid bodies. In this project, the objects that need to be tracked are each player’s legs, torso, and head. There are four players in-volved in this simulation, so a total of four heads, four torsos, and eight legs need to be tracked. Figure 2 shows an example of how the markers were strapped onto the players.
Once each player has been strapped with their designated markers, the next step is to use the Tracker software to create the rigid bodies. Once the cameras have been calibrated and set, the software will recognize each marker and each unique pattern and create a rigid body. Each rigid body can be labeled so that one can keep track of which rigid body belongs to each player. Figure 3 shows how each rigid body is represented in the software for each player and the ball.
[image:3.595.278.468.447.554.2]Additionally, the ball that will be used during this project also needs to be tracked by the VICON camera system. Since the reflective markers that are used to track the players are spheres, they cannot be used to track the ball. The reflec-tive markers would keep the ball from rolling. The solution to this problem was
Figure 1. Reflective markers for rigid body tracking.
[image:3.595.210.535.586.705.2]DOI: 10.4236/wjm.2019.96011 166 World Journal of Mechanics
Figure 3. Rigid bodies as shown on VICON Tracker software.
to use OptiTrack reflective tape. The reflective tape was cut into small circles and placed in unique patterns across the ball so that the software could identify the ball as its own rigid body. Figure 4 shows the ball and the reflective tape used for tracking.
3) Single Pass Simulation
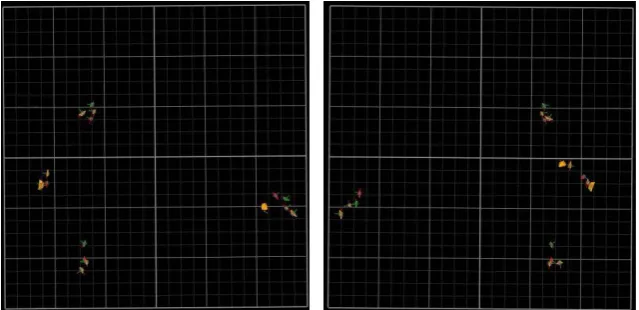
In this project, simulations were conducted with four players. Players 1 and 2 were part of Team A. Team A was the attacking team making the passes. Players 3 and 4 were part of Team B. Team B was the defending team setting the offside line. Figure 5 shows the position of both teams before and after the single pass was made.
It can be seen that the only object that moves is the ball. This was a way to control the offside line in order to ensure that they algorithm correctly identified the type of pass. In this situation, the ball is at rest and is passed only once. This simulation was conducted twice. Once for an onside pass and once for an offside pass. In the first pass, player 1 passes the ball to player 2. Both players are behind players 3 and 4, and therefore onside. In the second pass, player 2 is in front of players 3 and 4 and therefore in an offside position. Figure 6 shows the loop in the algorithm that was used to determine the frames in which the ball was mov-ing and shows the first 22 frames.
The loop runs through all the position changes in the X-direction of the ball and finds any frame where the ball has traveled more than 10 millimeters. Once it has found these frames, it places them in the vector shown in Figure 6. The first frame in the vector is where the pass was made. The rest of the algorithm would then find the player’s position at this frame and determine if the pass was onside or offside. This report will not go into further detail about the methods used for the single pass scenarios. This report will instead have an in depth look at the methods used for the final running simulation [5].
4) Final Running Simulation
DOI: 10.4236/wjm.2019.96011 167 World Journal of Mechanics
[image:5.595.214.534.321.476.2]Figure 4. Ball and its reflective markers.
Figure 5. Static trial player positions before & after pass.
DOI: 10.4236/wjm.2019.96011 168 World Journal of Mechanics
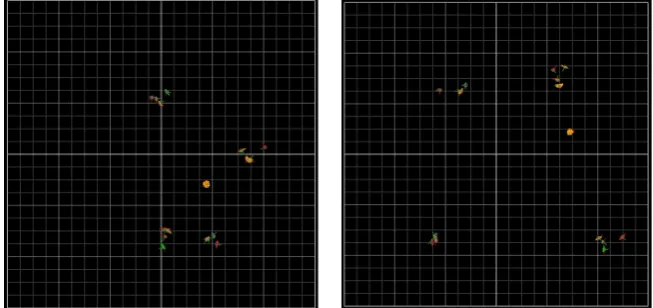
Figure 7. Running simulation player positions changing with time.
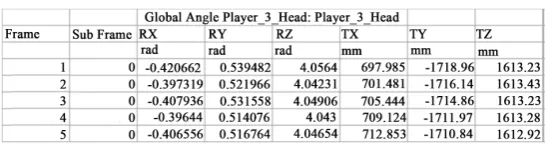
This running simulation is the final run that is to be analyzed by the algo-rithm. For this project, the running simulation lasted 2 minutes and 9 seconds. The code was altered so that it could read all passes sequentially. In order for the algorithm to detect passes, the positional data needed to be loaded onto MATLAB. The data for each rigid body was exported as an excel file. Figure 8
shows the way the data was formatted for all rigid bodies.
The software tracks six different types of positional data for each rigid body. Columns one through three are the rotational positions in the X, Y, and Z direc-tions. These are measured in radians. Columns four through six are the transla-tional positions in the X, Y, and Z directions. These are measured in millimeters. This project will only focus on columns four through six for each rigid body since the translational data is what will be analyzed. In this simulation, the ball was passed under three different conditions. The first type of pass that was ob-served was when the ball was at rest and was then kicked. In order to determine when the ball was kicked, the code looks at the changes in the X-direction. If the changes in the X-direction went from less than 10 mm per frame to greater than 10 mm per frame, then the ball was considered to be in motion, and thus passed at that specific frame. Figure 9 shows the changes in the X-direction for the ball at frame 2944.
The majority of the passes happened under these conditions. Figure 10 shows how the code was written to capture the frames where these pass conditions were met.
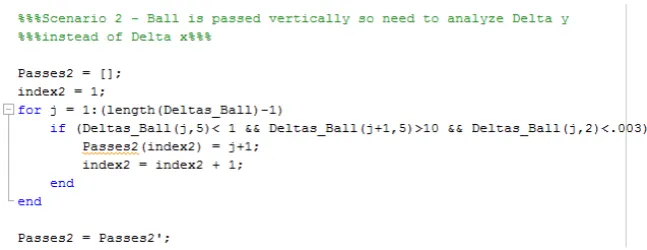
The second type of pass that was observed was when the ball was passed ver-tically. In this scenario, the code needed to read the changes in the Y-direction for the ball. The same conditions were applied as in the first type of pass. If the changes in the Y-direction went from less than 10 mm per frame to greater than 10mm per frame, then the ball was considered to be in motion, thus passed at that specific frame. Figure 11 shows the changes in the Y-direction for the ball.
Only one pass fell under this criterion and that was at frame 561. Figure 12
DOI: 10.4236/wjm.2019.96011 169 World Journal of Mechanics
[image:7.595.276.471.171.358.2]Figure 8. Exported positional data for player 3 head first five frames.
[image:7.595.211.531.384.510.2]Figure 9. Column 4 shows ball changes in X-direction at frame 2944 for pass Type 1.
Figure 10. Pass type 1 code for determining relevant frames.
[image:7.595.276.470.537.708.2]DOI: 10.4236/wjm.2019.96011 170 World Journal of Mechanics
Figure 12. Pass type 2 code for determining relevant frame.
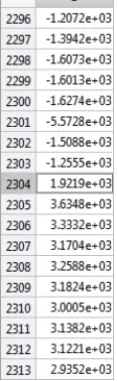
The final type of pass that was observed was when the ball had already been passed and was passed again by the receiving player while the ball was still in motion. In this scenario, the ball was never at rest between passes and thus needed to be analyzed in a different way. For this scenario, the velocities of the ball at each frame were determined. If the changes in the X-direction were greater than 10 mm per frame, but there was a sign change in the velocities, then the frames where the sign changes occurred were considered a pass. Figure 13
shows the changes in the X-direction for the ball at frame 2304.
There is a sign change in the velocities at frame 2304 (Figure 14). This means that a pass was made at this frame. Figure 15 shows how the code was written to calculate the velocities at each frame and how the sign changes were found.
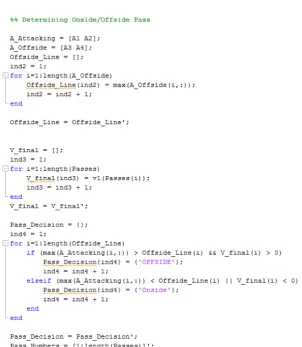
Finally, once pass frames had been isolated, various loops were created in the algorithm that would compare the positions of each player’s legs, torso, and head at those frames. A final loop was created to compare those positions between the attacking players and the defending players. Figure 16 shows how the player’s positions at all relevant frames were found.
The final section in the algorithm then determined if the pass was onside or offside. Figure 17 shows the final loops in the code that determined offside passes.
3. Results
The results for the single pass simulations can be seen on Table 1.
The results determined from the algorithm match the results that were ob-tained by visually confirming the pass from the simulation videos that were rec-orded from the software.
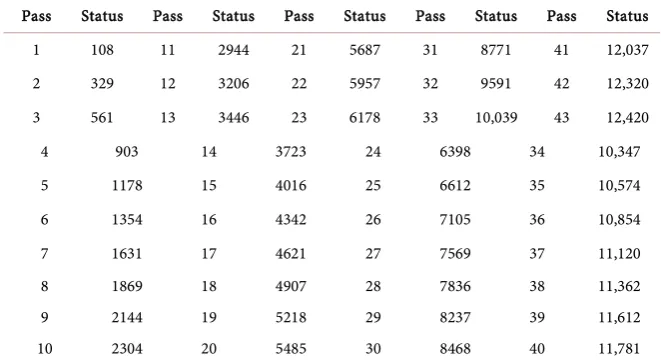
The running simulation is more complex than the single pass simulations. In order to determine the number of passes and their status, the frames where the passes were made needed to be determined. Table 2 shows the number of passes and their corresponding frames.
DOI: 10.4236/wjm.2019.96011 171 World Journal of Mechanics
Figure 13. Columns 4 shows ball changes in X-direction at frame 2304 for pass type 3.
Figure 14. Shows the calculated velocities for the frames around frame 2304.
Figure 15. Pass type 3 code for determining relevant frames.
Table 1. Results for the single pass simulations.
Onside Static Pass Offside Static Pass
Frame Status Frame Status
DOI: 10.4236/wjm.2019.96011 172 World Journal of Mechanics
Figure 16. Code for determining player positions at relevant frames.
DOI: 10.4236/wjm.2019.96011 173 World Journal of Mechanics
Table 2. Number of passes & corresponding frames their corresponding frames.
Pass Status Pass Status Pass Status Pass Status Pass Status
1 108 11 2944 21 5687 31 8771 41 12,037
2 329 12 3206 22 5957 32 9591 42 12,320
3 561 13 3446 23 6178 33 10,039 43 12,420
4 903 14 3723 24 6398 34 10,347
5 1178 15 4016 25 6612 35 10,574
6 1354 16 4342 26 7105 36 10,854
7 1631 17 4621 27 7569 37 11,120
8 1869 18 4907 28 7836 38 11,362
9 2144 19 5218 29 8237 39 11,612
10 2304 20 5485 30 8468 40 11,781
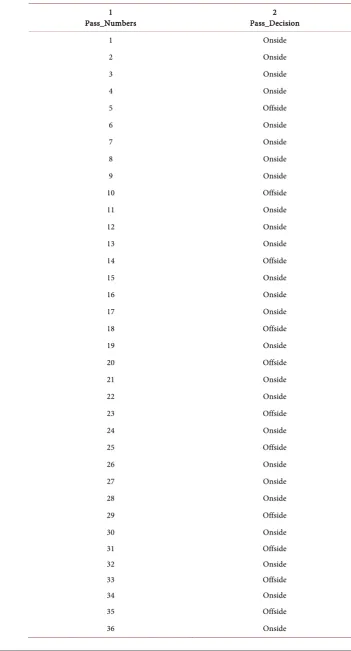
results of this project. Once the number of passes and their corresponding frames had been identified, the algorithm was able to determine whether each pass was onside or offside. Table 3 shows the final results of the running simula-tion for each pass. Table 4 shows the results from the visual confirmation of each pass and is favorably compared to the simulation results given in Table 4.
4. Conclusion
In conclusion, the offside detection system prototype has successfully identified onside and offside passes. Table 3 and Table 4 in the results section are identic-al. This means that the algorithm accurately determined the status of all 43 passes in the simulation. The success of the prototype is a major step towards the advancement of technology in soccer.
5. Discussion
Even though the prototype was a success, there were some limitations to the de-sign. The biggest limitation to the design was the fact that the Tracker software was not meant to track a large number of rigid bodies at once. Since each rigid body had to be comprised of a unique pattern of reflective markers, it became difficult to have enough different patterns for each rigid body as the number of rigid bodies increased. Additionally, the software would sometimes confuse one rigid body for another if two players got to close to one another. If one player ran past another, there were instances where the markers on one player’s leg were too close to another player’s leg, thus creating one rigid body that the soft-ware could not recognize. As a result, there are gaps in the data that was ex-ported from the software. Fortunately, these gaps did not occur at the instances where the passes were made. However, moving forward, this could be an issue if the gaps were to occur during important sections of the simulations.
DOI: 10.4236/wjm.2019.96011 174 World Journal of Mechanics
5 Offside
6 Onside
7 Onside
8 Onside
9 Onside
10 Offside
11 Onside
12 Onside
13 Onside
14 Offside
15 Onside
16 Onside
17 Onside
18 Offside
19 Onside
20 Offside
21 Onside
22 Onside
23 Offside
24 Onside
25 Offside
26 Onside
27 Onside
28 Onside
29 Offside
30 Onside
31 Offside
32 Onside
33 Offside
34 Onside
35 Offside
[image:12.595.181.533.86.738.2]DOI: 10.4236/wjm.2019.96011 175 World Journal of Mechanics Continued
37 Offside
38 Onside
39 Offside
40 Onside
41 Onside
42 Onside
[image:13.595.209.538.238.425.2]43 Onside
Table 4. Pass results from visual confirmation of simulation recordings.
Pass Status Pass Status Pass Status Pass Status Pass Status
1 Onside 11 Onside 21 Onside 31 OFFSIDE 41 Onside
2 Onside 12 Onside 22 Onside 32 Onside 42 Onside
3 Onside 13 Onside 23 OFFSIDE 33 OFFSIDE 43 Onside
4 Onside 14 OFFSIDE 24 Onside 34 Onside
5 OFFSIDE 15 Onside 25 OFFSIDE 35 OFFSIDE
6 Onside 16 Onside 26 Onside 36 Onside
7 Onside 17 Onside 27 Onside 37 OFFSIDE
8 Onside 18 OFFSIDE 28 Onside 38 Onside
9 Onside 19 Onside 29 OFFSIDE 39 OFFSIDE
10 OFFSIDE 20 OFFSIDE 30 Onside 40 Onside
software needs to see all reflective tape marks on the ball in order to establish it as a rigid body, the bottom portion of the ball did not have any reflective tape on it. This resulted in gaps in the data whenever the ball rolled since the bottom portion of the ball would end up on top while in motion. When this happened, the cameras would momentarily lose track of the ball for a few frames. The cam-eras would detect the ball once it had completed a rotation and all pieces of tape were visible yet again. These gaps in the data affected two of the passes during the simulation. Frames 9175 and 12,202 saw two short and quick passes between players 1 and 2. Since there were gaps in the data, the software did not track these passes. Fortunately, both of these passes were onside and happened at a short distance where they did not affect the results of the simulation. All offside passes were accurately tracked and were not affected by the gaps in the data. Ad-ditionally, there were some movement restrictions throughout this project. The VICON system was located inside a computer lab/classroom, therefore all passes needed to remain on the ground. The ball needed to be passed at a reasonable speed so that no equipment or students would get injured.
DOI: 10.4236/wjm.2019.96011 176 World Journal of Mechanics tical in an indoor setting. The best way to move forward is to adopt a camera system that uses artificial intelligence and machine learning to detect color and track objects based on color. There have been numerous research studies done within the last 10 years and the technology is there. In a real game setting these cameras can be used outdoors and would be able to track the colors of each team’s jerseys. The VICON system does however work accurately and effectively in terms of the scope of this project. This project is the foundation for what is meant to be a radical change in the world of soccer. Offside technology is years away from being perfected, however this project has demonstrated that it can be done accurately and effectively given the proper resources. The purpose of this project has been completed and the main objective has been met. The VICON infrared camera system can accurately detect offside passes. This technology can be used to aid the referees and officials to fairly influence the outcome of soccer games.
Acknowledgements
1) The authors would like to thank the University of Colorado Denver Digital Animation Center.
2) The support of VICON was appreciated.
Conflicts of Interest
The authors declare no conflicts of interest regarding the publication of this pa-per.
References
[1] The Hidden Technologies at the 2018 FIFA World Cup, June 4 2018.
https://football-technology.fifa.com/en/blog/hidden-technologies-at-the-2018-fwc [2] Laws of the Game-FIFA, 2015/2016.
https://img.fifa.com/image/upload/datdz0pms85gbnqy4j3k.pdf
[3] VICON Motion Capture System. https://www.vicon.com/motion-capture [4] Cortes, N., Blount, E., Ringleb, S. and Onate, J.A. (2011) Soccer-Specific Video
Si-mulation for Improving Movement Assessment. Sports Biomechanics, 10, 22-34. https://doi.org/10.1080/14763141.2010.547591