FILTER CAKE YIELD EQUATION USING LMT DIMENSIONAL ANALYSES
*
Onwe John Ituma and Ademiluyi Joel
Department of Civil Engineering, University of Nigeria, Nsukka, Nigeria
ARTICLE INFO ABSTRACT
An equation expressing filterability in terms of Filter Cake Yield has been derived using Buckingham
shows that the cake yield fr
vessel, applied pressure and initial solids content of the sludge while being inversely proportional to specific resistance of the filtrate, viscosity of filtrate, compressibilit
pressing time. This is in agreement with scientific reasoning and experimental observation. The new equation enables performance of a pressure filter (Filter Press) to be predicted from a simple laboratory determination of c
depends on a number of parameters, for instance, figures 4,5,7,8,9 and 10
effects of pressures, pressing time, initial solids contents, conditioner dosages , spec
and compressibility on the filter cake yield. For instance, increasing ferric chloride dosage from 11.87% to 22.61% increased filter cake yield from 2.4254g/Cm
specific resistance from 1.7372 x 10 graph to attain accep
3059.15g/Cm 6628.18g/Cm
responded similarly when compared with previous research works. Moreover, experimental verification of the equation and the derived curves has been described and it may b
for practical purposes, the predicted performance agrees with measured values with a correlation coefficient of 0.998. Although, the scope of the experimental verification was somewhat limited, it was sufficient enough to demonstrate the u
method can be applied in predicting full
experiments and the procedure has been fully described and comparatively analyzed.
Copyright © 2018, Onwe John Ituma and Ademiluyi Joel permits unrestricted use, distribution, and reproduction
INTRODUCTION
The management ofsludge from both domestic and industrial process operations occasioned by modern advancement in technology is highly complex and cost effective, hence, if poorly accomplished, may jeopardize the environmental and sanitary advantages expected from the treatment. The importance attached to sludge management was widely acknowledged by Agenda 21, which included in the theme of environmentally wholesome management of solid wastes; sludge issues and as well defined the following modalities towards its administration; reduction in production, maximum increase in reuse and recycling and the adoption of environmentally wholesome treatment and disposal,
et al., 2006). Moreover, due to the low indices of wastewater
and other industrial processes resulting from high population increase and industrialization especially in developing countries, there is need to explore and adopt more scientific
ISSN: 0975-833X
Article History: Received 04th March, 2018
Received in revised form 27th April, 2018
Accepted 14th May, 2018
Published online 30th June, 2018
Citation: Onwe John Ituma and Ademiluyi Joel, Research, 10, (06), 70877-70883.
Key words: Cake yield, Sludge, Prediction, Filter press, Dimensional Analysis, Filtration.
*Corresponding author
RESEARCH ARTICLE
FILTER CAKE YIELD EQUATION USING LMT DIMENSIONAL ANALYSES
Onwe John Ituma and Ademiluyi Joel
Department of Civil Engineering, University of Nigeria, Nsukka, Nigeria
ABSTRACT
An equation expressing filterability in terms of Filter Cake Yield has been derived using Buckingham- method of LMT Dimensional Analysis. The model equation developed (Equation 32) shows that the cake yield from a filter press is directly proportional to the filter area of the pressure vessel, applied pressure and initial solids content of the sludge while being inversely proportional to specific resistance of the filtrate, viscosity of filtrate, compressibilit
pressing time. This is in agreement with scientific reasoning and experimental observation. The new equation enables performance of a pressure filter (Filter Press) to be predicted from a simple laboratory determination of cake yields. Curves derived from model show how filter cake yield depends on a number of parameters, for instance, figures 4,5,7,8,9 and 10
effects of pressures, pressing time, initial solids contents, conditioner dosages , spec
and compressibility on the filter cake yield. For instance, increasing ferric chloride dosage from 11.87% to 22.61% increased filter cake yield from 2.4254g/Cm2.S to 2.7052g/Cm
specific resistance from 1.7372 x 10¹⁰Cm/g to 1.5940 x 10¹⁰Cm/g.
graph to attain accep. Table filtrate quality are; 28.08% for P1
3059.15g/Cm2, 22.61% for P3 = 4078.87g/Cm2, 19.63% for P4 = 5098.58g/Cm
6628.18g/Cm2. Considering the differences in the parameters tested, it is significant that they all responded similarly when compared with previous research works. Moreover, experimental verification of the equation and the derived curves has been described and it may b
for practical purposes, the predicted performance agrees with measured values with a correlation coefficient of 0.998. Although, the scope of the experimental verification was somewhat limited, it was sufficient enough to demonstrate the use of the equation and curves derived in this study. The method can be applied in predicting full-scale performance for any sludge from laboratory experiments and the procedure has been fully described and comparatively analyzed.
John Ituma and Ademiluyi Joel. This is an open access article distributed under the Creative in any medium, provided the original work is properly cited.
sludge from both domestic and industrial process operations occasioned by modern advancement in technology is highly complex and cost effective, hence, if poorly accomplished, may jeopardize the environmental and from the treatment. The importance attached to sludge management was widely acknowledged by Agenda 21, which included in the theme of environmentally wholesome management of solid wastes; sludge issues and as well defined the following modalities ts administration; reduction in production, maximum increase in reuse and recycling and the adoption of environmentally wholesome treatment and disposal, (Andreoli . Moreover, due to the low indices of wastewater resulting from high population increase and industrialization especially in developing
explore and adopt more scientific
options to meet the demand. As a consequence, the amount of sludge produced is expected to increase pos
environmental and health concerns to the developing nations (Afangiden et al., 2014; Ghazy
Wastewater treatment processes such as activated sludge treatment systems produce surplus sludge which has to be disposed of. The surplus sludge contains valuable nutrients and organic matter that can be used to improve soil quality and as a fertilizer for agricultural crops. Sludge treatment processes generally have two main purposes: (i) thickening and dewatering whereby the sludge volume and hence the costs of subsequent handling, transportation, and disposal are reduced, (Uggetti et al., 2010). Recent studies conducted by
2001) and (Ajah, 2010) revealed that despite the fact that the volume of sludge tends to be less than 1% of the total plant influent, sludge handling costs ranges between 21
plant operation and maintenance costs.
International Journal of Current Research
Vol. 10, Issue, 06, pp.70877-70883, June, 2018
, 2018. “Filter cake yield equation using lmt dimensional analyses.
FILTER CAKE YIELD EQUATION USING LMT DIMENSIONAL ANALYSES
Department of Civil Engineering, University of Nigeria, Nsukka, Nigeria
An equation expressing filterability in terms of Filter Cake Yield has been derived using method of LMT Dimensional Analysis. The model equation developed (Equation 32) om a filter press is directly proportional to the filter area of the pressure vessel, applied pressure and initial solids content of the sludge while being inversely proportional to specific resistance of the filtrate, viscosity of filtrate, compressibility coefficient of the sludge and pressing time. This is in agreement with scientific reasoning and experimental observation. The new equation enables performance of a pressure filter (Filter Press) to be predicted from a simple ake yields. Curves derived from model show how filter cake yield depends on a number of parameters, for instance, figures 4,5,7,8,9 and 10 respectively illustrates the effects of pressures, pressing time, initial solids contents, conditioner dosages , specific resistance, and compressibility on the filter cake yield. For instance, increasing ferric chloride dosage from .S to 2.7052g/Cm2.S while reducing Cm/g. The optimum dosages from the = 2039.41g/Cm2, 28.08% for P2 =
= 5098.58g/Cm2 and 28.08% for P5 =
Considering the differences in the parameters tested, it is significant that they all responded similarly when compared with previous research works. Moreover, experimental verification of the equation and the derived curves has been described and it may be concluded that for practical purposes, the predicted performance agrees with measured values with a correlation coefficient of 0.998. Although, the scope of the experimental verification was somewhat limited, it se of the equation and curves derived in this study. The scale performance for any sludge from laboratory experiments and the procedure has been fully described and comparatively analyzed.
Creative Commons Attribution License, which
options to meet the demand. As a consequence, the amount of sludge produced is expected to increase posing serious environmental and health concerns to the developing nations Ghazy et al., 2009) had stated that Wastewater treatment processes such as activated sludge treatment systems produce surplus sludge which has to be f. The surplus sludge contains valuable nutrients and organic matter that can be used to improve soil quality and as a fertilizer for agricultural crops. Sludge treatment processes generally have two main purposes: (i) thickening and sludge volume and hence the costs of subsequent handling, transportation, and disposal are reduced, . Recent studies conducted by (Randal, revealed that despite the fact that the volume of sludge tends to be less than 1% of the total plant influent, sludge handling costs ranges between 21-50% of total plant operation and maintenance costs.
OF CURRENT RESEARCH
Dewatering of sewage sludge is not only found in removal of the excess moisture but to render the sludge odourless and nonputrescible, (Garg, 2009). Similarly, (Ademiluyi, 2012) and (Olukanni et al., 2013) maintained that dewatering of sewage sludge prior to drying or disposal is an important step because the lower the water content of the sludge, the lesser the transport costs. Proper waste management system should be established and enhanced in view of menace imposed in our community due to improper handling and disposal of wastes to our environment. Dimensional Analyses is a conceptual tool often applied in physics, chemistry and engineering to understand physical solution involving a mixture of different kinds of physical quantities.
Dimensional formulae provide a useful catalogue system for physical quantities according to (Raput, 2004). The principle of dimensional homogeneity states that in a physical equation consisting of an algebraic sum of two or more terms, the exponent of the dimension of Length, Mass and Time in any term of the equation must be the same as that in any other term. The system of fundamental units commonly used in Newtonian mechanics is the LMT System. In this study, Buckingham -method was used in developing the new model. Assigning any arbitrary value to the exponent of the variables of interest and expressing the variable as a product of others became expedient hence,
= (1)
The Concept of Filter Cake Yield Modeling
A panoramic view of previous works on cake yield models:
The essence of the research was aimed at formulating a new cake yield equation with compressibility attribute as a measure of filterability. The incorporation of the compressibility coefficient ’S’ is against the traditional filtration equations already suggested by (Raput, 2004; Carman, 1938), (Gale, 1970; Rebhun, 1989) and (16) where the sludge compressibility effects on filterability was obviously unaccounted for. It has been discovered in literature that the traditional equations were embedded with uncertainties in the areas of formulating them. ( Peter, 1975) stressed that since the literature is replete of dewatering operations which have unsatisfactory performance predictions and formulations and considering the controversies among prominent researcher to the present knowledge of filtration equations, it is justified that an accepTable equation which characterize the filtration process has to be derived. The equation to be derived must contain the compressibility coefficient ‘S’ as an attribute. The incorporation of ‘S’ will make such equation accepTable to the previous researchers. Carman derived his equation based on non-compressible sludge cakes. In his equation, which was a modification of Darcy’s equation, he stressed that the specific resistance is constant throughout the filtration process. Hence, (Carman, 1934) proposed the equation
= ( . ) (2)
Where:
A = filter area, m2
Rm = septum resistance, kg/m
V = volume of filtrate. m3 pressure drop, Kg/m2
C = concentration of solids in the feed, Kg/m3 specific cake resistance, kg/m
µ = liquid viscosity, poise = filtration time, s
Integrating the above and neglecting septum resistance, a modified form of the equation by relating specific resistance, R with cake yield is obtained as:
(3)
Where Y is the cake yield (Kg/m2S) (Jones, 1956) while modifying the previous work of (Coackley, 1956) for sludge undergoing rotary filtration process assumed that for a yield equation to be fully described as parabolic, the initial specific resistance must be assumed as zero. Sludge compressibility coefficient was not accounted for in his derivation (Gale, 1970) questioned (Dahlstrom, 1958) for oversimplifying their consideration of the effects of the resistance of the filter medium when dealing with highly compressible cake and thereafter considered mathematically only those equations where the filter medium is negligible . Based on that, they developed a yield model for a rotary vacuum filter from basic filtration equations. It was suggested that in order to express yield in place of the true specific resistance, without approximations of the variable as evidenced in Buchner funnel tests and in agreement with (Anazodo, 1974) latter observations, then a true value reflecting both specific resistance and Initial solids contents should be used as suggested in their model (Pietila et al., 1981). Developed a model to examine the effects of process parameters affecting sludge dewatering using Diaphragm Filter Press. It was discovered that Diaphragm Filter Press filtration process occurs in two distinct steps: the filtration time and the squeezing time. While the filtration phase follows the known conventional pattern at the terminal pressures ranging from 56 to 98Psi, squeezing occurs at terminal pressure of 215Psi. They listed initial solid contents, conditioning, operating pressures and times among process parameters affecting filterability. (Zallm, 1987) carried a research on the effects of skeleton builders on oily sludge using filter press apparatus.
as a means of justifying the filterability of sludge cakes even though he did not add compressibility coefficient S as part of his modified equation. The introduction of compressibility coefficient ‘S’ as an attribute of the new equation cannot be over emphasized. Firstly it eases the rigorous mathematical manipulation of maximum specific resistance as a means of determining the filterability of sludge cakes as formulated by the above named researchers. Similarly, in view of the foregoing, (Ademiluyi, 1987) in the formulation of a valid equation, stated that compressibility attribute of the sludge cake in question should be properly accounted for since the Poiseuille and Darcy laws representing the basis of formulation are only applicable to compressible sludge cakes (rigid materials). It is in the light of this foregoing postulations, that this new equations has judiciously accounted for compressibility coefficient ‘S’ bringing the total variables to nine in the formulation of the new equations for compressible sludge cakes.
MATERIALS AND METHOD
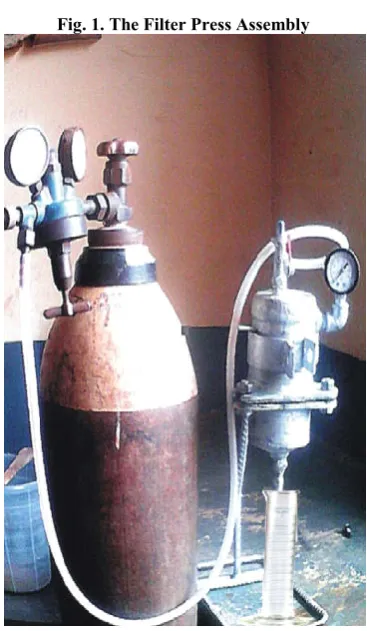
Preparation of sludge slurry: A photograph of the Filter
Press apparatus is seen in Figure 1 while the schematic diagram is represented as figure 1b.Brewery sludge slurry was prepared by mixing given quantities of the desired sludge in 1 liter of distilled water and agitating it for few minutes. 60 ml was drawn from the slurry using a pre-weighed cylinder. The weight of the cylinder and slurry was measured and recorded as w1. The slurry was then oven dried at 103
0
C for 24hours. The new weight was thereafter noted and recorded as w2. The
concentration of the slurry was then calculated as fully described. The filtration process was started by connecting the compressed air line to the top of the sample holder using an easy push through arrangement. Thus, the suspension was forced to flow through the filter cell producing a filter cake at the surface of the filter paper. As the filter cake deposited, the flow rate kept declining. The filtrate was collected in a graduated cylinder placed in a tilted position so that the filtrate traveled along the walls of the cylinder without causing a splash, enabling accurate determinations of equal increments of the filtrate volume.
After about 60 ml of the suspension had filtered through and had formed a cake on the surface of the filter paper, time increments required to produce successive equal increments of filtrate volume were observed. The data were plotted in the appropriate manner and both the cake yield and the specific resistance of the filter cake were then calculated using equation 27. Constant pressure filtration experiments were carried out respectively 0 n 0 . 0 1 2 8 g / C m3, 0 . 0 1 9 4 g / C m3. 0 . 0 2 2 0 g / C m3, 0 . 0 2 4 6 5 g / C m3 a n d 0 . 0 3 9 3 g / C m3 s l u d g e samples using different doses of Ferric Chloride suspensions. The filtration pressure ranges investigated was between 2039.43g/Cm2-6628.155g/Cm2. Filtration was allowed to proceed and stopped once deliquoring, which was determined when the t/V against V
[image:3.595.328.525.37.627.2]plot experienced a sudden change in accordance to traditional filtration behavior was deemed to be beginning. On the conclusion of filtration the formed cake in the filter cell was removed and put in a pre-weighed beaker. It was then dried over a period of twenty four hours and reweighed. The raw data from the laboratory, pilot filter runs made to evaluate the effect of pressure drop, initial solids contents, conditioner dosages, specific resistance and compressibility on cake yields are as shown in Table 3.
Fig. 1. The Filter Press Assembly
Fig. 1b. Schematic diagram of the filter
Developing the New Filtration Equation
[image:3.595.341.525.310.626.2]Y = f (P, A, C, V, μ, θ, Y, R, S) (4)
Or
f (P, A, C, V, μ, θ, Y, R, S) = 0 (5)
From the Buckingham’s -method theories, the total number of variables (n) is nine while the number of fundamental dimensions (m) is three, Hence, the number of π- terms is n – m, 9 – 3 = 6. Therefore, number of π-terms in the equation can be written as:
π1 = Pa Ab μc y (7)
π2 = Pa Ab μc R (8)
π3 = Pa Ab μc C (9)
π4 = Pa Ab μc θ (10)
π5 = Pa Ab μc V (11)
π6 = Pa Ab μc S (12)
Where π1 to π6 are dimensionless terms while a, b, and c are
exponents to be determined by dimensional Analysis.
Considering π1– Term: By replacing the right hand side of
equation (7) with the corresponding dimensions of the variables and the dimensionless term on the left hand side with M0 L0 T0, equation obtained is given as:
M0 L0 T0 = (ML-1T-2)a (L2) b (ML-1T-1) c (ML-2T-1) (13)
Where a, b, c, are unknowns to be determined using dimensional homogeneity between variables.
Equating the exponents of M, L and T on the left hand side to the corresponding exponents on the right hand side, we get,
M: 0 = a + c + 1 (14)
L: 0 = -a + 2b –c -2 (15)
T: 0 = -2a –c -1 (16)
From equation (iii), c = -2a- (17),
Combining equation (14) and (16), => a-2a-1 +1 =0
= a = 0, c= -1
Solving equation (15) for the values of a=0 and c=-1 yields, b= ½
Substituting the values of a, b and c in Equation (7), we obtain:
Π1 =
/
(18)
Similarly, analyzing π2, π3, π4, π5 and π6 terms respectively
gives:
= , = , = , = / , =
Substituting the specific expressions for the dimensionless terms π1, π2, π3 , π4 , π5 and π6 into equation (6), yields:
f ( / . . . . / .PS) = 0 (19)
Since equation (19) does not give the exact relationship between the parameters being investigated; there is need to generate experimental data. Following Buckingham’s π-method, any of the dimensionless terms of equation (19) can be written as a function of the others hence, it transforms to:
/
= a b c
/
d
(PS)e (20)
The exponents in equation (20) can be obtained by regression analysis using experimental data.
For easy determination of the exponents, the above equation can be transformed as;
Ln = Ln K + a Ln + b Ln + c Ln + d Ln e Ln PS (21)
ASSUMPTIONS
Let M = , X1 = , X2 = , X3 = , X4 = , and X5 = PS
Hence, equation (21) becomes,
M = Ln K + aX1 + bX2 + cX3 +dX4 + eX5 (22)
From the experimental data obtained (Data too large to reproduce), values of the constants a, b c, d and e were evaluated by Regression using SPSS (Table 2).
From Table 2 above, LnK = -0.1571, K = 0.8546 a = -0.8270, b = 0.1485, c = -0.1565
d = -1.1885, e = -0.0494
But a bc d (PS)e,
Hence, substituting the values of K, a, b, c, d and e in equation (20) yields,
= ( ) . ( ) . ( ) . …
( ) . ( ) .
(23)
= 0.8546 . .. .. .. . (24)
Equation (24) can be transformed as follows:
By multiplying both sides of equation (24) by V8 and rearranging,
. = . . .
. . . (25)
A plot of V9.189 and . gives a straight line with slope, b2 = 120.68
Hence, equation (25) becomes,
= .. . . . . . . (26)
Equation (26) is the desired cake yield equation for total filter press solids yield.
Substituting the values of b2 and K in the model gives,
= 0 .007082 . . . . . . . (27)
RESULTS AND DISCUSSION
Evaluation of the Specific Resistance and Compressibility
Coefficient: The formulation of the model involved nine (9)
parameters listed in equation (5) above. The first seven (7) were experimentally determined while the last two were evaluated. Cake yield was measured as the dry solid mass deposited per unit filtration area per filtration cycle. For the purpose of the parameters mentioned above, a detailed analyses of the raw data obtained were made. The slopes of both t/V against V was plotted to evaluate specific resistance to filtration while the plots of log of both sides of the relation, R=KPS was taken in order to determine the compressibility coefficient. A comparative analysis of the developed model, equation (27) with both Carman’s model, equation (3) and the Actual experimental yield showed a close agreement.
Variation of Cake Yield with Pressing Time
From the model, cake yield is inversely proportional with the pressing time. Hence, from equation (27),
Y ∝ . .
Hence, = .
Where K is proportionality constant given as
[0 .007082
. . .
. μ . . ]
.
The variation of cake yield with time is however affected by chemical dosages which tend to decrease the amount of period needed for the filtration process to complete. For instance, if the pressing time is increased from , cake yield would decrease from . It is important to note that in pressure filters, time of filtration varies as cake thickness increases Jones, (1956). However, the dependence of pressing time on cake yield is shown on figure 2.
Effects of Pressures on Filter Cake Yield: According to the
relationship derived from Darcy’s law which relates pressure drop to dry solids yield (equation 3), an increase in pressure drop should result in an increase in dry cake production. This is the case if the filter cake is not highly compressible such that the specific cake resistance increases with pressure drop Svarovsky (2000). It is also beneficial to gradually increase the pressure until a constant pressure is reached. This is because the solids are non-homogeneous and a high initial pressure drop can result in particles plugging the interstices of the cloth Reynolds, et al.(2003).
With the assumption that the cake was not highly compressible, the applied pressure was thus set to a maximum of 6.5bars for all runs. It was also necessary to have the applied pressure as high as possible to enable maximum pressure drop over the filter. This is to ensure that the cake was held firmly onto the filter medium during filtration. The graph in figure 4 shows the effects of pressures on filter cake yields, the model cake yield increases as the operating pressure increases, which is in agreement with both Carman and Jones’s findings earlier cited above. As filtration continues, more and more solid settles reducing the porosity of particles so that the pressure of water increases and also the cake yield. Jones (1956) found that the proportional increase in cake yield with pressure was also a function of sludge compressibility. The effects of operating pressures on the cake yield as developed is in agreement with the findings of Half (1952) where he stated that the yield per hour on a rotary filter was practically constant for pressures greater than 1054.60g/Cm2. It is important to note that while Half’s theory does not hold for less compressible sludge, He could not demonstrate that in his approach.
Mathematically from the model,
∝ .
Furthermore, the deterioration of filtrate quality as the pressures were increased cannot be ignored as was the case with previous Researchers. However, physically, it is quite easy to explain. As the operating pressures were increased, sludge flocs were ruptured accounting for the poor filtrate quality.
Effects of Conditioner Dosages on Cake Yield: From Figures 5,
cake yield increases with increased conditioner dosage until an optimum dosage is reached, all other conditions being equal. For instance, increasing Ferric Chloride dosage from 11.87% to 22.61% increased filter cake yield from 3.785 x 10⁻⁴g/Cm2.S to 4.4118x 10⁻⁴g/Cm2.S while reducing specific resistance from 1.7372 x
1010Cm/g to 1.5940 x 10¹⁰Cm/g. The optimum dosage from the graph
to attain acceptable filtrate quality is 19.63% for P5 =
6628.18g/Cm2. Considering the differences in the concentrations of the five sludge samples tested, it is significant that they all responded similarly. Also, the increase in the cake yield may be attributable to the reduction in sludge compressibility due to the increased conditioner doses. It is important to note that overdosing the unconditioned sludge beyond the optimum requirement mares the solids yield while the possibility of increasing the specific resistance cannot be ruled out. This is due to de-flocculation as a result of excessive surface coverage and charge reversal. Overall, the most important benefit of polymer conditioning of brewery sludge is the improvement in sludge dewater ability. This benefit is based on the proper use of polymers and their integrated effects on sludge characteristics. In summary, the new model conforms favourably with previous works of (Jones,1956; Zall et al 1989; Gale et al.1970) where the cake yield increased as the rate of conditioning increased while the specific resistance of the sludge decreases.
Variation of Cake Yield with Initial Solids Content at
Various Pressures: Many Researchers including (Ademiluyi
reported to be as great as observed in this study. The variation of cake yields for different values of initial solids content at different operating pressures is shown in Figure 6. It is important to note here that the effect of initial solids moisture on performance is much more pronounced in Filter Presses than in Vacuum filtration, Jones (1956). Cake yield increases with initial solids content at higher pressures. From the developed model, cake yield is mathematically related to operating initial solids content, C as shown below;
= .
Where K is proportionality constant.
Similarly, results show that an increase in the concentration of solids in the feed results in an increase in dry cake production and that an increase in the specific cake resistance can result in a decrease in the dry cake production. Derivation of Darcy’s law and neglecting filter medium resistance leads to a relationship between the solids concentration and the dry cake production capacity (in kg/m2/s) (Svarovsky, 2000): The relationship between the total dry cake produced and the solids concentration is very nearly accurate to the relationship described above (equation 3). Deviation from linearity can be due to the effect of the filter medium resistance, which is neglected in the derivation of the relationship. The benefit of a higher feed solids concentration can be seen in the resultant reduction in specific cake resistance.
Correlation between experimental and predicted yields:
The correlation between the actual yield (YA) and predicted
yield (YLMT) from figure 7 was found to be 0.9933 showing the
validity of the developed model.
Conclusion
The LMT Model equation developed (Equation 27) shows that the cake yield from a filter press is directly proportional to the filter area of the pressure vessel, applied pressure and initial solids content of the sludge while being inversely proportional to specific resistance of the filtrate, viscosity of filtrate, compressibility coefficient of the sludge and pressing time. This is in agreement with scientific reasoning and experimental observation. Equations 26 and 27 enable performance of a pressure filter (Filter Press) to be predicted from a simple laboratory determination of cake yields. Curves derived from equation 27 show how filter cake yield depends on a number of parameters, for instance, figures 3,4,5 and 6 illustrates the dependence of filter cake yield on pressing time, pressures, conditioner dosages and initial solids contents.
Moreover, experimental verification of the equation and the derived curves has been described and it may be concluded that for practical purposes, the predicted performance agrees with measured values. What makes the model a novelty is the incorporation of the compressibility attribute of the sludge. Moreover, Ademiluyi (2014) had stated that the only way through which a filtration can validly predict a filtration process is when the equation’s plot of t/V and V gives a straight line, the developed model agreed with the above
assertion as the plot of V9.189 against . gave s straight line with a correlation coefficient of 0.998.
Acknowledgement
The Authors wish to acknowledge the Lord God Almighty for the grace and for making this work a huge success. The moral support and encouragement towards realizing the objectives of the study from Chief and Mrs. J. O. Igboke, are acknowledged. The authors would like to thank Professor J.C Agunwamba , Dr. C. C Nnaji of the Department of Civil Engineering, University of Nigeria, Nsukka for the their valuable comments during this study and the preparation of this paper. A big thanks to all the staff of Sanitary Engineering Laboratory for assisting me in the course of carrying out some of the experiments. Finally, I wish to acknowledge the support and encouragement I got from my Departmental Staff in the Federal Ministry of Environment, Abuja, They include: Engr. E.J Ekanem, (Fmr. Head, Flood Monitoring and Control), Mr. U.T Egwuatu and Engineers: M. Kopada, Subuloye, Iheanacho amongst others.
REFERENCES
Ademiluyi, J.O, Onwe, J.I., 2018. Use of the Concept of Ive,s Filterability Number to Determine the Effects of Vacuum Filtration Process. Nigerian Journal of Technology. Vol.37. No.2, pp.548-555. Available at http://www.nijotech.com/http://dx.doi.org/10.4314/njt.v3 7i2.35
Ademiluyi, J.O. 1984. Filtration Equation for Compressible Sludge at Constant Vacuum Pressure. Ph.D. Thesis in Civil Engineering at University of Nigeria: Nsukka, Nigeria.
Ademiluyi, J.O. 1987. Development in constant vacuum cake filtration Theory. Proceedings of the Engineering section of the Science Association of Nigeria Journal. Vol. 6 and 7.
Ademiluyi, J.O., Arimieari, L.W., 2012. Evaluating, the Specific Resistance of conditioned Sludge filtration as Natural drying bed. International Journal of Current Research. Vol. 4(2), pp.157-161.
Afangiden, C.B, Ademiluyi, J .O, Aniekan, S. 2014. Comparative Study of the LMT and FLMT Dimensional Equations for Sludge Filtration. Journal
of Engineering and Applied Sciences, Vol 9. pp
224-234.
Ajah, K.C. 2010. “Studies on the Cracking Time of Sludge Cakes” M. Engr Thesis, UNN.
Anazodo, U.G.N. 1974. Dimensional Equation for sludge filtration. Effluent and water Treatment Journal, P. 517. Andreoli, C.V, Barros, I.T, Costa, A.C.S. 2006. Evaluation of
the Sanitation of Sewage Sludge using anaerobic acid and alkaline treatments. J. Sanepar., 24: 61-69.
Brix, H., 2017. Sludge Dewatering and Mineralization in Sludge Treatment Reed Beds. MDPI Water, Vol. 9(160), available at www.mdpi.com/journal/ water,doi:10.3390/ w9030160.
Carman, P.C. 1934. A study of Mechanism of filtration Part 11. Journal of the society of Chemical Industry, Transactions communication. Vol. 53, No 6.1591-1651. Carman, P.C. 1938. Fundamental Principles of Industrial
Filtration. Transaction- Institution of Chemical
Engineers Vol 16, pp 168-188.
Dahlstrom, D.A. and Cornell, C.F. 1958. Improved sludge conditioning and Vacuum filtration. In Bilological Treatment of sewage and Industrial Wastes,Vol.2.Ed. Mc Cabe, J., and Eckenfelder, W. W. Reinhold Publishing Corporation, NY,. Pp292.
Dick, R.I. 1972. Sludge Treatment in Physiochemical Process for Water Quality Control. W. J Weber, Jr., (Ed.), Wiley Inter-science, New York.
Eze B.I and Ademiluyi J.O., 2014. FMTLxLyLz Dimensional Equation for Sludge Drying Bed. Nigerian Journal of
Technology, (NIJOTECH) Vol. 33. No. 3, pp 367-374.
Gale, R.S, Baskerville, R.C. 1970. Studies on the Vacuum Filtration of Sewage Sludges. Water Pollution Control. 514-536.
Garg, N. K., 2009. Multicriteria Assessment of Alternative Sludge Disposal Methods. Unpublished M.Sc. Thesis. Department of Mechanical Engineering, University of
Strathclyde. Available at:
http://www.esru.strath.ac.uk/Documents/MSc_2009/Garg .pdf (Accessed 21 December 2014)
Ghazy, M., Dockhorn, T., Dichtt, N. 2009. Sewage Management in Egypt: Current status and Perspectives towards a Sustainable Agricultural Use. International Journal of Environmental, Ecological, Geological and Mining Engineering, 3 (9).
Halff, A. 1952. An Investigation of the rotary vacuum filter cycles as applied to sewage sludges. Sewages and Industrial Wastes; Vol. 24, No.8, pp962-984.
Jones, B.R., 1956. Vacuum sludge filtration II: Prediction of Filter Performance. Sewage Industrial Wastes
Journal, Vol. 28, pp 1103-1115.
Olukanni, D. O., Agunwamba. J. C., Abalogu, R. U., 2013. Interaction between Suspended and Settled Solid Particles in Cassava Wastewater. The Scientific Research and Essays, 8 (10). pp 414-424.
Onosakponeme, O.R, Onyejekwe, S. C. 2014. Systematic Modelling of Sludge Filtration Process using Dimensional Analyses Technique. International Journal of Engineering Research and Applications, Vol.4, Issue 6(3), pp43-53.
Peter K, Donald 1975. Transport Phenomena applied to sludge dewatering. Journal of the A.S.C.E,
Environmental Eng. Div. Vol. 10, pp.927-985.
Pietila, K.A., Joubert, P.J. 1981. Examination of Process Parameters affecting Sludge Dewatering with a Diagram Filter Press. JWPCF Vol.53, No. 12, pp1708-1716. Randal, C.W., King, P.H., 2001. Activated Sludge Dewatering.
Journal of Water Pollution Control Federation, 102. Raput, R.K., 2004. A textbook of Fluid Mechanics and
hydroxide of machines” S. chand & Company Ltd. Ram Nagan New Delhi, 10055. pp 296-322.
Rebhun, M, Zall, N., Galil, N. 1989. Net Sludge Solids Yield as an Expression of Filterability for Conditioner Optimization. Journal of Water Pollution Control Fed,
Vol.61, No.1, pp52-54.
Svarovsky, L. 2000. Solid-Liquid Separation. Oxford: Butterworth-Heinemann.
Uggetti, E., Ferrer, I., Llorens, E., Garcia, J. 2010. Sludge treatment wetlands: A review on the state of the art. Bioresour. Technol. 101, pp2905–2912. (CrossRef) (PubMed)
Zall, J, Rebhun, M. 1987. Skeleton Builders for Conditioning Oily Sludge. Journal of Water Pollution Control Fed. 99, pp 699-740.