doi:10.4236/jwarp.2010.29097 Published Online September 2010 (http://www.SciRP.org/journal/jwarp)
Simultaneous Determination of Ten Endocrine Hormone
Disrupters in Water Using SPE/LC-(ESI)MS-MS
Marta Henriques1, Vítor Vale Cardoso2, Alexandre Mourão Rodrigues2, Elisabete Ferreira2, Maria João Benoliel2, Cristina M. M. Almeida1,3
1
Faculty of Pharmacy, Laboratory of Hidrology, Lisbon, Portugal 2
EPAL (Empresa Portuguesa das Águas Livres, S.A.), Laboratório Central da EPAL, Lisbon, Portugal 3
iMed (The Institute for Medicines and Pharmaceutical Sciences), Faculty of Pharmacy, Lisbon, Portugal E-mail: [email protected]
Received May 22, 2010; revised June 11,2010; accepted June 20,2010
Abstract
The aim of this study was developed and validated an analytical method based on liquid chromatography and tandem mass spectrometry after solid phase extraction to monitorizing ten endocrine hormone disrupters in Lisbon drinking water system. Natural and synthetic hormones (17-β-estradiol, ethinylestradiol, estriol, es-trone, progesterone, mestranol and diethylstilbestrol) and some industrial products (4-n-nonylphenol, 4-tert-octyl-phenol and bis4-tert-octyl-phenol A) were studied. Mass spectrometer detection parameters were optimized, such as the best conditions for the precursor ion formation, namely cone voltage, when applying negative and positive electrospray ionization, and also collision energy for MRM1 and MRM2 transitions. The best conditions of the solid phase extraction (SPE) using Waters Oasis HLB (6 mL, 200 mg) and Isolute C18 (EC) (6 ml, 1000 mg) were also optimized. The method was validated through the application of several statistical tests and the uncertainty estimation of the analytical assay. This method showed a very good linear range for all the studied analytes with determination coefficients (r2) between 0.9962 and 0.9999 and coefficients of variation
lower than 4%. There were no significant differences between recoveries obtained with the studied matrices, like groundwater, surface water and water for human consumption. In these matrices, the recovery values varied between 32 and 95%. The limits of method detection were between 0.28 and 22 ng/L. The validated method was applied for the analysis of water samples from the EPAL (Empresa Portuguesa das Águas Livres, S.A.) water supply system including tap water, spring water, groundwater, and river water. Some target compounds (bisphenol A, progesterone, 4-tert-octylphenol, and 4-n-nonylphenol) were found in trace amounts in analysed waters.
Keywords:Water Analysis, Endocrine Disruptors, Tandem Mass Spectrometry, Solid-phase Extraction, Un-certainty Evaluation
1. Introduction
An endocrine disrupter (ED) is an exogenous substance or mixture that alters function(s) of the endocrine system and consequently causes adverse health effects in an in-tact organism, or its progeny, or (sub)populations [1].
The main evidence suggesting that exposure to envi-ronmental chemicals can lead to disruption of endocrine function was first reported in the 1950s, specially in the Great Lakes region (2) and comes from changes seen in a number of wildlife species (molluscs, crustacean, fish, reptiles, birds and mammals) in various parts of the
world [2,3]. Their effect on wildlife is well documented and includes the feminization of male foetuses, repro-ductive disfunctions, behavioral changes and develop-ment problems [2,3]. There is also some limited evidence in humans that adverse endocrine-mediated effects have followed either intentional or accidental exposure to high levels of particular chemicals. The main example of an endocrine disrupter in humans is diethylstilbestrol (DES) [4-7].
and increase in subfertility [10-14], changes in sex ratio [15,16], puberty disorders and higher incidence of cryp-torchidism and hypospadias [9,12,15,17-19].
Chemicals with hormonal activity, that is, potential endocrine disrupters, include synthetic compounds and natural hormones. Synthetic compounds include a wide variety of products, like pharmaceutical products (in-cluding synthetic hormones), pesticides (for example,
DDT, dieldrin, lindane and atrazine), industrial products (for example, polychlorinated biphenyl, phthalates,
bisphenol A and alkylphenols, such as 4-n-nonylphenol and octylphenol) and their treatment by-products (for example, dioxin and furane) [20]. Some of these indus-trial products are used in food packaging material, as plasticizers, in water pipes, in water reservoirs as coat-ings, in personal care products, and in cleaning and dis-infecting chemical products.
Regarding natural hormones, they can occur in water due to the natural process of excretion in all species of mammals. Domestic and industrial effluents are the most significant input of these substances in the aquatic envi-ronment and these compounds and their metabolites are constantly excreted into the sewers environment and continue to accumulate in the environment. The large variety of compounds with effective or potential endo-crine disruptor activity, the diversity of environmental matrices where they can occur, their physical and chemical properties (high to moderate polarity) and the usually low concentrations require an accurate and effi-cient monitoring of these endocrine disruptors in water sources and water for human consumption Liquid- chro-matography coupled to tandem mass spectrometry (LC-MS/MS) is being applied with success to the analy-sis of these compounds [21-26].
However, the analysis of endocrine disruptors in sev-eral types of water matrices still require some prelimi-nary sample preparation technique, which is frequently one of the most critical steps in the analytical process. Sample preparation techniques have been largely devel-oped and this allow having the possibility to choose among various efficient techniques, less time consuming and with the advantage of reducing the use of higher volumes of organic solvents. Solid-phase extraction (SPE) is a well-established technique routinely used for the extraction/concentration of these target compounds as well for removing interfering matrices components be-fore chromatographic analysis [25, 27]. The versatility of this technique, due to the variety of solid phases avail-able, is another advantage of this technique.
The aim of this work was to optimize and validate a solid-phase extraction procedure combined with liquid chromatography coupled to tandem mass spectrometry detection with an electrospray ionization source (SPE
/LC-(ESI)MS-MS) for the determination of seven natural and synthetic hormones (17-β-estradiol, 17- -ethinyles-tradiol, estriol, estrone, progesterone, mestranol and di-ethylstilbestrol) and three industrial products (4-n-non-ylphenol, 4-tert-octylphenol and bisphenol A).
The selection criteria for the analytical methodology were based on the characteristics of the target com-pounds (medium to high polarity) and also on the trace levels (down to the ng/L level in surface waters and even lower in ground and drinking waters) expected on the environmental matrices [25-27]. Several detection pa-rameters were optimized in the mass spectrometer for each endocrine disruptor studied, such as the best condi-tions for the precursor ion formation, namely cone volt-age, when applying negative and positive electrospray ionization mode. Two transitions were also established, one for quantification (MRM1) and one for qualification (MRM2), after optimization of the triple quadrupole conditions. The selection of two transitions ensures a high degree of selectivity and additional sensitivity to quantify trace levels of organic compounds in water samples.
Several conditions of the SPE were also tested, namely different elution solvents and sorbents as well as sorbent drying conditions, sample flow rate and the eluate con-centration step.
The SPE/LC-(ESI)MS-MS was validated through the application of several statistical methods which allow defining the linear range, working ranges, and the method detection limits (MDL). Simultaneously, preci-sion and matrix effect of the analytical assay were stud-ied for the target compounds, according to the require-ments of Council Directive 98/83/EC (European Com-mission, 1998) and International Procedures.
The European publications on this subject appeared first in the early-to-mid 2000s but the studies haven’t included the same endocrine disrupters, different types of waters (natural, residual and water for human consump-tion) were analysed, different degree of precision and accuracy were applied for the same instrumental analysis, and in same cases the requirements of optimisation and validation were not applied properly.
This study has the opportunity to prove the utility and reliability of the solid-phase extraction method with liq-uid chromatography coupled to tandem mass spectrome-try in detail for the analysis of natural and synthetic hormones, and phenolic compounds in natural (surface or groundwater) and tap waters, which are the main pre-occupation of the water distributors.
in-cluded, which allowed an estimation of the expanded uncertainties for the target compounds.
Many factors affect the distribution of the target com-pounds in different countries or even in different regions of the same country. This work focused on risk contami-nants in the Lisbon drinking water supply. For this rea-son, this method has been applied to the analysis of sev-eral samples taken from the main intakes of water (sur-face and groundwater) used for production of water for human consumption, and from different sampling points of the drinking water distribution system (piping, nets and reservoirs) of EPAL (Empresa Portuguesa das Águas Livres, S.A.). EPAL is the largest drinking water supply company in Portugal and is responsible for the produc-tion and supply of drinking water to the city of Lisbon, as well as for the bulk supply to 25 municipalities of the greater Lisbon area, comprising around 2.6 million peo-ple. The production system includes two Water Treat-ment Plants (Asseiceira and Vale da Pedra) which ab-stract and treat surface water from Castelo de Bode res-ervoir and Tagus River, respectively. It also has a spring water source in Olhos de Água and 19 groundwater sources. This study allowed us to characterize the quality of dif-ferent types of water samples, concerning the level of the studied target compounds.
This study was the first research performed to evaluate the occurrence probability of these target compounds in raw water and water supply system of EPAL, and also at national level.
2. Materials and Methods
2.1. Reagents and Standard Solutions
Individual standards of bisphenol A, diethylstilbestrol, 17-β-estradiol, estriol, estrone, 4-n-nonylphenol, 4-tert- octylphenol, mestranol and progesterone were obtained from Tokyo Chemical Industry (TCI) (Boerenveldseweg, Belgium). 17--ethinylestradiol was obtained from Sigma-Al-drich (Gillingham, United Kingdom). The purity of these standards was analytical grade.
Stock solutions with 200 mg/L of each compound were prepared in a solution of methanol:water (8:2) + 5 mM of ammonium acetate. These solutions were stored at 5 ± 3˚C in the absence of light.
A standard mixture solution was prepared by diluting each individual standard solution in methanol:water (4:6) + 5 mM of ammonium acetate, with a concentration of 4 mg/L. Appropriate amounts of the standard mixture solu-tion were diluted in methanol:water (4:6) + 5 mM of ammonium acetate in order to get final concentrations between 1 and 400 µg/L.
Methanol (liquid chromatography grade, 99.9%) and
ammonium acetate (pro analysis grade, 98%) were pro-vided by Merck (Darmstadt, Germany).
Reagent water was obtained using a Milli-Q device, Academic A-10 model, from Millipore (Molsheim, France).
Acetone (99.5%, gas chromatography grade), methyl tert-butyl ether (gas chromatography grade), n-hexane (gas chromatography grade) all from Merck (Darmstadt, Germany), and dichloromethane (99.8%, High Perform-ance Liquid Chromatography grade) from Sigma-Aldrich (Gillingham, United Kingdom) were used for SPE opti-mization.
Sodium thiosulphate (Na2S2O3) (99.5%, pro analysis grade) for samples pre-treatment was provided by Merck (Darmstadt, Germany).
2.2. Chromatographic and Mass Spectrometry Analysis
The chromatographic analysis was performed on a Wa-ters Alliance 2795 Separations Module HPLC, equipped with a quaternary pump, automatic injector and a ther-mostated column compartment (Waters, Mildford, MA, USA) connected to a Quattro micro API triple quadru-pole mass spectrometer, equipped with a Z-spray elec-trospray ionization source, from Micromass (Manchester, UK). The software used for instrumental control and data acquisition was Masslynx version 4.0, 2002 from Mi-cromass. The chromatographic separation was performed with an Atlantis dC18 (2.1 × 150 mm, 5 m) column from Waters (Mildford, MA, USA), using methanol:water (1:9) + 5 mM of ammonium acetate (solvent A) and metha-nol:water (9:1) + 5 mM of ammonium acetate (solvent B) as mobile phase. The separation was performed using a gradient profile. The gradient elution conditions were: 100% solvent A (0-15 min), and change to 100% solvent B (15-20 min). At the end of the chromatogram, the mo-bile phase was changed to its initial composition and the column was equilibrated.
The injection volume was 50 µL, the flow rate was kept constant at 0.3 mL/min under gradient conditions and the temperature of the column compartment was set to 30˚C.
Triple quadrupole operating conditions were studied in order to work in multiple reaction monitoring mode (MRM).
were kept constant, such as: extractor voltage of 2 V, multiplier voltage 650 V, radio frequency (RF) lens at 0.5 V, source temperature at 150˚C and desolvation temperature at 350˚C. The settings of cone voltage varied between 5 and 90 V, in order to get a higher intensity for the signal of the precursor ion. Nitrogen was used as nebulizing, desolvation and cone gas. The flow rate of the desolvation gas was set to 350 L/h and that of the cone gas was set to 60 L/h. Argon was used as collision gas with a pressure of 2.83 × 10⁻³ mbar. For this purpose, the stock solution of each compound at a concentration around 200 mg/L was injected directly by infusion, in product ion scan.
Two transitions were also established, one for quanti-fication (MRM1) and one for qualiquanti-fication (MRM2), after optimization of the triple quadrupole conditions, using argon as collision gas. This operation was per-formed through injection of an individual solution of each target compound, with a concentration around 4 mg/L, in the Rheodyne valve of the mass spectrometer, working in MRM mode, and varying the settings of col-lision energy between 5 and 90 eV, in order to get a higher fragmentation of the precursor ion and choose two products ions with better signal intensity.
2.3. SPE Procedure
A Caliper Life Sciences equipment, model Autotrace (Hopkinton, USA) was used as the automated SPE sys-tem. This technique was applied to 500 mL of sample volume. This instrument is equipped with an adjustable nitrogen stream to dry the cartridge before elution. After elution the organic extracts were concentrated to 0.5 mL in a Turbovap evaporation system (Zymark), under a nitrogen stream.
Operational conditions of the SPE were also tested, namely different elution solvents and cartridges as well as cartridge drying conditions under nitrogen stream, sample flow rate, and also the eluate concentration in the Turbovap.
The optimization was performed using 500 mL of re-agent water spiked at the following concentrations: bisphenol A, 17-β-estradiol, 4-tert-octylphenol, 17--ethinylestradiol and mestranol at 0.40 µg L-1, proge sterone at 0.12 µg/L, estriol and 4-n-nonylphenol at 0.10 µg/L, and diethyl-stilbestrol and estrone at 0.040 µg/L (SPE optimization solution).
Two different cartridges, namely Waters Oasis HLB (6 mL, 200 mg) and Isolute C18 (EC) (6 ml, 1000 mg) were used in the optimization. These cartridges were washed with 3 mL methanol:acetone (3:2), followed by 6 mL of methanol and 6 mL of reagent water. Afterwards,
water sample was drawn into the cartridge connected to a vacuum system at the speed of 30 mL/min and then, the cartridge was ashing with 3 mL of reagent water. After washing, the cartridge was dried under vacuum for 5 min and eluted with 8 mL (4 + 2 +2 mL) of methanol: ace-tone (3:2). The elution was evaporated to 0.25 mL on Turbovap (40˚C/0.2 bar) and reconstituted in metha-nol:water (4:6) + 5 mM of ammonium acetate to a final volume of 0.5 mL for further LC-(ESI)MS-MS analysis.
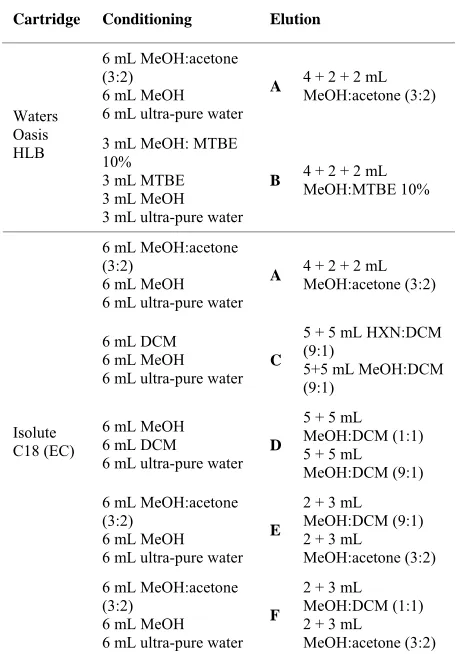
[image:4.595.309.538.362.689.2]There are many different cartridges commercially available. The chosen cartridges are the best choice as there are many reports analyzing endogenous and syn-thetic endocrine disrupting chemicals using those car-tridges. The several elution solutions used are shown in
Table 1.
Other SPE operational conditions such as the sample flow rate (10 and 30 mL/min) and the cartridge drying time (0, 5, 10 min) were also tested.
The effect of the temperature bath in the recovery of the analytes was also optimized in the concentration step of the SPE eluate in the Turbovap system. With this
Table 1. Cartridges and solvents used in SPE optimization.
Cartridge Conditioning Elution
6 mL MeOH:acetone (3:2)
6 mL MeOH 6 mL ultra-pure water
A 4 + 2 + 2 mL MeOH:acetone (3:2)
Waters Oasis
HLB 3 mL MeOH: MTBE 10% 3 mL MTBE 3 mL MeOH 3 mL ultra-pure water
B 4 + 2 + 2 mL MeOH:MTBE 10%
6 mL MeOH:acetone (3:2)
6 mL MeOH 6 mL ultra-pure water
A 4 + 2 + 2 mL MeOH:acetone (3:2)
6 mL DCM 6 mL MeOH
6 mL ultra-pure water C
5 + 5 mL HXN:DCM (9:1)
5+5 mL MeOH:DCM (9:1)
6 mL MeOH 6 mL DCM
6 mL ultra-pure water D
5 + 5 mL MeOH:DCM (1:1) 5 + 5 mL MeOH:DCM (9:1)
6 mL MeOH:acetone (3:2)
6 mL MeOH 6 mL ultra-pure water
E
2 + 3 mL MeOH:DCM (9:1) 2 + 3 mL
MeOH:acetone (3:2) Isolute
C18 (EC)
6 mL MeOH:acetone (3:2)
6 mL MeOH 6 mL ultra-pure water
F
2 + 3 mL MeOH:DCM (1:1) 2 + 3 mL
MeOH:acetone (3:2)
purpose, a volume of 8 mL of the SPE optimization solu-tion (diluted in methanol) was concentrated to 0.5 mL in the Turbovap at different temperatures 35, 40, 45 and 50˚C. The concentrated solutions were analysed by LC-(ESI)MS-MS method under optimized conditions.
The analytical procedure can be complicated by the contamination of the extract with bisphenol A released from reagents (organic solvents) and plastic materials used in the process. If possible, all plastic materials and/or accessories from sampling and SPE equipment should be replaced by glass materials. Blank samples were regularly tested for contamination control.
The C18 cartridge was used in recovery studies using groundwater, surface and drinking water, and in real wa-ter samples analysis.
2.4. Validation Studies
The chromatographic linear range was studied by analy- sis of twenty one solutions containing all standards at different concentration levels (1 to 400 µg/L - prelimnary working range). For some compounds the range did not start at 1 µg/L due to the absence of MRM2 transition chromatographic signal. Calibration curves were plotted for each compound, applying least-square regression analysis [28], for measured signal values of MRM1 tran-sition.
Linear range was evaluated by the determination coef- ficient and coefficient of variation of the method, and after application of several statistical tests, such as re- sidual analysis, RIKILT test [29] and Mandel test [28]. The initial results were treated in order to comply with all the defined limits for each statistical test. The final choice of the working range was made after uncertainty evaluation of the calibration [30-32]. For the majority of the compounds the linear dynamic range were around five in order to get a lower component of uncertainty related to the calibration curve, and a more accurate quantification.
Taking into account the linear range, twenty fortified solutions were prepared with all target compounds at the lower (ten solutions) and higher (ten solutions) concen-tration values. These solutions were analyzed to evaluate the repeatability of the LC-(ESI)MS-MS method. The intermediate precision was also evaluated after analysis of one concentration level of the working range for each compound, on different days.
Matrix effects were evaluated in recovery studies us- ing groundwater, surface and drinking water samples fortified at the following concentrations: 17--ethinyles- tradiol at 80 ng/L; mestranol at 60 ng/L; 17-β-estradiol and 4-tert-octylphenol at 40 ng/L; estriol, bisphenol A, and progesterone at 30 ng/L; 4-n-nonylphenol at 20 ng/L,
estrone at 8 ng/L; and diethylstilbestrol at 2 ng/L. In or-der to eliminate interference from chlorine, drinking wa-ter samples were pre-treated with 0.1 g/L of sodium thi-osulphate.
The main uncertainty sources of the method were identified and quantified, followed by the determination of the combined standard uncertainty (Uc) using a Gauss
propagation model. The last step for uncertainty evalua-tion of an analytical result was the calculaevalua-tion of the ex-panded uncertainty (U), using a coverage factor k = 2
(95% of confidence level). Two of the approaches to calculate uncertainty are the “bottom-up” and the “top- down” methods. The “bottom-up” method was proposed by ISO (International Organization for Standardization) in order to quantify uncertainty in physical measure-ments and was subsequently adopted by Eurachem. On the other hand, the “top-down” method uses validation data and data from proficiency test schemes to estimate the uncertainty of the method [30-32].
Using the “bottom-up” approach we combined the components of uncertainty related with the calibration curve (Ucurve), the standard solution preparation
(Ustandard), and the intermediate precision of the
method (Uprecision). The standard uncertainty of the
standard solution preparation is the combination of other components of uncertainty like the purity of the com-mercial standard, the volumetric and the weight meas-urements. The combined uncertainty (Uc) was calculated
using the following equation:
2 2 2
c precision standard curve
u u u u (1)
Using the ‘top-down’ method we combined the com- ponents of uncertainty related with the variability (Uvar)
and with the accuracy (Uaccuracy) of the recovery stud-
ies (matrix effect). In this approach the combined uncer- tainty was calculated using another equation:
2 2
var
c accuracy
u u u (2)
The expanded uncertainty (U) was obtained by
multi-plying Uc by a coverage factor (k) using the following
equation:
k c
U U (3)
In general, the value of the coverage factor k is chosen on the basis of the desired level of confidence to be asso- ciated with the interval defined by Uc. Typically, k is in
the range 2 to 3. When the normal distribution applies and Uc is a reliable estimate of the standard deviation, U
= 2Uc (that is, k = 2) defines an interval having a level of
confidence of approximately 95%, and U = 3Uc (that is,
2.5. Water Samples
Between May and June 2008, 43 samples were collected from several sampling points of the EPAL water supply system and also from the main raw water sources of this company (Tagus River, Castelo de Bode reservoir, and Alenquer well). These samples were collected in 1000 mL glass amber bottles with caps and stored at 5 ± 3˚C. For drinking water samples, containing residual chlorine, the sample was pre-treated in water sampling field with 0.1 g/L of sodium thiosulphate to eliminate any chlorine oxidation reaction and subsequent measurement reduce any type of interferences in the final results. The samples were analyzed within 48 hours after sampling. The opti-mized and validated SPE/LC-(ESI)MS-MS was applied to analyze these samples. The water samples were ana-lyzing during the 48 hours after sampling.
Identification of the analytes was performed by com-paring the retention times and the MS signals in the sam-ples with those obtained using standard solutions. Fur-thermore, for LC-(ESI)MS-MS analysis, the ratio of the two precursor-product ion transitions was compared to
that observed for standard analytes (using a tolerance of ± 15%). Quantification was carried out by calculating the response of quantitative ion. Concentrations were deter-mined using linear regression analysis of the peak area.
3. Results and Discussion
3.1. Tandem Mass Spectrometry Conditions
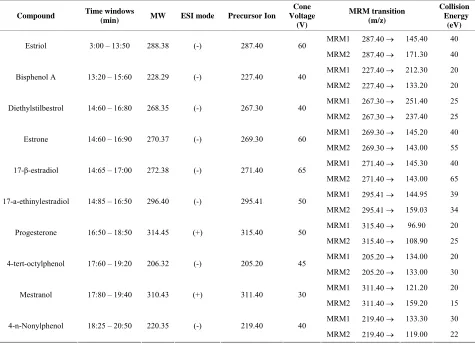
For the majority of the target compounds, the negative ionization was better than positive ionization. Only pro- gesterone and mestranol have a better result using posi- tive ionization mode (Table 2).
The selection of the optimum value of cone voltage for each compound is very important as it has a significant impact in the precursor ion selectivity and subsequently in the signal intensity.
[image:6.595.63.538.374.718.2]The selection of two transitions ensures a high degree of selectivity as well as additional sensitivity to quantify analyte trace levels in water samples. Therefore, it is important to obtain two product ions in good conditions. The optimization of triple quadrupole was performed by
Table 2. Optimized conditions of the massspectrometer for each target compound.
Compound Time windows
(min) MW ESI mode Precursor Ion
Cone Voltage
(V)
MRM transition (m/z)
Collision Energy (eV)
MRM1 287.40 145.40 40
Estriol 3:00 – 13:50 288.38 (-) 287.40 60
MRM2 287.40 171.30 40
MRM1 227.40 212.30 20
Bisphenol A 13:20 – 15:60 228.29 (-) 227.40 40
MRM2 227.40 133.20 20
MRM1 267.30 251.40 25
Diethylstilbestrol 14:60 – 16:80 268.35 (-) 267.30 40
MRM2 267.30 237.40 25
MRM1 269.30 145.20 40
Estrone 14:60 – 16:90 270.37 (-) 269.30 60
MRM2 269.30 143.00 55
MRM1 271.40 145.30 40
17-β-estradiol 14:65 – 17:00 272.38 (-) 271.40 65
MRM2 271.40 143.00 65
MRM1 295.41 144.95 39
17-a-ethinylestradiol 14:85 – 16:50 296.40 (-) 295.41 50
MRM2 295.41 159.03 34
MRM1 315.40 96.90 20
Progesterone 16:50 – 18:50 314.45 (+) 315.40 50
MRM2 315.40 108.90 25
MRM1 205.20 134.00 20
4-tert-octylphenol 17:60 – 19:20 206.32 (-) 205.20 45
MRM2 205.20 133.00 30
MRM1 311.40 121.20 20
Mestranol 17:80 – 19:40 310.43 (+) 311.40 30
MRM2 311.40 159.20 15
MRM1 219.40 133.30 30
4-n-Nonylphenol 18:25 – 20:50 220.35 (-) 219.40 40
MRM2 219.40 119.00 22
varying collision energy with the objective to select two characteristic product ions (transition MRM1 and MRM2) formed after fragmentation of each precursor ion. The precursor ion fragmentation and the formation of several product ions are influenced by the collision energy. The selection of the product ions is based mainly on the best signal intensity. Transition MRM1 is used for quantifica- tion and transition MRM2 for qualification/confirmation, using the ratio MRM1/MRM2.
The best collision energy value was optimized for transitions MRM1 and MRM2 within the same com- pound. The selected conditions of the triple quadrupole mass spectrometer for the analysis of each target com- pound are resumed on Table 2.
The elution order of each endocrine disruptor in the chromatographic column was established after optimization of the liquid chromatograph conditions.
3.2. Linear and Working Range
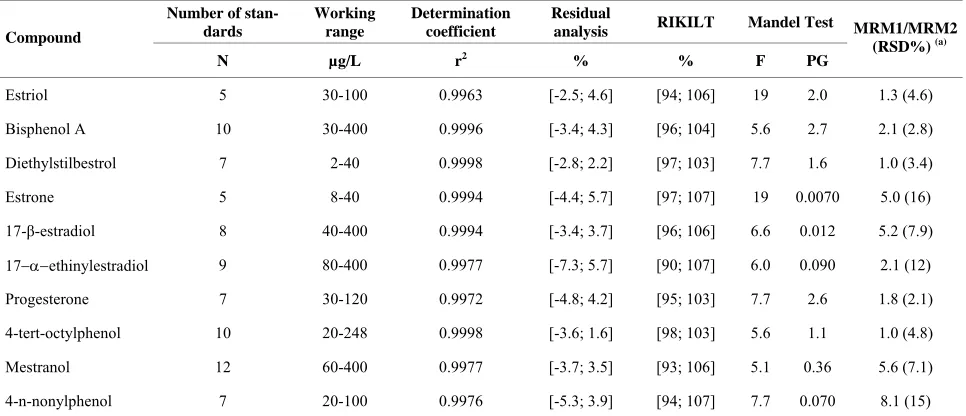
All procedures used for chromatographic method valida-tion requires the study of linear range. Several statistic tests were applied to the initial obtained results in the preliminary defined working range in order to comply with the acceptance criteria of each statistical test [28-29]. One of the established requirements for linear range is r2 0.995, which was not accomplished by 4-n-nonylphenol, estrone and diethylstilbestrol. Another statistic test used is the Mandel test (ISO 8466-1) applied in the linear range [28]. The PG values obtained were higher than the F tabulated values for estriol,
diethylstil-bestrol, estrone, progesterone and 4-n-nonylphenol, for the corresponding degrees of freedom. The coefficient of variation of the method was ≤ 10% for all the com-pounds, varying from 0.030 to 3.7%. The residual analy-sis of the calibration data also showed that some com-pounds, like estriol, bisphenol A, diethylstilbestrol, es-trone, 17-β-estradiol, progesterone, 4-tert-octylphenol and 4-n-nonylphenol, did not comply with the criteria of ± 10%. The application of the RIKILT Test [29], with ac-ceptance criteria of 10%, to the same data, showed that mestranol was the only compound to fulfill this require-ment.
For this reason, the linear ranges were narrowed until all data met the specified criteria of the statistical tests. The value of the component of uncertainty of the calibra-tion was also taken into account in the definicalibra-tion of the final working range. At the end, r2 varied between 0.9962 and 0.9999; the coefficient of variation was be-tween 0.01 and 3.96%; the residual analysis of the cali-bration data had a minimum value of –10% and a maxi-mum of 7.6%; the RIKILT values varied between 90 and 114%, and all of the PG values were lower than the F tabulated values, for the corresponding degrees of free-dom (Table 3).
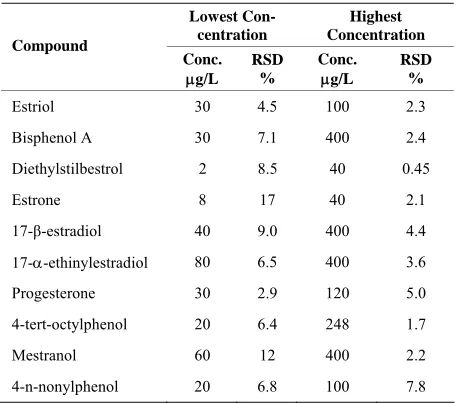
[image:7.595.57.540.487.695.2]The results of the precision study of the chroma-tographic method using repeatability conditions had RSDs between 2.1 and 17% for the lowest concentration level of the analytes, and between 0.45 and 7.8% for the highest concentration level. The obtained results are pre-sented in Table 4.
Table 3. Chromatographic working range, determination coefficient, MRM1/MRM2 ratio and Mandel test obtained for each endocrine disruptor by LC-(ESI)MS-MS.
Number of stan-dards
Working range
Determination coefficient
Residual
analysis RIKILT Mandel Test
Compound
N µg/L r2 % % F PG
MRM1/MRM2 (RSD%) (a)
Estriol 5 30-100 0.9963 [-2.5; 4.6] [94; 106] 19 2.0 1.3 (4.6)
Bisphenol A 10 30-400 0.9996 [-3.4; 4.3] [96; 104] 5.6 2.7 2.1 (2.8)
Diethylstilbestrol 7 2-40 0.9998 [-2.8; 2.2] [97; 103] 7.7 1.6 1.0 (3.4)
Estrone 5 8-40 0.9994 [-4.4; 5.7] [97; 107] 19 0.0070 5.0 (16)
17-β-estradiol 8 40-400 0.9994 [-3.4; 3.7] [96; 106] 6.6 0.012 5.2 (7.9)
17ethinylestradiol 9 80-400 0.9977 [-7.3; 5.7] [90; 107] 6.0 0.090 2.1 (12)
Progesterone 7 30-120 0.9972 [-4.8; 4.2] [95; 103] 7.7 2.6 1.8 (2.1)
4-tert-octylphenol 10 20-248 0.9998 [-3.6; 1.6] [98; 103] 5.6 1.1 1.0 (4.8)
Mestranol 12 60-400 0.9977 [-3.7; 3.5] [93; 106] 5.1 0.36 5.6 (7.1)
4-n-nonylphenol 7 20-100 0.9976 [-5.3; 3.9] [94; 107] 7.7 0.070 8.1 (15)
(a) Average MRM1/MRM2 ratio and relative standard deviation for each target compound, measured after analysis of several standard solutions with different concentrations covering the linearity range.
Table 4. Precision of LC-(ESI)MS-MS method under re-peatability conditions (n = 10).
Lowest Con-centration
Highest Concentration Compound
Conc. g/L
RSD %
Conc. g/L
RSD %
Estriol 30 4.5 100 2.3
Bisphenol A 30 7.1 400 2.4
Diethylstilbestrol 2 8.5 40 0.45
Estrone 8 17 40 2.1
17-β-estradiol 40 9.0 400 4.4
17--ethinylestradiol 80 6.5 400 3.6
Progesterone 30 2.9 120 5.0
4-tert-octylphenol 20 6.4 248 1.7
Mestranol 60 12 400 2.2
4-n-nonylphenol 20 6.8 100 7.8
Mestranol (12%) and estrone (17%) showed a RSD > 10% for the lowest concentration level. Nevertheless, for the majority of the compounds the RSD at the highest concentration level was lower than 5%. These results showed that the chromatographic method had a good precision
3.3. Solid-Phase Extraction
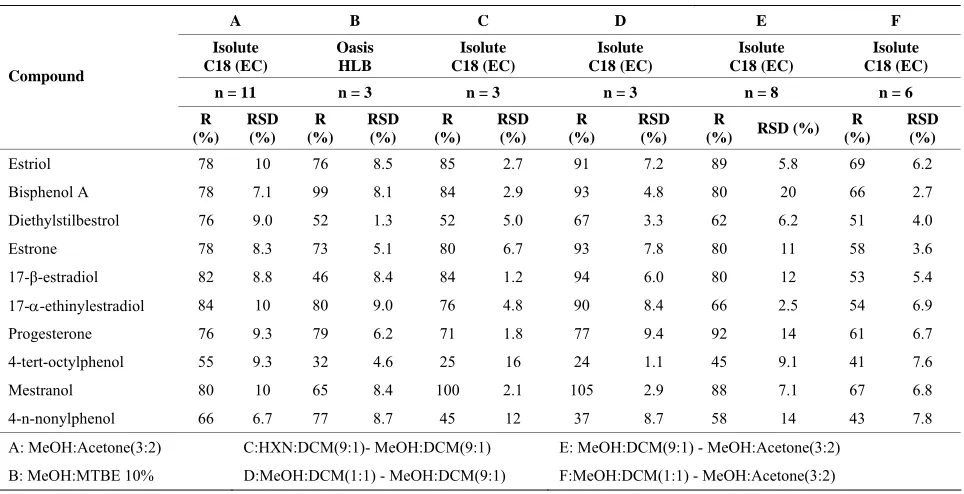
Several recovery studies were performed to evaluate the efficiency of each cartridge in the analysis of the target compounds. The percentage recoveries were between 55-94% and 54-90% for Isolute C18 (EC) and Oasis HLB, respectively. The relative standard deviation was between 7.3-14% and 2.8-12% for Isolute C18 (EC) and Oasis HLB, respectively.
The analysis of variance (ANOVA) showed that statisti-cally there were no significant differences between the percentage recoveries obtained for all compounds, (pvalue = 0.30) using both cartridges. Table 5 lists the results for
the two tested cartridges.
The selection of the best elution system for each SPE cartridge was also performed, applying the methodologies described on Table 1. The results obtained for each one
are shown in Table 6.
The eluent systems B, C, D and F were immediately rejected due to the lower recoveries of the analytes. On the other hand, the eluent system E gave some problems when applied afterwards in routine, like random decrease of the recovery rates of some analytes, due to the forma-tion of two different phases (MeOH has medium polarity and DCM has low polarity) in the eluate. Consequently, the eluent system A [MeOH:Acetone (3:2)] was selected
for the SPE technique applied to the studied compounds. This system allowed acceptable recovery rates between 55 and 84% with good coefficients of variation (≤ 10%). The sample flow rates (10 and 30 mL/min) and cartridge drying conditions (0, 5, 10 min) were also tested in order to identify the best SPE conditions. The sample flow rate of 30 mL/min was the optimum value chosen because there are no significant differences between the results obtained using the above sample flow rate. Moreover, the use of a flow rate of 30 mL/minalso reduces the time of analysis.
Cartridge drying conditions of 5 minutes with on-line nitrogen stream leads to a lower loss for phenolic com-pounds. This operation step revealed to be critical to the efficiency of the subsequent eluate evaporation step in the Turbovap system. If the cartridge drying step is not completed, the time for concentration in Turbovap could reach about 5 hours which leads to a higher nitrogen stream exposure of the eluate during the concentration step, and subsequently to a higher loss of the compounds, especially the phenolic compounds. On the other hand, if the cartridge drying time is higher, the eluate concentration step in the Turbovap system can be reduced, but the longer exposure to the nitrogen stream in the SPE equipment can also lead to a loss of compounds. Al-though most of the target compounds have very low volatility, they can be purged by nitrogen stream and therefore be lost.
[image:8.595.304.542.507.716.2]The bath temperature of the Turbovap system is an-other adjustable parameter which needs to be set. The temperature is inversely proportional to the time needed for the concentration of the SPE eluate, and a higher time
Table 5. Comparison of recoveries (R%) of the target hor-mone disrupters of spiked reagent water by use Isolute C18 (EC) and Oasis HLB cartridges (n = 5).
Isolute C18
(EC) Oasis HLB
Compound Concentration
ng/L R
(%) RSD
(%) R (%)
RSD (%)
Estriol 40 82 7.3 81 2.8
Bisphenol A 40 94 9.6 90 7.7
Diethylstilbestrol 2 76 8.9 78 6.9
Estrone 2 84 9.9 82 5.6
17-β-estradiol 80 88 8.3 82 4.9
17--ethinylestradiol 100 84 10 80 5.8
Progesterone 60 83 14 79 8.5
4-tert-octylphenol 40 55 9.3 54 5.4
Mestranol 100 82 8.0 68 8.0
implies a higher exposure to nitrogen stream. The appli-cation of ANOVA to the obtained results indicated that there were no significantly differences (pvalue = 0.81) between them. However, the higher recoveries occurred at 40˚C and 45˚C and the worst results were at 35˚C and 50˚C (higher losses for all the compounds). The optimum water bath temperature of 40˚C was chosen to prevent possible losses of the analytes.
3.4. Matrix Effect and Method Detection Limits (MDL)
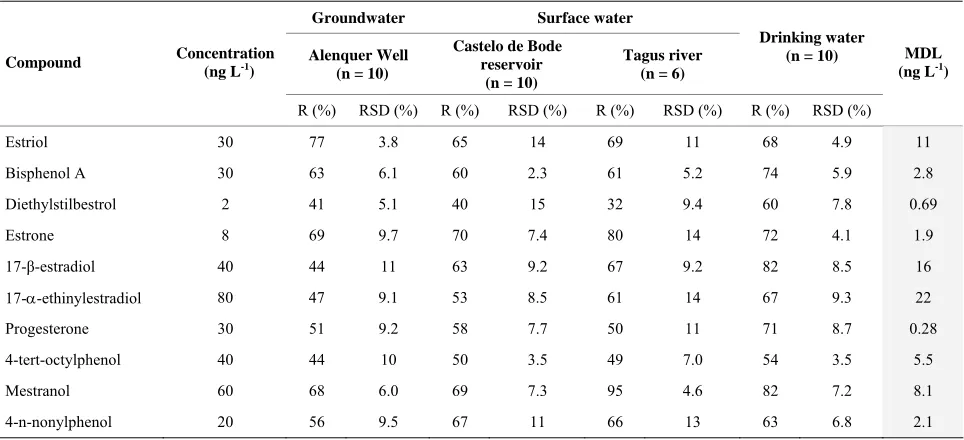
The analysis of sample blanks showed no interferences coming from the studied matrices (surface water, groundwater and drinking water), assuring the high se-lectivity of the analytical method. Table 7 showed the
percentage recovery results in different matrices after fortification, and also the variability associated with the entire analytical method. The obtained recovery values were between 32 and 95%. Despite the lower recoveries of some analytes, the variability of the data was satisfac-tory with a RSD ≤ 15%. There were no significant dif-ferences between the recoveries obtained for the ana-lyzed water matrices. Homogeneity of variance analysis was applied to the best (drinking water) and the worst (Tagus river) recovery data from different matrices. However, the results showed that there was not any sig- nificant differences between the recoveries obtained for these matrices. All obtained test values (PG) were lower than the tabulated value of Fisher/Snedecor distribution (F (9, 5, 95%) = 10.2) [28].
The method detection limits (MDL) of the SPE/LC- (ESI)MS-MS were between 0.28 and 22 ng/L for pro-gesterone and 17--ethinylestradiol, respectively (Table 7). The MDLs were calculated as three times the
sig-nal-to-noise level of the chromatographic signal obtained after analysis of the different spiked sample extracts.
These limits are equal or slightly higher than those found by other authors [34-37] because the demands set by validation criteria defined by accreditation process because EPAL laboratory is accredited. For these reason, all routine procedures must be validated according na-tional and internana-tional procedures [28-33].
3.5. Uncertainty study
Two approaches were considered for estimation of ex-panded uncertainty of the analytical method. The first one used the “bottom-up” approach (Method 1) and the second one the “top-bottom” approach (Method 2). Ta-ble 8 presents the results concerning these two
ap-proaches.
[image:9.595.58.540.476.723.2]The estimation of uncertainty by method 1 was be-tween 18 and 26%, while by method 2 were bebe-tween 15 and 30%. In method 1 the calibration component of un-certainty had the highest contribution to the expanded uncertainty. In method 2 there were no statistical signifi-cant differences between the contribution of the variabil-ity component and the accuracy component to the ex-panded uncertainty (pvalue = 0.60).
Table 6. Percent recoveries (R%) and relative standard deviation (RSD) for both elution solvents tested.
A B C D E F
Isolute C18 (EC)
Oasis HLB
Isolute C18 (EC)
Isolute C18 (EC)
Isolute C18 (EC)
Isolute C18 (EC)
n = 11 n = 3 n = 3 n = 3 n = 8 n = 6
Compound
R (%)
RSD (%)
R (%)
RSD (%)
R (%)
RSD (%)
R (%)
RSD (%)
R
(%) RSD (%) R (%)
RSD (%)
Estriol 78 10 76 8.5 85 2.7 91 7.2 89 5.8 69 6.2
Bisphenol A 78 7.1 99 8.1 84 2.9 93 4.8 80 20 66 2.7
Diethylstilbestrol 76 9.0 52 1.3 52 5.0 67 3.3 62 6.2 51 4.0
Estrone 78 8.3 73 5.1 80 6.7 93 7.8 80 11 58 3.6
17-β-estradiol 82 8.8 46 8.4 84 1.2 94 6.0 80 12 53 5.4
17--ethinylestradiol 84 10 80 9.0 76 4.8 90 8.4 66 2.5 54 6.9
Progesterone 76 9.3 79 6.2 71 1.8 77 9.4 92 14 61 6.7
4-tert-octylphenol 55 9.3 32 4.6 25 16 24 1.1 45 9.1 41 7.6
Mestranol 80 10 65 8.4 100 2.1 105 2.9 88 7.1 67 6.8
4-n-nonylphenol 66 6.7 77 8.7 45 12 37 8.7 58 14 43 7.8
Table 7. Recovery (R%), relative standard deviation (RSD%) and method detection limits (MDL) for each endocrine disrup-tor and each analyzed matrix by SPE/LC-(ESI)MS-MS.
Groundwater Surface water
Alenquer Well (n = 10)
Castelo de Bode reservoir
(n = 10)
Tagus river (n = 6)
Drinking water (n = 10)
Compound Concentration
(ng L-1)
R (%) RSD (%) R (%) RSD (%) R (%) RSD (%) R (%) RSD (%)
MDL (ng L-1)
Estriol 30 77 3.8 65 14 69 11 68 4.9 11
Bisphenol A 30 63 6.1 60 2.3 61 5.2 74 5.9 2.8
Diethylstilbestrol 2 41 5.1 40 15 32 9.4 60 7.8 0.69
Estrone 8 69 9.7 70 7.4 80 14 72 4.1 1.9
17-β-estradiol 40 44 11 63 9.2 67 9.2 82 8.5 16
17--ethinylestradiol 80 47 9.1 53 8.5 61 14 67 9.3 22
Progesterone 30 51 9.2 58 7.7 50 11 71 8.7 0.28
4-tert-octylphenol 40 44 10 50 3.5 49 7.0 54 3.5 5.5
Mestranol 60 68 6.0 69 7.3 95 4.6 82 7.2 8.1
4-n-nonylphenol 20 56 9.5 67 11 66 13 63 6.8 2.1
Table 8. Individual uncertainty components and respective expanded uncertainty estimated in the analysis of the target compounds by SPE-LC-ESI-MS/MS.
Method 1 Method 2
Compound Ucurve
(%)
Ustandard (%)
Uprecision
(%) U(C) (%)
Uvar (%)
Uaccuracy (%) U(C) (%)
Estriol 8.4 4.9 2.4 20 5.2 5.5 15
Bisphenol A 11 4.9 2.4 25 5.2 5.5 15
Diethylstilbestrol 11 4.7 4.4 26 6.5 4.5 16
Estrone 8.6 4.7 2.6 20 5.4 7.2 18
17-β-estradiol 9.7 4.8 5.3 24 7.2 10 25
17--ethinylestradiol 7.9 4.7 4.1 20 6.2 6.5 18
Progesterone 7.2 4.6 3.3 18 5.7 5.6 16
4-tert-octylphenol 6.6 5.9 2.7 18 7.0 2.4 15
Mestranol 9.9 4.7 3.2 23 5.7 14 30
4-n-nonylphenol 9.9 6.0 3.0 24 6.7 5.2 17
The value of the uncertainty component of the calibra-tion data of each compound was also used to define its working range. In some cases (estriol and estrone) the number of standards (N) was reduced from 21 to 5 after applying linear range tests and uncertainty estimation (Table 3).
3.6. Sample Analysis
The validated SPE/LC-(ESI)MS-MS method was suc-cessfully applied to the analysis of the ten endocrine hormone disrupters in 43 samples from EPAL water sup-ply system including tap water, spring water, groundwater,
and river water. Estriol, estrone, 17--ethinylestradiol, diethylstilbestrol, mestranol and 17-β-estradiol were not detected in all samples. Some raw waters showed trace amounts of bisphenol A (six samples, 14% positive ples), progesterone (fourty samples, 93% positive sam-ples), 4-tert-octylphenol (three samples, 6.9% positive samples), and 4-n-nonylphenol (six samples, 14% posi-tive samples). The concentrations in these posiposi-tive sam-ples were between 2.9-4.8 ng/L for bisphenol A, 0.45-1.8 ng/L for progesterone, 27-29 ng/L for 4-tert-octylphenol, and 2.7-5.7 for 4-n-nonylphenol.
[image:10.595.57.542.363.558.2]and the estimated concentration levels had a high degree of uncertainty. On the other hand, they are also far from the proposal value of 0.1 g/L, established by the Drink-ing Water Directive for compounds without guideline values, taking into account the precautionary principle. This study should be continued with a large number of samples collected in the same sampling points, during a longer time schedule.
4. Conclusions
Tandem mass spectrometry provides a highest degree of certainty in the identification of target compounds. The selection of specific fragment ions for multiple reaction monitoring (MRM) in tandem MS, with optimization of cone voltage and collision energy, guarantee a high de-gree of selectivity as well as additional sensitivity to quantify trace levels of endocrine disruptors.
The optimized and validated SPE/LC-(ESI)MS-MS method allowed the detection and quantification of all the studied compounds in water samples: estriol, bisphenol A, diethylstilbestrol, estrone, 17-β-estradiol, 17- -ethinyles-tradiol, progesterone, mestranol, 4-tert-octylphenol and 4 -n-nonylphenol.
The LC-(ESI)MS-MS method showed a very good linear range for all the studied analytes with determination coefficients (r2) between 0.9963 and 0.9998, and coeffi-cients of variation lower than 4%. The method showed a good precision under repeatability conditions for the majority of the compounds. The confirmation criteria set for each compound (MRM1/MRM2 ratio) showed a good stability over the defined linear range with a RSD ≤
15%.
Both Isolute C18 (EC) and Oasis HLB cartridges can be used in the SPE procedure because there is no sig-nificant difference between them on the recovery tests performed. The best results were obtained using metha-nol:acetone (3:2) elution system, and a sample flow rate of 30 mL/min. The recovery data obtained in several water matrices were between 32 and 77%. Despite the lower recoveries of some analytes, the variability of the data had a RSD ≤ 15%. The method detection limits (MDL) of the SPE/LC-(ESI)MS-MS were between 0.28 and 22 ng/L The estimation of uncertainty was between 15 and 30%, and the calibration component had the highest contribution for the expanded uncertainty.
Estriol, estrone, 17--ethinylestradiol, mestranol, di-ethylstilbestrol, and 17-β-estradiol were not detected in all samples. Some raw waters showed trace amounts of bisphenol A, progesterone, 4-tert-octylphenol, and 4-n- nonylphenol. On the other hand, they are also far from the proposal value of 0.1 g/L, established by the Drink-ing Water Directive for compounds without guideline
values, taking into account the precautionary principle. As a final conclusion we state that the optimized and validated method can be implemented in routine for the studied endocrine disruptor compounds monitoring with a high level of confidence.
5. References
[1] Commission of the European Communities, “On Imple-mentation of the Community Strategy for Endocrine Dis-rupters-A Range of Substances Suspected of Interfering with the Hormone Systems of Humans and Wildlife,” Progress Report, COM 706, 1999.
[2] T. Colborn, D. Dumanoski and J. P. Myers, “Our Stolen Future,” 1st Edition, Plume, Penguin Books USA inc, New York, Copyright, 1996.
[3] M. Gilbertson, T. Kubiak, J. Ludwig and G. Fox, “Great Lakes Embryo Mortality, Edema, and Deformities Syn-drome (GLEMEDS) in Colonial Fish-eating Birds: Simi-larity to Chick-edema Disease,” Journal of Toxicology and Environmental Health, Vol. 33, No. 4, 1991, pp. 455- 520.
[4] R. Meyers, “D.E.S., the Bitter Pill,” 1st Editon, Seaview /Putnam, New York, 1983.
[5] A. L. Herbst, H. Ulfelder and D.C. Poskanzer, “Adeno-carcinoma of the Vagina. Association of Maternal Stilbe-strol Therapy with Tumor Appearance in Young Women,” The New England Journal of Medicine,Vol. 284, No. 15, 1971, pp. 878-881.
[6] H. Klip, J. Verloop, J. D. van Gool, M. E. T. A. Koster, C. W. Burger and F. E. van Leeuwen, “Hypospadias in Sons of Women Exposed to Diethylstilbestrol in Utero: A Co-hort Study,” The Lancet, Vol. 359, No. 9312, 2002, pp. 1081-1082.
[7] M. M. Brouwers, W. F. J. Feitz, et al, “Hypospadias: A Transgenerational Effect of Diethylstilbestrol?” Human Reproduction,Vol. 21, No. 3, 2006, pp. 666-669. [8] R. L. Cooper and R. J. Kavlock, “Endocrine Disruptors
and Reproductive Development: A Weight-of-evidence Overview,” Journal of Endocrinology,Vol. 152, No. 2, 1997, pp. 159-166.
[9] O. Per-Erik, B. Bertil, B. Brunström, H. Hakansson and E. Klasson-Wehler, “Endocrine Disrupting Substances Im-pairment of Reproduction and Development,” Swedish Environmental Protection Agency, Stockholm, Sweden, 1998.
[10] D. S. Irvine, “Falling Sperm Quality,” British Medical Journal,Vol. 309, No. 6952, 1994, p. 476.
[11] L. Multigner and O. A. Luc, “Secular Variations in Sperm Quality: Fact or Science Fiction?” Cadernos de Saúde Pública,Vol. 18, No. 2, 2002, pp. 403-412.
[13] J. W. Dallinga, E. J. C. Moonen, J. C. M. Dumoulin, J. L. Evers, L. H. Johannes, J. P. M. Geraedts and J. C. S. Kleinjans.Decreased, “Human Semen Quality and Or-ganochlorine Compounds in Blood,” Human Reproduc-tion, Vol. 17, No. 8, 2002, pp. 1973-1979.
[14] P. Mocarelli, P. M. Gerthoux, D. G. Patterson, S. Milani, G. Limonta, M. Bertona, S. Signorini, P. Tramacere, L. Colombo, C. Crespi, P. Brambilla, C. Sarto, V. Carreri, E. J. Sampson, W. E. Turner and L. L. Needham, “Dioxin Exposure, from Infancy through Puberty, Produces Endocrine Disruption and Affects Human Semen Quality,” Environmental Health Perspectives, Vol. 116, No. 1, 2008, pp. 70-77. [15] M. Rittler and E. E. Castilla, “Endocrine Disruptors and
Congenital Anomalies,” Cadernos de Saúde Pública Pública, Vol. 18, No. 2, 2002, pp. 421-428.
[16] J. R. Barret, “Shift in the Sexes: Are Endocrine Disrup-tors Changing Birth Ratios?” Environmental Health Per-spectives, Vol. 115, No. 6, 2007, pp. 941-946.
[17] M. H. Hsieh, B. N. Breyer, M. L. Eisenberg and L. S. Baskin, “Associations among Hypospadias, Cryptorchidism, Anogenital Distance, and Endocrine Disruption,” Current Urology Reports,Vol. 9, No. 2, 2008, pp. 137-142. [18] F. H. Pierik, A. Burdorf, J. A. Deddens, R. E. Juttmann
and R. F. A. Weber, “Maternal and Paternal Risk Factors for Cryptorchidism and Hypospadias: A Case-control Study in Newborn Boys,” Environmental Health Perspectives, Vol. 112, No. 15, 2004, pp. 1570-1576.
[19] L. J. Paulozzi, “International Trends in Rates of Hypo-spadias and Cryptorchidism,” Environmental Health Per-spectives, Vol. 107, No. 4, 1999, pp. 297-302.
[20] Commission of the European Communities, “On Imple-mentation of the Community Strategy for Endocrine Dis-rupters - a Range of Substances Suspected of Interfering with the Hormone Systems of Humans and Wildlife,” Communication from the Commission to the European Parliament and Council, Progress Report, COM 262, 2001.
[21] E. S. Chiron and R. J. Analusis, “Determination of Non-ionic Polyethoxylate Surfactants in Wastewater and Sludge Samples of Sewage Treatment Plants by Liquid Chroma-tography-Mass Spectrometry,” EDP Sciences, Vol. 28, No. 6, 2000, pp. 535-542.
[22] T. Isobe, H. Shiraihi, M. Yasuda, A. Shinoda, H. Suzuki and M. Morita, “Determination of Estrogens and their Conjugates in Water Using Solid-Phase Extraction Fol-lowed by Liquid Chromatography-Tandem Mass Spec-trometry,” Journal of Chromatography A,Vol. 984, No. 2, 2003, pp. 195-202.
[23] M. S. Díaz-Cruz, M. L. Alda, R. López and D. Barceló, “Determination of Estrogens and Progestrogens by Mass Spectrometric Techniques (GC/MS, LC/MS and LC/MS /MS),” Journal of Mass Spectrometry, Vol. 38, No. 9, 2003, pp. 917-923.
[24] Y. K. K. Koh, T. Y. Chiu, A. Boobis, E. Cartmell, J. N. Lester, and M. D. Schrimshaw, “Determination of Steroid Estrogens in Wastewater by High Performance Liquid Chromatography-Tandem Mass Spectrometry,” Journal
of Chromatography A, Vol. 1173, No. 1-2, 2007, pp. 81-87.
[25] M. J. L. Alda, S. Díaz -Cruz, M. Petrović and D. Barceló, “Analysis of Selected Emerging Pollutants (Steroid Sex Hormones, Drugs and Alkilphenolic Surfactants) in the Aquatic Environmental by LC-MS and LC-MS-MS,” Jour-nal of Chromatography A, Vol. 1000, No. 1-2, 2003, pp 503- 526.
[26] B. Nicholson, “Organic Chemical Issues in Wastewater Quality: A Review of Current Analytical Methods,” Aus-tralian Water Quality Centre for Water Quality and Treat-ment, September 2006.
[27] S. D. Richardson and T. A. Ternes, “Water Analysis: Emerging Contaminants and Current Issues,” Analytical Chemistry,Vol. 77, No. 12, 2005, pp. 3807-3838. [28] International Standard Organization, “ISO 8466-1 Water
quality-Calibration and Evaluation of Analytical Methods and Estimation of Performance Characteristics; Part I: Statistical Evaluation of the Linear Calibration Function,” 1990.
[29] J. M. P. van Trijp and A. H. Roos, “RIKILT-DLO, Model for the Calculation of Calibration Curves,” RIKILT report 91.02, Wageningen, Netherlands, 1991.
[30] EURACHEM/CITAC, “Quantifying Uncertainty in Ana-lytical Measurement,” Guide CG 4, 2nd Edition, 2000. [31] VAM Project 3.2.1., “Development and Harmonization
of Measurement Uncertainty Principles,” Part (d): Proto-col for Uncertainty Evaluation from Validation Data, 2000. [32] EA (European co-operation for Accreditation), “EA
Guide-lines on the Expression of Uncertainty in Quantitative Testing,” EA-4/16, 2003.
[33] D. T. Burns, K Danzer and A. Townsend, “Use of the Terms Recovery and Apparent Recovery in Analytical Procedures (IUPAC Recommendations 2002),” Pure and Applied Chemistry,Vol. 74, No. 11, 2002, pp. 2201-2205. [34] L. Sun, W. Yong, X. Chu and J. Lin, “Simultaneous
De-termination of 15 Steroidal Oral Contraceptives in Water Using Solid-Phase Disk Extraction Followed by High Performance Liquid Chromatography-Tandem Mass Spec-trometry,” Journal of Chromatography A,Vol. 1216, No. 28, 2009, pp. 5416-5423.
[35] D. Matějíčeka and V. Kubáň, “High Performance Liquid Chromatography/Ion-Trap Mass Spectrometry for Sepa-ration and Simultaneous Determination of Ethynylestra-diol, Gestodene, Levonorgestrel, Cyproterone Acetate and Desogestrel,” Analytica Chimica Acta,Vol. 588, No. 2, 2007, pp. 304-315.
[36] D. P. Grover, Z. L. Zhang, J. W. Readman and J. L. Zhou, “A Comparison of Three Analytical Techniques for the Measurement of Steroidal Estrogens in Environmental Water Sample,” Talanta,Vol. 78, No. 3, 2009, pp. 1204 -1210.