Munich Personal RePEc Archive
Monitoring agricultural plantations with
remote sensing imagery
Slave, Camelia and Rotman, Anca
University of Agronomic Sciences and Veterinary Medicine
-Bucharest Romania, University of Agronomic Sciences and
Veterinary Medicine - Bucharest Romania
21 November 2013
Online at
https://mpra.ub.uni-muenchen.de/53495/
MONITORING AGRICULTURAL PLANTATIONS WITH REMOTE
SENSING IMAGERY
SLAVE CAMELIA1, ROTMAN ANCA2
1
Slave Camelia sef lucrari dr. ing, University of Agronomic Sciences and Veterinary Medicine - Bucharest Romania,
Abstract. In agriculture, a major benefit of satellite registrations crop is forecast problem by following up the development of crops in certain phenological stages. Then, the registration of pest attacks made possible intervention in the early stages of this phenomenon. Development of the Earth's surface registration techniques in different spectral bands, specialized for certain components of the environment. Such as those of the last LANDSAT and SPOT satellites were able to follow some aspects of forestry and agriculture.
Key words: Agriculture, agricultural plantations remote sensing spectral bands, vegetation
INTRODUCTION
Remote sensing refers to the registration activities, observation and perception of distant objects or phenomena. In remote sensing, sensors are not in direct contact with objects or phenomena observed. Electromagnetic radiation is normally used as a carrier of information in remote sensing. Product sensing system is usually an image representing the scene observed. An important step is the image analysis and interpretation necessary to extract useful information from the image. In a narrower sense, remote sensing refers to the science and technology necessary for acquiring information about the Earth's surface (eg, the earth's surface, oceans and atmosphere) using sensors on board of vehicles (airplanes or balloons) or space (satellites and space shuttles) platforms. Depending on the scope, remote sensing can be divided into
(1) Remote sensing satellite (when used satellite platforms)
(2) Photography and Photogrammetry (when used to capture visible light images) (3) Thermal remote sensing (when used infrared spectrum)
(4) Remote sensing using radar (when using microwaves), and
(5) LIDAR (laser pulses are used when they are transmitted to the ground and the distance between the sensor and the ground is measured based on the return time of each pulse).
MATERIALS AND METHODS
The spectral response of vegetation is identified by the reflectance’s spectral curve and depends on the health of the vegetation. The curve has an allure that has maximum and minimum. Minima in the visible portion of the spectrum are due to the chlorophyll pigments in leaves. The chlorophyll absorbs energy in the wavelength range 0 45 to 0.67 μm. Therefore vegetation health is perceived as green. Vegetation absorbs blue and red rays and reflects them on the green.
The reflection is performed in the wavelengths’ band of nearby infrared from 0.69 to 1.3
μm. During this time plants reflects 40-50% of the incident energy on them. Foliage reflectance is
achieved in the range of 0.7 to 1.3 mm, and depends on the internal structure of the leaf. Measurement of reflectance in this range allows the identification of different species of plants. The absorption and reflectance of plants in the visible and infrared range depend on the chlorophyll content, the amount of water and surface morphology of the plant. These spectral properties are expressed in the form of vegetation proper index VNIR (visible and near infrared (Fig. 1). Spectral
reflectance of vegetation increases very steeply as the wavelength increases above 0.7 μm and 0.75
μm. This change in spectral reflectance is called feeding edge (Elachi and Jakob, 2006).
camellia_slave@yahoo.com
2
Fig 1 Spectral reflectance curve by wave length
Landsat satellite images. Landsat 7 functions from the date of 15th April 1999. The Satellite’s system of sensors and images’ quality were improved. On this mission were kept the bands:1 to 4.5 and 7.
The ETM (Enhaced Thamatic Mapper) included a new panchromatic band with a greater width, containing a part of the visible spectrum (especially green and red) and near-infrared part of. Its spatial resolution is 14.25 inches (15cm). Thermal infrared 6 band was improved by doubling the spatial resolution from 58.5 cm to 60 cm.
All of these eight images are converted into 8-bit system, this allows a number of digital processing operations. The system also includes the "dual-mode solar calibration" in line with internal calibration lamp. This led to a radiometric calibration accurate to 5%.
Satellite sources are qualitative. By making a combination of Panharped type using the panchromatic and a combination of three bands. These have as results natural colours or false colours images with a resolution of 15 cm (Lillesand, 2004).
The geographic interpretation of Landsat satellite sources.I have chosen Mostistea Valley micro- region.
Mostiştea Valley micro- region is located in the north- western region of the Calarasi
district, near by Ilfov district.
The geographic coordinates of the area are given by Tamadaul Mare village which is the northern part of the micro- region, located on the 26 ° 57 'west longitude meridian and the 44° 47' parallel and the southernmost part determined by Frăsinet village coordinates, located on the 26 ° 44 'west longitude meridian and the 44 ° 15' north latitude parallel. The micro- region is about halfway between Bucharest and Calarasi
The facts were obtained from USGS for year 1991 and 2011
The interpretation involves the analysis of spectral bands individually and compared to
Mostiştea micro - region.
The purpose is related to the choice of the relevant tape and combination bands in the overall analysis of the landscape or the level of components such as plants, water, settlements and land use.
Fig 2 Combination of bands 123 in year 1991
Fig 3. Combination of bands 123 in year 2011
The combination of 2-3-4 bands. This combination involves the placing nearby infrared. The nearby infrared vegetation response can provide information about the status of vegetation.
The image’s analysis provides information on: - the separation of green fields land without vegetation (Fig. 4 and Fig 5 )
[image:4.595.171.477.558.747.2]There is seen clearly delimited the lake area as an effect of the nearby infrared band in which the radiation is absorbed by water to surface.
Fig 5 Combination of bands 234 in year 2011
The combination of 4-5-3 bands. In this combination we have two infrared bands, and in this combination the spectral signature of vegetation is strong.
[image:5.595.180.479.346.757.2]The combination of the signal is the best for identifying the vegetation (Fig 6 and Fig 7).
Fig 6 Combination of bands 453 in year 2011
[image:6.595.136.511.223.491.2]
Histogram The expression of the image’s contrast results from the distribution percentage method of the spectral value or the numbers assigned to the pixels, which form the spectral satellite image for each spectral band separately. The graphic is represented by a rectangular axes system, which characterizes each spectral band image level. Histogram analysis shows a maximum concentration of dark pixels in the image.An image has a unique histogram but the reverse is not true in general since a histogram contains only radiometric and no spatial information. A point of some importance is that the histogram can be viewed as a discrete probability distribution since the relative height of a particular bar, normalised by the total number of pixels in the image segment, and indicates the chance of finding a pixel with that particular brightness value somewhere in the image (J. Richards and Xiuping Jia, 2006).
Fig 8. Histogram RGB 123
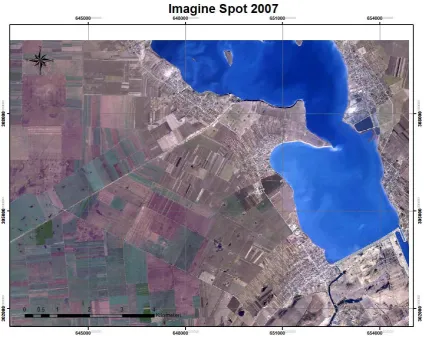
Also for comparison the Mostistea surface we used and satellite remote sensing imagery provided by SPOT in 2007 (Fig.9).
The current plans for SPOT – 5 envision the replacement of the SPOT – 4 HRVIR systems with high resolution (HRG) instruments. These system are designed to provide higher spatial resolution ( 5m, instead of 10m ) in panchromatic mode; 10m ( instead of 20m ) resolution in the green, red, and near – IR bands; with 20 m resolution maintained in the mid – IR band due to limitations imposed by the geometry of CCD sensors used in this band. The panchromatic band used will return to the spectral range employed in SPOT – 1, 2 and 3 (0.51 – 0.73 μm ). Also envisioned is the provision of resolution panchromatic data by combining two 5-m resolution images shifted along track and sampled every 2.5 m.
It is also envisioned that SPOT – 5 will incorporate envisioned that SOPT – 5 will incorporate a high resolution stereoscopic (HRS) instrument. The HRS instrument will incorporate fore and aft stereo data collection and facilitate the preparation of digital evaluation models (DEMs) at a resolution of 10 m on a global
Fig 9. Spot images in 2007 Mostistea area
CONCLUSIONS
Within this framework were three combinations of spectral bands analyzed for studying vegetation. The optimal combination was made so that the spectral behaviour of the studied area. The bands choice must be made depending of the soil type, climate and vegetation.
In combination 1-2-3 is observed that the separation of vegetation is very poor.
In combination 2-3-4 is the infrared band and we can separate green fields depending on the type of vegetation which covering the land.
Combination 4-5-7 shows the best combination of existing differences in the studied crops in area Mostistea.
To study terrestrial phenomena are chosen images under favourable weather conditions without clouds. The visual interception for assessing crops status is more difficult than intercepting the visual image of the crops type. It is also difficult to identify the different effects produced by disease, insects’ attacks, and nutrient deficiency because of the variety of plants, plant maturity, the rate of planting soil or various colors. Some problems of interpretation may arise after dry periods, so interpretation must be done on images that are acquired in a short time after rain.
REFERANCES
1. Elachi C and Zyl van Jakob (2006) – Introduction to the physics and techniques of remote sensing – 2th edition , John Wiley and Sons New York
2. Richards John and Xiuping Jia (2006)- Remote Sensing Digital Image Analysis – An Introduction 4th edition, Edition Springer Berlin