ISSN Online: 2333-9721 ISSN Print: 2333-9705
Rainfall Variations Due to Twin Typhoons
over Northwest Pacific Ocean
Shengyan Yu, M. V. Subrahmanyam
*School of Marine Science and Technology, Zhejiang Ocean University, Zhoushan, China
Abstract
This paper focuses on the investigation of the rainfall variations due to twin typhoons Saola and Damrey occurred in 2012 over Northwest Pacific Ocean (NPO). Genesis and landfall of the two typhoons are on the same day, howev-er the track and rainfall area are diffhowev-erent. We have chosen the Global Preci-pitation Climatology Project (GPCP) and Tropical Rainfall Measuring Mis-sion (TRMM) data for this analysis. The results are illustrating as follows: ty-phoon Saola produced higher rainfall than tyty-phoon Damery. The rainfall pat-tern of typhoon Saola having sufficient affect typhoon Damrey rainfall over the ocean, however after landfall produced rainfall over the land. Comparison of two rainfall data sets revealing that TRMM data is better for identifying heavy rainfall due to typhoon.
Subject Areas
Atmospheric Sciences, Oceanology
Keywords
Twin Typhoons, Rainfall, GPCP, TRMM
1. Introduction
Typhoons interact with both the upper ocean and the atmosphere. Typhoons are gaining their energy from the warmer ocean surface and also lose its tempera-ture that can continue for long after the typhoon has passed. Typhoons obtain-ing their energy from the warmer ocean and tend to be more intensify if the heat and moisture fluxes from the ocean are greater (Emanuel 1999 [1]). Typhoon is characterized by intense cyclonic winds, well organized deep convection, and spiral rain bands. Several typhoons that strike East Asia every year suffer severe damages. Torrential rainfall associated with typhoon landfall is one of the most How to cite this paper: Yu, S.Y. and Su-
brahmanyam, M.V. (2017) Rainfall Varia- tions Due to Twin Typhoons over North- west Pacific Ocean. Open Access Library Journal, 4: e3638.
https://doi.org/10.4236/oalib.1103638
Received: April 26, 2017 Accepted: May 16, 2017 Published: May 19, 2017
Copyright © 2017 by authors and Open Access Library Inc.
This work is licensed under the Creative Commons Attribution International License (CC BY 4.0).
tors such as storm size, track, translation speed, etc. Rainfall associated with a typhoon can become asymmetric after landfall. The asymmetry in rainfall can be attributed to the impact of the typhoon moving speed (Shapiro 1983 [9]; Bender 1997 [10]; Frank and Ritchie 1999 [11]; Lonfat et al., 2004 [12]). The regions that suffer most are largely determined by the distribution of rainfall in typhoons. The spatial distribution of rainfall in a landfalling TC is of particular interest to meteorologists because of its relevance to the rainfall forecasts. Typhoon landfall precipitation forecast is completed due to the coastal and inland topography and land surface and boundary layer conditions (Lin et al., 2001b [13]; Li et al., 2003
[14]).
Previous studies explained the precipitation spatial distribution is complex and different for each of the typhoons (e.g., Miller 1958 [15]; Marks 1985 [16]; Burpee and Black 1989 [17]). Convection process will increase with the warmer temperature and heavy rainfall can influence sea surface temperature through the rain sensible heat flux. The stabilizing effect of rain can weaken the cold wake but that the associated sensible flux only marginally influences typhoon induced cooling (Jacob and Koblinsky 2007 [18]). Rainfall intensity increases with its typhoon intensity (Prat and Nelson 2012 [19]). Typhoons have stronger convective rain in the inner core as well as stronger stratiform rain in the rain band than cloud clusters (Chie and Yukari 2008 [20]). The heaviest precipitation generally took place in the front of a typhoon and the asymmetry in typhoon precipitation varies with typhoon intensity (Lonfat et al., 2004 [12]), more asymmetric precipitation distribution occurs for weaker the typhoon. In some cases, strongest precipitation occurred in the rear of a typhoon (Blackwell 2000
available. It is found that rainfall distribution of one typhoon influences another typhoon, discussed in further sections.
2. Data and Methodology
In the NPO, twin typhoons occur rarely at the same time, however occurrence of continuous typhoons is obvious. The information of typhoons for this study, such as the typhoon track, intensity and central pressure data can be obtained from JTWC (Chu et al., 2002 [25]). The rainfall pattern due to twin typhoons was studied by using GPCP and TRMM rainfall data. The daily GPCP rainfall data was used for this study with the resolution of 1˚ × 1˚. The World Climate Research Program (WRCP) and GEWEX, provides community global precipita-tion products with satellite and gauge informaprecipita-tion at the daily (Huffman et al., 2001 [26]), pentad (Xie et al., 2003 [27]), and monthly (Adler et al., 2003a [28]) time scales. This data is indicative of daily rainfall spatially and temporally. GPCP data can used to analyze rainfall pattern due to twin typhoons. Another rainfall data used for this study was TRMM daily rainfall data which is a joint mission between NASA and the Japan Aerospace Exploration (JAXA) Agency to study rainfall for weather and climate research. TRMM carried 5 instruments: a 3-sensor rainfall suite (PR, TMI, VIRS) and 2 related instruments (LIS and CERES). TRMM-Multi-satellite Precipitation Analysis (TMPA) 3B42 precipita-tion product version 7 (Huffman et al., 2007 [29]) has spatial resolution of 0.25˚ grid and covering the globe from 50˚S to 50˚N. TRMM 3B42 has been frequently used for TC rainfall analysis regionally and globally (Shepherd et al., 2007 [30]; Jiang et al., 2012 [31]; Prat et al., 2012 [19]). GPCP and TRMM rainfall data have been used to analyse the variations in rainfall over the study area which are plot-ted during two ttyphoonspassage. In this case, we linearly interpolaplot-ted the GPCP and TRMM data over 3 regions on each typhoon track.
The aim of this work is to find out the rainfall variations during the typhoons and influence in rainfall distribution changes due to two typhoons compared with different data sets. The data for this study GPCP and TRMM data have been chosen over the study area (10˚N - 40˚N; 110˚E - 150˚E). We have chosen 3 regions over each typhoon track represent typical areas considered for rainfall variation to compare the variations between two data sets.
3. General Descriptions of Typhoons Saola and Damrey
Figure 1. Typhoon tracks of “Saola” and “Damrey”. The colors within the circles indi-cating central pressure of the typhoon at each position from JTWC. a1, b1, c1, a2, b2, c2 are six regions. The domain of a1 is 23˚N - 27˚N; 146˚E - 150˚E; The domain of a2 is 10˚N - 14˚N; 128˚E - 132˚E; The domain of b1 is 30˚N - 34˚N; 123˚E - 127˚E; The do-main of b2 is 20˚N - 24˚N; 122˚E - 126˚E; The dodo-main of c1 is 32˚N - 36˚N; 118˚E - 122˚E; The domain of c2 is 24˚N - 28˚N; 118˚E - 122˚E.
which formed as low pressure systems with an initial strength of 1004 hPa at 10.6˚N, 130˚E and the second one is Damrey formed over the NPO with an ini-tial strength of 1008 hPa at 24.7˚N, 148.8˚E. Both Saola and Damrey landed on the same day (3 August 2012) at different locations such as Fujian and Zhejiang provinces which happen very rarely. On 27 July 2012 typhoon Damrey and Saola genesis, received energy from the sea, produced heavy precipitation over the sea and cooled the sea surface. On 27 July, typhoon Saola moved slowly for a long time after genesis and moving north and west with complex moving processes. From 27 July to 1 August, the surface wind speeds gradually increased and reached the maximum 70 m/s leading to strong typhoon Saola at the location of 122.7˚E, 24.1˚N with the central pressure of 960 hPa. Typhoon Damrey with small size but moved faster than Saola. On 1 Aug, the intensity of typhoon Da-mrey enhanced from strong tropical storm to typhoon. On 2 Aug, the maximum wind speed near its core was 70 m/s at the location 122.8˚E; 33.5˚N with the central pressure of 965 hPa. After the faster movement of Darmery, the distance between Saola and Damery was less than 10 latitude distance for 1.5 days when the mutual rotations of binary typhoons were not obvious.
4. Results
4.1. Rainfall Variations Using GPCP Data and TRMM Data
1992 [32]; Emanuel 1986 [33]; Merrill 1988 [34]; Gray and Jacobson 1977 [35]; Steranka et al. 1984 [36]). Figure 2 shows the daily rainfall variations for the pe-riod from July 27 to August 4 using GPCP rainfall data and daily variations of TRMM rainfall data are illustrated in Figure 3. It can be seen from Figure 1 that two cyclones were generated in the northwestern Pacific Ocean at the same time. The generation positions of typhoon Saola and Damrey were at 10.6˚N, 130˚E and 24.7˚N, 148.8˚E respectively. Both typhoons brought rainfall at generated places (Figure 2 and Figure 3). When considering the GPCP data, the rainfall range of the Saola induced was higher than that of the Damrey, and typhoon Saola rainfall distribution mainly on the right side of the typhoon track. The cumulative rainfall due to Damrey was lower than that of Saola because the la-tent heat of the typhoon Saola was higher. Damrey passing over the latitude above 20˚N, the sea surface temperature is lower than that of the lower latitudes. In the high latitude region, the temperature gradient is large and if the mechani-cal disturbance of the typhoon happened, it is obvious that sea surface tempera-ture cooling trend occurred. In the lower latitude regain the temperatempera-ture gra-dient is weak, almost becoming an isothermal water layer. When the typhoon passed, the sea surface temperature cooling phenomenon is also not obvious. Compared to GPCP rainfall, the TRMM rainfall was indicating higher cumula-tive rainfall. The spatial range of GPCP data was higher than TRMM. Rainfall of
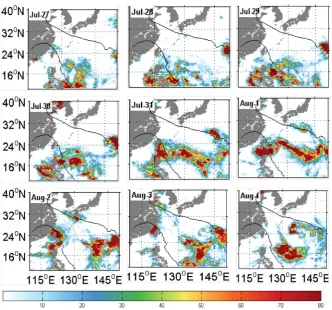
Figure 3. Variation of TRMM precipitation (mm/day) (color shading) on 27 July to 4 August 2012 during the passage of two typhoons Saola and Damrey. The two lines indi-cate the central pressure of the typhoon at each position along the best track.
of the Damrey track was different from the previous rainfall area. There were obvious two rainfall areas with higher intensity caused by Saola, one distributed in the Luzon Strait, Showing the shape of the triangle. At that time, there was no obvious sea temperature cooling phenomenon. The sea surface temperature and the latent heat of evaporation were relatively high, so it will contribute for rain-fall. The other area was at 125˚E - 145˚E, 16˚N - 24˚N, which was contributing for a large-scale rainfall phenomenon because the latent heat over the sea was higher than that of in the Luzon Strait. On 31st July, amount of TRMM rainfall was higher than GPCP. The amount of rainfall brought by Damrey became to increase and reached about 20 mm on 1st August, and spatial distribution main-ly confined to the right side of Damrey. Rainfall area caused by the Saola ap-peared in two circles; one distributed in the right side of Saola, the other was on the opposite side on 31th. On 1st August, one can clearly found that the ty-phoon-induced rainfall area in Figure 3 was smaller than Figure 2. The shape of rainfall distributed was strip-like in Figure 3, but the strength was higher than that in Figure 2. On 2nd August, after Typhoon Saola occurred cyclonic rota-tion, it landed at Taiwan Island. Substantial rainfall occurred over Taiwan Island and on the eastern side of Taiwan Island, the maximum rainfall reached to 80 mm/d. Figure 3 illustrated a small range of rainfall on the right side of the ty-phoon Saola’s track, however large rainfall occurred on the left side of the Saola. In Figure 2, when typhoon Saola passed through Taiwan Island, clearly indicat-ing that, typhoon Saola induced rainfall area was well-distributed on both sides of the typhoon’s path. On 3rd August, typhoon Saola and Damrey landed on the same day in Chinese mainland. After Saola landed, high-intensity rainfall hap-pened over the Taiwan Strait where the strongest rainfall during the period of typhoon’s passage was observed. At the same time, a small amount of rainfall happened in the Yellow Sea. There was also a rainfall of 40 mm/day in the area where the tropical cyclone was formed. Figure 3 demonstrated that the distribu-tion of rainfall in the Taiwan Strait was similar to that in Figure 2. The amount of TRMM rainfall was smaller than GPCP in coastal area and in other areas was larger than that of GPCP. On 4th August, when the two typhoons landed, the inland areas of rainfall happened, but in the Taiwan Strait, the rainfall reduced as indicated in Figure 2. Spatial distribution increased in the right side of the Typhoon Saola (125˚E - 140˚E, 10˚N - 18˚N). On 4th August, in Figure 3, the amount of rainfall on the left side of the Damrey track was larger than that in
Figure 2.
4.2. Comparisons between TRMM and GPCP
Figure 4 illustrate the daily rainfall variation for the three different regions ran-domly selected using GPCP and TRMM data respectively. Figure 4(a1) and
Figure 4. Variation of rainfall on 27 July to 5 August 2012, dashed line indicates GPCP and solid line indicates TRMM. The domain of (a1), (a2), (b1), (b2), (c1), (c2) is same as shown in Figure 1.
rainfall, TRMM rainfall data was higher than GPCP on July 27, 28, 29, but on August 2 TRMM rainfall was lower than GPCP. On August 4, the maximum difference was 25 mm in the higher rainfall region. The area of (b1) was higher intensity area over the typhoon and no rainfall observed before August 1 because the typhoon has not reached the sea area. When the typhoon reached the maxi-mum intensity, Figure 4(b1) illustrating GPCP rainfall was higher than TRMM. It is clearly visible that GPCP data is reliable than TRMM when rainfall less than 15 mm. Over the typhoon Saola passed area, TRMM data is superior to GPCP at high intensity rainfall indicated in Figure 4(b2). The Figure 4(b1) and Figure 4(b2) showing there was no significant difference in the rainfall between TRMM and GPCP before and after the typhoons passage. But during typhoons passage, GPCP rainfall was higher than TRMM when the rainfall was lower than 15 mm (Figure 4(b1)). In contrast, there were three days of rainfall above 15 mm, re-spectively on 31 July, 1and 2 Aug, TRMM rainfall was reversed, exceeding GPCP with the typhoon approaching (Figure 4(b2)). Figure 4(c1) and Figure 4(c2)
are the rainfall variations over landfall area. In Figure 4(c1), rainfall from Au-gust 1 to 5 was less than 20 mm, GPCP rainfall exceeded TRMM. However, TRMM rainfall was higher than GPCP when heavy rainfall occurred (Figure 4(c2)). In summary, when the rainfall is small, GPCP data is better than TRMM; when the rainfall is large, TRMM data can reflect the real rainfall.
5. Discussion
The rainfall production by TCs is also influenced by environmental parameters such as sea surface moisture flux, vertical wind shear, storm intensity, and topo-graphy. In this present study, we cover the period of the time between July 27 and Aug 4, 2012. The GPCP data and TRMM data are used to estimate the mag-nitude of the rainfall, and GPCP and TRMM rainfall data compared in the present study.
special terrain led to the wind reduced and the moving speed decreased. The humid air encountered the large mountains; the mountain windward slope would force it to accelerate the rising and the condensation, so that the rainfall even became fiercer. Similarly, Damrey was close to the Japan so the Damrey induced rainfall mainly distributed in the right side of track, the Kyushu Island and the south of Kyushu Island (Huang 2014 [37]; Yunying et al., 2007 [38]).
Comparing these two data sets, TRMM data gives better estimations when the rainfall value is higher than 15 mm, but GPCP data is more reliable when rainfall is less than 15 mm. This is probably a consequence of the different spatial reso-lution and sensitivity of the sensors. The spatial resoreso-lution of the TRMM data is 0.25 × 0.25, and the spatial resolution of the GPCP is 1 × 1. GPCP rainfall show-ing lower than TRMM, this may be the reason GPCP data is the mean of all available satellite and rain gauage data. The bias of TRMM might be from un-certainties of radar attenuation corrections and microwave retrieval algorithms
[41] (Huffman et al., 2010). However, the uncertainties of both GPCP and TRMM rainfall may be due to estimation of satellite-based rainfall due to algorithms and rain gauge measurements may subject to underestimate. However both TRMM and GPCP can be used for typhoon rainfall, even though there are subject to uncertainties over large surface wind environment induced by typhoons.
6. Conclusion
Acknowledgements
Authors express their gratitude to GPCP and TRMM for providing the rainfall data for research work. Authors are thankful to the anonymous reviewers for useful comments for revising the manuscript.
References
[1] Emanuel, K.A. (1999) Thermodynamic Control of Hurricane Intensity. Nature, 401, 665-669. https://doi.org/10.1038/44326
[2] Zhang, Q., Liu, Q. and Wu, L. (2009) Tropical Cyclone Damages in China 1983- 2006. Bulletin of the American Meteorological Society, 90, 489-495.
https://doi.org/10.1175/2008BAMS2631.1
[3] Kim, J.-H., Ho, C.-H., Lee, M.-H., Jeong, J.-H. and Chen, D. (2006) Large Increase in Heavy Rainfall Associated with Tropical Cyclone Landfalls in Korea after the Late 1970s. Geophysical Research Letters, 33, L18706.
https://doi.org/10.1029/2006gl027430
[4] Lau, W.K.-M. and Wu, H.-T. (2008) Have Tropical Cyclones Been Feeding More Extreme Rainfall?Journal of Geophysical Research, 113, D23113.
https://doi.org/10.1029/2008jd009963
[5] Lau, W.K.-M. and Zhou, Y.P. (2012) Observed Recent Trends in Tropical Cyclone Rainfall over the North Atlantic and the North Pacific. Journal of Geophysical Re-search, 117, D03104. https://doi.org/10.1029/2011jd016510
[6] Knutson, T.R., et al. (2010) Tropical Cyclones and Climate Change. Nature Geo- science, 3, 157-163. https://doi.org/10.1038/ngeo779
[7] Hsu, H.-H., et al. (2011) Science Report of Climate Change in Taiwan 2011. Nation-al Science Council, 362 p. (In Chinese)
[8] Chang, C.-P., Lei, Y., Sui, C.-H., Lin, X. and Ren, F. (2012) Tropical Cyclone and Extreme Rainfall Trends in East Asian Summer Monsoon Since Mid-20th Century. Geophysical Research Letters, 39, L18702. https://doi.org/10.1029/2012gl052945
[9] Shapiro, L.J. (1983) Asymmetric Boundary Layer Flow under a Translating Hurri-cane. Journal of the Atmospheric Sciences, 40, 1984-1998.
https://doi.org/10.1175/1520-0469(1983)040<1984:TABLFU>2.0.CO;2
[10] Bender, M A. (1997) The Effect of Relative Flow on the Asymmetric Structure in the Interior of Hurricanes. Journal of the Atmospheric Sciences, 54, 703-724.
https://doi.org/10.1175/1520-0469(1997)054<0703:TEORFO>2.0.CO;2
[11] Frank, W.M. and Ritchie, E.A. (1999) Effects of Environmental Flow upon Tropical Cyclone Structure. Monthly Weather Review, 127, 2044-2061.
https://doi.org/10.1175/1520-0493(1999)127<2044:EOEFUT>2.0.CO;2
[12] Lonfat, M., Marks Jr., F.D. and Chen, S.S. (2004) Precipitation Distribution in Tropical Cyclones Using the Tropical Rainfall Measuring Mission (TRMM) Micro-wave Imager: A Global Perspective. Monthly Weather Review, 132, 1645-1660.
https://doi.org/10.1175/1520-0493(2004)132<1645:PDITCU>2.0.CO;2
[13] Lin, Y.Y., Liu, Y.Q. and Zhang, L.Q. (2001) An Analysis on the Impact of Severe Tropical Storm “Maria” on the Torrential Heavy Rain in Shaoguan. Guangdong Meteorology, 3, 5-7. http://gdqx.qikanc.com/
[14] Li, J., et al. (2003) Advancement in the Study of Typhoon Rainstorm. Journal of Tropical Meteorology, 19, 152-159. (In Chinese)
tics of Tropical Cyclones Using TRMM Satellite Data. Monthly Weather Review, 136, 3848-3862. https://doi.org/10.1175/2008MWR2408.1
[21] Blackwell, K.G. (2000) The Evolution of Hurricane Danny (1997) at Landfall: Doppler Observed Eyewall Replacement, Vortex Contraction/Intensification, and Lowlevel Wind Maxima. Monthly Weather Review, 128, 4002-4016.
https://doi.org/10.1175/1520-0493(2000)129<4002:TEOHDA>2.0.CO;2
[22] Chen, S.S., Knaff, J.A. and Marks Jr., F.D. (2006) Effects of Vertical Wind Shear and Storm Motion on Tropical Cyclone Rainfall Asymmetries Deduced from TRMM. Monthly Weather Review, 134, 3190-3208. https://doi.org/10.1175/MWR3245.1
[23] Willoughby, H.E., Marks Jr., F.D. and Feinberg, R.J. (1984) Stationary and Moving Convective Bands in Hurricanes. Journal of the Atmospheric Sciences, 41, 3189- 3211. https://doi.org/10.1175/1520-0469(1984)041<3189:SAMCBI>2.0.CO;2
[24] Subrahmanyam, M.V. (2015) Impact of Typhoon on the North-West Pacific Sea Surface Temperature: A Case Study of Typhoon Kaemi (2006). Natural Hazards, 78, 569-582. https://doi.org/10.1007/s11069-015-1733-7
[25] Chu, J.H., Sampson, C.R., Levine, A.S. and Fukada, E. (2002) The Joint Typhoon Warning Center Tropical Cyclone Best-Tracks, 1945-2000. Rep. NRL/MR/7540-02- 16, Joint Typhoon Warning Center, Hawaii.
http://www.usno.navy.mil/NOOC/nmfc-ph/RSS/jtwc/best_tracks/TC_bt_report.html [26] Huffman, G.J., Adler, R.F., Morrissey, M., Bolvin, D.T., Curtis, S., Joyce, R.,
McGa-vock, B. and Susskind, J. (2001) Global Precipitation at One-Degree Daily Resolu-tion from Multi Satellite ObservaResolu-tions. Journal of Hydrometeorology, 2, 36-50.
https://doi.org/10.1175/1525-7541(2001)002<0036:GPAODD>2.0.CO;2
[27] Xie, J., Janowiak, E., Arkin, P.A., Adler, R., Gruber, A., Ferraro, R., Huffman, G.J. and Curtis, S. (2003) GPCP Pentad Precipitation Analyses: An Experimental Data Set Based on Gauge Observations and Satellite Estimates. Journal of Climate, 16, 2197-2214. https://doi.org/10.1175/2769.1
[28] Adler, R.F., et al. (2003) The Version-2 Global Precipitation Climatology Project (GPCP) Monthly Precipitation Analysis (1979-Present). Journal of Hydrometeoro- logy, 4, 1147-1167.
https://doi.org/10.1175/1525-7541(2003)004<1147:TVGPCP>2.0.CO;2
[29] Huffman, G.J., Adler, R.F., Bolvin, D.T., Gu, G., Nelkin, E.J., Bowman, K.P., Stock-er, E.F. and Wolff, D.B. (2007) The TRMM Multisatellite Precipitation Analysis (TMPA): Quasi-Global, Multiyear, Combined-Sensor Precipitation Estimates at Fine Scale. Journal of Hydrometeorology, 8, 38-55.
https://doi.org/10.1175/jhm560.1
of Tropical Cyclones to Extreme Rainfall along the Coastal Southeastern United States. Geophysical Research Letters, 34, L23810.
https://doi.org/10.1029/2007gl031694
[31] Jiang, H., Ramirez, E.M. and Cecil, D.J. (2012) Convective and Rainfall Properties of Tropical Cyclone Inner Cores and Rainbands from 11 Years of TRMM Data. Monthly Weather Review, 141, 431-450.
https://doi.org/10.1175/MWR-D-11-00360.1
[32] Zehr, R. (1992) Tropical Cyclogenesis in the Western North Pacific. NOAA Tech-nical Report NESDIS, 16, 181 p.
[33] Emanuel, K.A. (1986) An Air-Sea Interaction Theory for Tropical Cyclones. Part I: Steady-State Maintenance. Journal of the Atmospheric Sciences, 43, 585-604.
https://doi.org/10.1175/1520-0469(1986)043<0585:aasitf>2.0.co;2
[34] Merrill, R.T. (1988) Characteristic of the Upper-Tropospheric Environment Flow around Hurricanes.Journal of the Atmospheric Sciences, 45, 1665-1677.
https://doi.org/10.1175/1520-0469(1988)045<1665:COTUTE>2.0.CO;2
[35] Gray, W.M. and Jacobso, R.W. (1977) Diurnal Variation of Deep Cumulus Convec-tion. Monthly Weather Review, 105, 1171-1188.
[36] Steranka, J., Rodgers, E.B. and Gentry, R.C. (1984) The Diurnal Variation of Atlan-tic Ocean Tropical Cyclone Cloud Distribution Inferred from Geostationary Satel-lite Infrared Measurements. Monthly Weather Review, 112, 2338-2344.
https://doi.org/10.1175/1520-0493(1984)112<2338:TDVOAO>2.0.CO;2
[37] Huang, Y.C. and Lin, Y.L. (2014) A Study on the Structure and Precipitation of Morakot (2009) Induced by the Central Mountain Range of Taiwan. Meteorology and Atmospheric Physics, 123, 115-141. https://doi.org/10.1007/s00703-013-0290-4
[38] Yunying, L.I., Wei, H. and Zhao, J. (2007) Roles of Mesoscale Terrain and Latent Heat Release in Typhoon Precipitation: A Numerical Case Study. Advances in At-mospheric Sciences, 24, 35-43. https://doi.org/10.1007/s00376-007-0035-8
[39] Fan, A.F., Lou, X.F. and Peng, X.Y. (2014) Impact of Typhoon “Damery” on Ty-phoon “Saola”. Marine Forecasts, 31, 26-34. (In Chinese)
[40] Alpers, W., Chen, J.P., Lin, I.I. and Lien, C. (2007) Atmospheric Fronts along the East Coast of Taiwan Studied by ERS Synthetic Aperture Radar Images. Journal of the Atmospheric Sciences, 64, 922-937. https://doi.org/10.1175/JAS3863.1
[41] Huffman, G.J., Adler, R., Bolvin, D. and Nelkin, E. (2010) The TRMM Multi-Satel- lite Precipitation Analysis (TMPA). In: Gebremichael, M. and Hossain, F., Eds., Sa-tellite Rainfall Applications for Surface Hydrology, Springer, 3-22.