Munich Personal RePEc Archive
Skill biased technical change: panel
evidence of task orientation, wage effects,
and labor dynamics
Ross, Matthew
University of Connecticut
14 December 2014
Skill Biased Technical Change:
Panel Evidence of Task Orientation, Wage Effects, and Labor
Dynamics
I. Introduction
An important conclusion from recent research regarding Skill Biased Technical Change (SBTC) is that changes to production technology have created an increase in the relative demand for occupations characterized by a high degree of engagement in non-routine tasks. The increased demand for these occupations is due to their complementarity with non-routine tasks in the production process. In contrast, occupations dominated by engagement in routine tasks are believed to be more easily substitutable for new
technology and have experienced a relative decrease in demand. Although
† Department of Economics, 365 Fairfield Way, Unit 1063, University of Connecticut, Storrs
CT 06269-1063. Phone: 978.888.8517. Email: [email protected]
Matthew B. Ross†
JEL No. J20, J23, J24, J30, J31, O30, O31, O33
Existing empirical analyses of Skill Biased Technical Change focus on
examining repeated cross-sections of individuals holding
occupational task measures fixed. That approach cannot explore how wages respond to temporal variation in task orientation. This analysis examines wage effects using a synthetic panel of occupational task
measures constructed from 17 releases of the O*NET database. This
much of the existing empirical work has explored the impact of SBTC on the wage distribution, little attention has been paid to how changes over time in task engagement within occupations affect the wage of incumbent workers. Here, a panel of task measures is constructed and combined with
longitudinal data on individuals in order to examine wage effects associated with evolving task engagement within occupations over time as well as the relationship of labor market dynamics between jobs and occupations with the observed wage impacts.
In describing why SBTC has resulted in some occupations becoming more automated than others, a recent paper by David Autor (2014) refers to tasks that follow explicit rules as routine and suggests that they are more easily codified by technology. The codification of these tasks allows for them to be more easily substituted for capital in the production process. Those tasks that are rich in tacit knowledge, on the other hand, are characterized as non-routine. These tasks are less easily codified because they require
frequent use of cognitive judgment or social interaction. Non-routine tasks, unlike routine tasks, utilize capital as a complement in production. This view suggests that the primary driving force behind observed changes in the labor market is the falling price of computing power coupled with the increased capability of technology to replicate human tasks. More specifically, it argues that these factors have displaced workers with a high degree of engagement in routine tasks while simultaneously increasing the demand for workers engaged in non-routine tasks.
cross-sectional data on workers, while holding constant reported measures of occupational task content. Although a constant distribution of occupational task engagement is a reasonable assumption in the short-run, it becomes difficult to maintain in the long-run when firms have more opportunity to alter their capital investments. One might reasonably suspect, as we illustrate in this analysis, that changes in measures of task engagement and associated wage premiums vary over time both within and across occupations.
The absence of panel data linking occupational task measures to employment and job histories of individual workers has prevented prior research from exploring the labor market dynamics associated with evolving occupational task engagement. Evolving occupational task measures may be related to having workers of a specific type within occupations, returns to specific jobs, or mobility across employers or occupations. This analysis fills a significant gap in the literature by developing a panel of occupational task measures and using it to explore the wage effects associated with observed changes in task engagement within and across occupations and job spells.
workers also supports an analysis of the role of unobserved heterogeneity associated with attributes of workers within occupations as well as specific jobs they hold. The different fixed-effect models applied in this analysis allow us to control for different portions of the overall variance in wages. This empirical strategy allows us to infer the extent of the variation in returns to task engagement due to these different influences.
The findings from the analysis indicate that a substantial portions of typical cross-sectional estimates of the relationship between tasks and wages are driven by those factors, consistent with prior research, but that
substantial portions can also be related to individual heterogeneity. Further results obtained from models that also include occupation fixed-effects demonstrate that workers changing occupations may play a key role in driving what have previously been inferred by prior research to be altered returns to tasks for all incumbent workers. Specifically, the analysis does not find wage effects after controlling for individual and occupation fixed-effects indicating that those employed in the same occupation over time do not experience the same wage effects seen across occupations. We speculate that this may be due to nominal wage rigidities that cause technological change to
manifest as employment transitions rather than through a worker’s wage.
Estimates of this type have previously been unavailable in the literature and are of particular interest because they provide a new perspective on the labor market dynamics associated with SBTC.
II. Motivation and Literary Overview
expands that body of literature by utilizing an individual panel of workers in combination with a panel of occupational task measures. The resulting analysis allows occupational task measures to evolve over time while accounting for individual heterogeneity and potential cross-occupation sorting based on unobserved ability. The motivation and many of the
estimation equations used in the analysis are drawn from existing empirical works on SBTC but have been enhanced to accommodate panel data. As a result, it is important to understand the evolution of the SBTC literature and the empirical works that have preceded this analysis.
Katz and Murphy (1992) use a supply and demand framework to assess the change in patterns of wage differentials from 1932 through 1987. They combine 25 March releases of the Current Population Survey (CPS) and divided the sample into 320 subgroups by gender, level of education, and work experience. They find that acceleration in the demand for highly skilled labor drove widening of the wage structure during the period. They conclude that the changes to overall wage structure in this period were much more favorable to college educated workers and that this was the primary force behind a corresponding increase in the supply of graduates.
Katz and Murphy’s insight that a significant change had occurred in the demand for specific occupations and industries helped pave the way for the task based analysis at the forefront of the literature today. In addition, their work also highlighted how these demand changes required a higher level of education than was previously necessary. This finding preceded the modern literature on SBTC and provides a widely accepted perspective.
degree of computerization at the industry and occupation level in a model that controlled for changes in supply and demand. They find that supply changes and the rising wage premium for college-educated workers from 1940 to 1996 were related to a strong acceleration in the demand for skilled labor. The authors report that industries and occupations with a high degree of computer usage have expanded their demand for skilled labor as
measured by the education level of the requisite workforce.
Autor, Levy, and Murnane (2003) similarly use computerization as a proxy for technological change and argue that computer capital can
substitute for workers performing routine cognitive and manual tasks while complimenting workers performing non-routine tasks. They assume these tasks are imperfectly substitutable and find evidence of noticeable changes in
the labor market as computerization increased. The author’s combine the
task input data from the 1960 to 1998 Dictionary of Occupational Titles (DOT) with a panel constructed from repeated cross-sections of the
Decennial Census and CPS. The authors find that within industry, occupation, and educational groups have seen reductions in demand for labor associated with routine tasks but increases for non-routine labor.
The analysis points towards two distinct sources of variation in the interaction between task content and computer usage (Autor et al. 2003, p. 1292) they refer to as the intensive and extensive margins. The extensive margin refers to cross-occupational observed changes in the distribution of employment over time holding task content fixed. The intensive margin, on the other hand, refers to within-occupational observed changes in the
cannot directly examine the role of occupational sorting because of the repeated cross-sectional data used in the analysis.
As in the earlier work of Autor et al. (1998), Autor et al. (2003) argue that computer capital acts as a substitute for workers completing routine tasks and a complement for workers completing non-routine tasks. The distinction between these two types of tasks is that those considered non-routine involve making uncertain decisions or relying heavily on human interaction while routine tasks follow explicit sets of rules and require less human judgement. Again, the authors posit that routine and non-routine labor are imperfectly substitutable with each other and capital.
The authors attribute changes in the composition of job tasks and increased computerization to a reduced demand for workers performing routine tasks and an increased demand for labor characterized by a high level of engagement in non-routine tasks. They translate shifts in the demand for specific tasks to changes in the demand for educated labor (as a proxy for relevant skills). They find that their model explains 60 percent of the growth of college-educated labor from 1970-98. Most subsequent empirical work on SBTC has maintained this methodological distinction between routine and non-routine labor.
Gathmann and Schönberg (2010) make a significant contribution to the SBTC literature by examining employment dynamics using a panel constructed from German administrative records on individual workers. Specifically, the authors investigate the transferability of skills across occupations. They find that individuals are more likely to move to
occupations with similar task requirements. The authors’ findings indicate
that differences between the task content of an occupation and a workers
likelihood of selection into occupations. The author’s advocate for a task -based approach where over time, workers are matched to occupations with
expected levels of task engagement similar to workers’ skills.
Acemoglu and Autor (2011) develop the most comprehensive theoretical exposition of the relationship between SBTC, job content, and
wages. A key component of their model is the distinction between employers’ demand for tasks and workers’ supply of skills. The model assumes a
production function consisting of routine and non-routine labor. In the context of the model, labor can be thought of as a bundle of tasks differing across occupational categories. Skills supplied, in contrast, are accumulated through a workers attainment of human capital (education) and have an imperfect matching to tasks.
The (Acemoglu and Autor 2011) model introduces technological change through shocks to factor productivity. The differing substitution parameter on these two types of labor is what determines the magnitude and direction of the demand shifts. Workers are assumed to attain skills through education and then sort into different jobs based on task requirements. Their model articulates a fully developed supply and demand framework that can be used to derive comparative statics related to SBTC. This model has been used extensively in subsequent work on SBTC and expanded to
accommodate empirical applications.
For example, the work of Firpo et al. (2011) is motivated by the model of Acemoglu and Autor (2011). They (Firpo et al.) develop a cross-sectional Roy model that is used to examine the distribution of wages within
(2010). The authors utilize a set of task indices updated from Autor et al. (2003) and augmented to utilize the O*NET database of occupational characteristics. The analysis applies this framework to repeated cross-sections of the CPS using a single release of the O*NET database. The authors assess how occupational tasks have contributed to changes in the wage distribution observed over the last two decades.
Firpo et al. find that this model helps to explain much of the wage polarization reported in other empirical works on SBTC. They note how their framework would be applicable to panel data although they use repeated cross-sections in their analysis. The authors point towards the potential usefulness of panel data on individuals and task engagement to help shed light on wage and labor dynamics related to SBTC. Here, we develop a panel model and collect necessary data to begin to examine the relationship between individual employment relationships and returns to task engagement.
Autor and Handel (2013) return to the approach of using a Roy model by descriptively estimating task premiums with a cross-sectional survey of self-reported task measures. This most recent empirical assessment of the returns to different occupational tasks uses a survey of self-reported task engagement in conjunction with a single release of the O*NET database. The authors combine occupation-level task measures with self-reported task inputs and use the interaction to account for potential selection. The self-selection in their model refers to the comparative advantage that occurs when workers with high ability related to observed task measures sort into occupations with a higher wage premium for those tasks. Autor and Handel accomplish this by using a self-reported cross-section of work task
engagement in their Roy model.
Altonji, Kahn, and Speer (2014) investigate the forces behind changes to the wage distribution across college graduates from different fields of study. They explore how changes to labor demand driven by SBTC might be driving the widening observed in the cross-field wage distribution of college graduates over last two decades. They argue that a combination of
pre-college sorting and field-specific curriculum play a major role in occupational selection. As a result, changes to labor demand driven by SBTC alter
The motivation of this analysis is to extend prior work on the role of routine and non-routine tasks and their relationship to wages. Where prior work has often used single period measures of tasks and repeated cross-sections of data, here, longitudinal data are developed. These support an analysis of the changing nature of tasks within occupations as well as the role of unobserved individual, job, and occupation specific attributes in driving observed returns to engagement in different tasks. This is the first analysis of its type in the U.S. literature.
III. Empirical Methods
The estimation equation used in this analysis is a variation of the Roy model used in previous cross-sectional approaches to estimating the effects of SBTC (Acemoglu and Autor 2011; Firpo et al. 2011; and Autor and Handel 2013). The estimation equation is adjusted so that it can accommodate panel data and individual fixed-effects. In addition, generalizable human capital is introduced as a total factor productivity term in the underlying production function. The data support the use of fixed-effects to control for time invariant heterogeneity across individuals and occupations. These fixed-effects also allow us to explore the association between specific jobs and wage variation. Finally, they allow us to infer the importance of occupational transitions in driving wage variation in the sample.
We begin by presenting the model developed by Autor and Handel (2013) to examine differential task premiums using a cross-sectional survey of workers with self-reported levels of task engagement. The authors begin
by assuming that workers have an endowment of skills Φ𝑖 =
model, each element of Φ𝑖 is a strictly positive number that measures the
efficiency of a worker i at a task k and where a worker can perform Φ𝑖,𝑘units
of a given task k per period. The skill endowment represents a stock of human capital resulting from a combination of education and innate ability.
The production function for worker i in occupation s is represented in
Equation 1 where 𝛼𝑠 represents an occupational productivity term, 𝜙𝑖,𝑘
represents engagement by individual i in task k, 𝜆𝑠,𝑘 is an occupation specific
output elasticity for task k, and 𝜇𝑖 represents an idiosyncratic individual
error term.
𝑌𝑖,𝑠= 𝑒𝑥𝑝 (𝛼𝑠 + ∑ 𝜆𝑠,𝑘𝜙𝑖,𝑘 + 𝜇𝑖 𝑘
) (1)
Assuming workers are paid their marginal product, the resulting log wage
equation from Autor and Handel’s model is detailed in Equation 2.
𝑤𝑖 = 𝛼𝑠 + ∑ 𝜆𝑠,𝑘𝜙𝑖,𝑘+ 𝜇𝑖
𝑘 (2)
The key assumption of the author’s model is that workers take the
production structure as given. Workers sort into occupations based on the associated task premiums that will maximize their output and resulting wage. This assumption is represented through the maximization problem outlined in Equation 3.
The model used here is constructed in a similar fashion but has
several key differences that allow us to control for time variant sorting based on unobserved heterogeneity that may be contributing to results estimated across occupations. Similar to Autor and Handel (2013), we begin by
assuming that workers have an endowment of j skills each period Φ𝑡,𝑖 =
{ Φ𝑡,𝑖,1, Φ𝑡,𝑖,2, … , Φ𝑡,𝑖,𝑗}. However, we also assume that a worker’s
endowment of skills correspond to a maximum possible level of task
engagement 𝑓( Φ𝑡,𝑖) → Τt,i,k through a task-efficiency function. An individual
acquires skills through task-specific human capital and combines them
through the task-efficiency function to accomplish tasks. Task-specific human capital can be accumulated through some combination of education and innate ability. The assumption of a task-efficiency function allows for occupational sorting based on education and ability. Here, we focus on estimating the mean premium across all occupations for differing task measures.
The production function for a worker i in occupation s is represented
in Equation 4 where 𝐿𝑡,𝑠,𝑖 = {1,0} represents the decision of individual i to
work in an occupation s at time t, Α𝑠represents an occupational productivity
term, Ψ𝑡 represents an idiosyncratic temporal shock, Τ𝑡,𝑠,𝑘 represents the
engagement in task k at time t for the average individual employed in
occupation s, 𝜆𝑡,𝑘 is a cross-occupation output elasticity for task k at time t,
and 𝜇𝑡,𝑖 represents an idiosyncratic error term.
𝑌𝑠,𝑡,𝑖 = Α𝑠Ψ𝑡∏ Τ𝑡,𝑠,𝑘𝜆𝑡,𝑘𝐿𝑡,𝑠,𝑖
𝐾
𝑘=1
The resulting log wage equation from our model is detailed in Equation 5.
𝑤𝑠,𝑡,𝑖 = 𝛼𝑠+ 𝜓𝑡+ ∑ 𝜆𝑡,𝑘𝜏𝑡,𝑠,𝑘+ 𝜇𝑡,𝑖
𝑘
(5)
In our model, in contrast to Firpo et al. (2011) and Autor and Handel
(2013), we initially hold constant output elasticity 𝜆𝑡,𝑘 (i.e. the wage
premium associated with each task) across occupations rather than allowing it to vary across occupations. This is consistent with the use of individual fixed-effects which control for variation originating from person specific heterogeneity and also variation associated with individuals who do not move across occupations or jobs over time. The specification alters the traditional Roy model by including a task-efficiency function that maps skills to occupational tasks. In doing this, we have assumed that sorting across occupations occurs through skill-task efficiency and that similarly skilled workers sort into occupations where the task requirements align with their skill. This assumption is represented through the maximization problem outlined in Equation 6.
𝑌𝑡,𝑖 = max𝑠 {𝑌𝑖,1, 𝑌𝑖,2, … , 𝑌𝑖,𝑠} = max𝑠 {Α𝑡,𝑠∏ Τ𝑡,𝑠,𝑘𝜆𝑡,𝑘𝐿𝑡,𝑠,𝑖𝑒𝜇𝑖 𝐾
𝑘=1
}
= max𝑠 {Α𝑡,𝑠∏ 𝑓( Φ𝑡,𝑖,𝑘)𝜆𝑡,𝑘𝐿𝑡,𝑠,𝑖𝑒𝜇𝑖 𝐾
𝑘=1
}
(6)
Autor and Handel (2013) utilize data on an individual’s reported
the data is obtained from aggregating task engagement measures by index (i.e. abstract, routine, and non-routine manual) within occupations at different points in time. The level of occupational task engagement can be thought of as the mean level of task engagement across individuals working in a given occupation or, put differently, the occupational requirements necessary to produce a single unit of output.
According to the maximization presented in Equation 6, we must
assume that in equilibrium an individual’s task engagement will converge to
the occupational requirements. This condition will hold if the cost associated with changing occupations is sufficiently high and firms can observe the production performance of each worker. The dynamics of mean task convergence indicate that, in equilibrium, the expected level of task engagement for any given worker is equivalent to the occupational
requirements in that period. In equilibrium we expect that similar workers, in terms of skill endowments, sort into the same occupations due to these dynamics.
Estimating the economy-wide returns to tasks
The production function from Equation 4 can be further amended to accommodate generalizable human capital. We differentiate generalizable human capital with occupation-specific human capital that, along with ability,
determine an individual’s skill endowment. Unlike occupation-specific human capital, we consider generalizable human capital to be soft-skills that make a worker more productive in any occupation. We assume that
productivity and show the amended production function in Equation 7.
𝑌𝑠,𝑡,𝑖 = Α𝑠Ψ𝑡𝐻𝑡,𝑖∏ Τ𝑡,𝑠,𝑘𝜆𝑡,𝑘𝐿𝑡,𝑠,𝑖𝑒𝜇𝑡,𝑖
𝐾
𝑘=1
(7)
In Equation 8, we specify that generalizable human capital term where Δ𝑖
represents unobserved individual ability, 𝐸𝑡,𝑖 represents individual
education, and 𝐸𝑋𝑃𝑡,𝑖 represents individual experience.
𝐻𝑡,𝑖 = Δ𝑖𝐸𝑡,𝑖𝛽1𝐸𝑋𝑃𝑡,𝑖𝛽2𝐸𝑋𝑃𝑡,𝑖2𝛽3 (8)
Assuming that workers are paid the marginal product for their
occupation, the resulting log wage equation for an individual in occupation s at time t is seen in Equation 9. In Equation 9, the output elasticity of each task can be interpreted as an economy-wide premium that the worker receives for engagement is each requisite task.
𝑤𝑠,𝑡,𝑖 = 𝛼𝑠+ 𝜓𝑡+ ℎ𝑡,𝑖 + ∑ 𝜆𝑡,𝑘𝜏𝑡,𝑠,𝑘+ 𝜇𝑡,𝑖
𝑘
(9)
The primary estimation equation used in the empirical analysis is derived from Equation 9 and shown in Equation 10.
𝑤𝑠,𝑡,𝑖 = 𝛼𝑠+ 𝛿𝑖 + 𝜓𝑡+ 𝛽1𝑒𝑡,𝑖+ 𝛽2𝑒𝑥𝑝𝑡,𝑖+ 𝛽3𝑒𝑥𝑝𝑡,𝑖2
+ ∑ 𝜆𝑡,𝑘𝜏𝑡,𝑠,𝑘 + 𝜇𝑡,𝑖 𝑘
Equation 10 serves as the primary estimation equation containing both individual and time period specific fixed-effects. As already noted, we also explore the influence of job and occupation specific fixed-effects to better understand the influence of those elements on variation in returns to task engagement. When fixed-effects are dropped from the equation, the estimation form makes use of the available data in a pooled OLS framework.
IV. Data Overview and Descriptive Statistics
The data used in the analysis combines a panel of individuals and their work activities with a panel of occupational task measures. The
individual level data are drawn from the 2004 and 2008 Panels of the Survey of Income Program Participation (SIPP). The SIPP is a household-based survey designed as a continuous representative series of national panels where the same individuals are interviewed over a multi-year period lasting approximately four years.
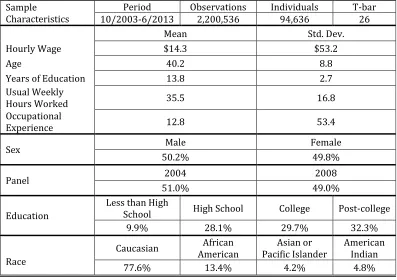
The 2004 and 2008 SIPP panels are combined to create an unbalanced panel of approximately two million observations. Specifically, the combined panels span the period from October 2003 through July 2013 with some months missing due to breaks in the survey. The sample was restricted to prime working age individuals between 25 and 55 years old who were not in the military. The combined panels have a total of 94,636 individuals
observed on average 26 times each for a total of 2,200,536 observations.
1 The descriptive statistics for variables drawn from the SIPP that are used in
[image:19.612.108.505.365.645.2]the empirical analysis are presented in Table 1.
Table 1
Descriptive Statistics from Combined 2004 and 2008 SIPP Panels
1 These figures vary based on the specification used in each part of the analysis. This is due
to unreported occupational codes and other factors. Sample
Characteristics
Period Observations Individuals T-bar 10/2003-6/2013 2,200,536 94,636 26
Mean Std. Dev.
Hourly Wage $14.3 $53.2
Age 40.2 8.8
Years of Education 13.8 2.7
Usual Weekly
Hours Worked 35.5 16.8
Occupational
Experience 12.8 53.4
Sex Male Female
50.2% 49.8%
Panel 2004 2008
51.0% 49.0%
Education
Less than High
School High School College Post-college 9.9% 28.1% 29.7% 32.3%
Race
Caucasian African American
Asian or Pacific Islander
American Indian
The dependent variable, average hourly wage from primary
employment, was reported in the SIPP for non-salaried employees. Although the average hourly wage was not directly reported for salaried employees, it was calculated by dividing total earned income for the observation month by the number of weeks worked in the month and the number of usual hours
worked per week. The characteristics of each individual’s primary job were utilized in the analysis. Any information on an individual’s secondary job as
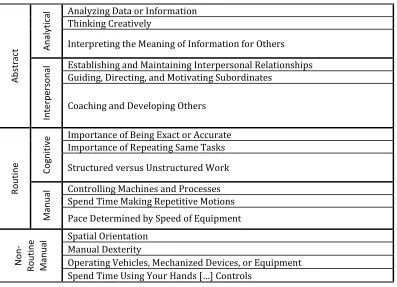
well as information pertaining to self-employed individuals was disregarded. The variables used to measure task engagement align with those created by Autor and Handel (2013) for abstract, routine, and non-routine manual tasks. The components of the O*NET used in the construction of the task indices can be seen in Table 2 and are drawn from Autor and Handel (2013). The task indices can be thought of as measuring the mean level of occupational engagement in task clusters. Each cluster is characterized as involving similar processes to accomplish production. An example of this might be dealing with vendors outside of a company as compared to dealing with subordinates. These two activities are certainly considered distinct tasks with differing goals but would both be considered part of the abstract-interpersonal task cluster. As previously mentioned, prior analyses utilized only a single release of the O*NET database and could not assess the degree to which individual wages respond to changes in occupational task
Table 2
O*NET Variables Included in the Task Indices
Ab stra ct An al y ti
cal Analyzing Data or Information Thinking Creatively
Interpreting the Meaning of Information for Others
In terp e rs o n
al Establishing and Maintaining Interpersonal Relationships
Guiding, Directing, and Motivating Subordinates
Coaching and Developing Others
Rou ti n e Cogn iti v
e Importance of Being Exact or Accurate
Importance of Repeating Same Tasks Structured versus Unstructured Work
Ma
n
u
al Controlling Machines and Processes
Spend Time Making Repetitive Motions Pace Determined by Speed of Equipment
N o n -Rou ti n e Ma n u
al Spatial Orientation
Manual Dexterity
Operating Vehicles, Mechanized Devices, or Equipment Spend Time Using Your Hands […] Controls
In our construction of the three task indices, we utilize the level category for work abilities and activities measures from the O*NET
database.2 The context category was used for variables that come from the
work context measures in the O*NET database. Each of the task measures that underlie the three task measures were gathered from 17 distinct
releases of the O*NET database.3 The task measures from the O*NET
2 The level and context categories have similar meanings across the broader O*NET task
groupings and were determined to be more consistent than the use of the importance category. The findings are robust to the specification used by Blinder (2007) and Firpo et al. (2011) where a Cobb-Douglas weight of two thirds is assigned to importance and one third is assigned to level. The results with the Cobb-Douglas specification are presented in the robustness check section.
3 The O*NET only makes the latest release of their database available through their primary
database were weighted using a rolling three-year average of occupational employment constructed from the Occupational Employment Statistics (OES) national employment estimates.
The OES employment weights allowed for the O*NET task measures to be aggregated from a 6-digit SOC level to a 3 and 5-digit SOC level.
Aggregating the task measures to a less detailed taxonomy was a crucial precaution that was taken to guard against problems associated with potential measurement error in the original task measures. Following Yamaguchi (2011), the resulting 3 and 5-digit SOC task measures were then combined into the three task indices using the first component of a principal components analysis. The standardized values of these three task indices were used as the primary explanatory variables in this analysis.
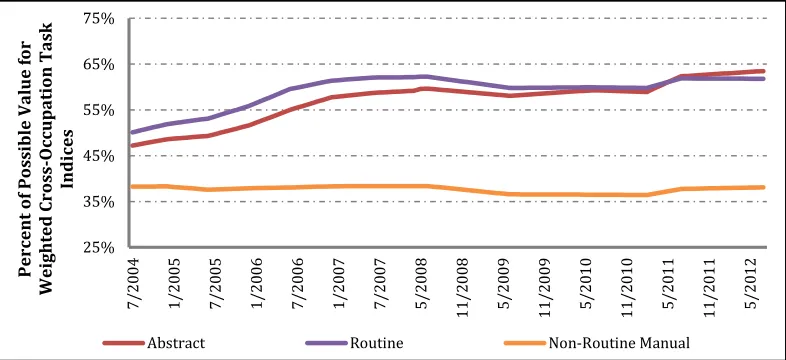
For illustrative purposes, the raw cross-occupational average for each of the three task indices are presented in Figure 1 as a percent of the
maximum possible value. As before, the measures presented in Figure 1 are constructed from 17 distinct releases of the O*NET database and weighted based on a rolling share of 6-digit employment. The variables were linearly trended on a monthly basis between each of the O*NET releases. Figure 1 illustrates that, over the long-run, the way that occupations accomplish production is changing and that the components underlying each of the task
indices are experiencing different patterns of growth.4 A single
cross-sectional release of occupational task measures is unable to capture the dynamics underlying this process and do not allow for exploration into how
through 2015. A total of 19 of these releases were used to construct the panel of occupational task measures used in this analysis.
4 The appendix contains figures for the underlying components within each index. Although
these dynamics might be playing a role in determining wage effects within and across occupations.
Figure 1
Weighted Cross-Occupation Average for Select Components of the Autor’s
Task Indices, 2004-12
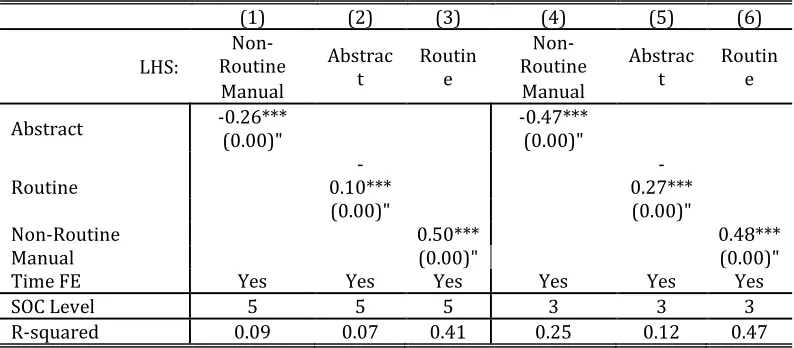
One particular concern with the task indices might be
cross-correlation between the components. Specifically, the application of our Roy-type model relies on the assumption that these indices capture distinct characteristics of how an occupation accomplishes production. Table 3 reports the results from a cross-sectional regression of the bivariate relationships between each of the indices at the 3 and 5-digit SOC levels of aggregation. The signs indicate a relationship between the variables that align with that presented by Autor and Handel (2013) using self-reported levels of task engagement. Specifically, there is a negative correlation between engagement in abstract and non-routine manual tasks as well as between abstract tasks and routine tasks. The correlation between routine
25% 35% 45% 55% 65% 75% 7/20 04 1/20 05 7/20 05 1/20 06 7/20 06 1/20 07 7/20 07 5/20 08 11 /2 00 8 5/20 09 11 /2 00 9 5/20 10 11 /2 01 0 5/20 11 11 /2 01 1 5/20 12 Per cen t o f Po ss ib le V al u e fo r Wei gh ted Cr o ss -Oc cup at io n Tas k In d ices
and non-routine manual tasks, on the other hand, is positive and largest in magnitude.
Table 3
Cross-sectional Regressions of Bivariate Relationships between O*NET Indices
(1) (2) (3) (4) (5) (6)
LHS:
Non-Routine Abstrac t
Routin e
Non-Routine Abstrac t
Routin e
Manual Manual
Abstract -0.26*** -0.47*** (0.00)" (0.00)" Routine
-0.10***
-0.27*** (0.00)" (0.00)" Non-Routine
Manual
0.50*** 0.48***
(0.00)" (0.00)"
Time FE Yes Yes Yes Yes Yes Yes
SOC Level 5 5 5 3 3 3
R-squared 0.09 0.07 0.41 0.25 0.12 0.47
Note 1: The coefficients are presented along with their level of significant. A coefficient concatenated with *
represents a p-value ≤ .1, ** represents a p-value ≤ .05, and *** represents a p-value ≤ .01 significance.
Note 2: The results presented cluster standard errors at the occupation level.
Note 3: The variables used in this table are the standardized value of the sum of the raw O*NET task measures.
V. Estimation Results
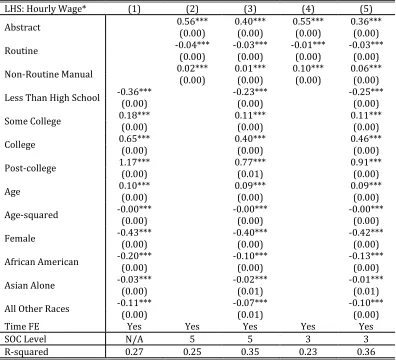
We pool the panel data to perform an OLS regression using an
Table 4
Pooled Regression of Standardized Hourly Wage on O*NET Task Indices
LHS: Hourly Wage* (1) (2) (3) (4) (5) Abstract 0.56*** 0.40*** 0.55*** 0.36***
(0.00) (0.00) (0.00) (0.00) Routine -0.04*** -0.03*** -0.01*** -0.03***
(0.00) (0.00) (0.00) (0.00) Non-Routine Manual 0.02*** 0.01*** 0.10*** 0.06***
(0.00) (0.00) (0.00) (0.00) Less Than High School -0.36*** -0.23*** -0.25***
(0.00) (0.00) (0.00) Some College 0.18*** 0.11*** 0.11***
(0.00) (0.00) (0.00) College 0.65*** 0.40*** 0.46***
(0.00) (0.00) (0.00) Post-college 1.17*** 0.77*** 0.91***
(0.00) (0.01) (0.00)
Age 0.10*** 0.09*** 0.09***
(0.00) (0.00) (0.00) Age-squared -0.00*** -0.00*** -0.00***
(0.00) (0.00) (0.00) Female -0.43*** -0.40*** -0.42***
(0.00) (0.00) (0.00) African American -0.20*** -0.10*** -0.13***
(0.00) (0.00) (0.00) Asian Alone -0.03*** -0.02*** -0.01***
(0.00) (0.01) (0.01) All Other Races -0.11*** -0.07*** -0.10***
(0.00) (0.01) (0.00)
Time FE Yes Yes Yes Yes Yes
SOC Level N/A 5 5 3 3
R-squared 0.27 0.25 0.35 0.23 0.36
*The left hand side variable is the standardized value of hourly wages.
Note 1: The coefficients are presented along with their level of significant. A coefficient concatenated with *
represents a p-value ≤ .1, ** represents a p-value ≤ .05, and *** represents a p-value ≤ .01 significance.
Note 2: The results presented cluster standard errors at the individual level. The results are also robust to clustering at the occupation level.
coefficient is .55 and statistically significant at the 3-digit level but drops to .36 when the controls are added. The results indicate that as the mean level of engagement in abstract tasks increases across occupations, it is matched by an increase in the relative wage level.
At the 5-digit level and without controls, we can interpret a one standard deviation increase in the routine task index as resulting in .04 of a standard deviation decrease in hourly wages. After adding controls to the 5-digit specification, we see that the coefficient on the routine task index drops in magnitude to .03 but remains statistically significant in both specifications. Similarly, the coefficient indicates a negative relationship of only .01 and statistically significant at the 3-digit level but increases to .03 when the controls are added. The results indicate that as the mean level of engagement in routine tasks increases across occupations, it is matched by a decrease in the relative wage level.
Again, we can interpret a one standard deviation increase in the non-routine manual task index as resulting in .02 of a standard deviation decrease in hourly wages when estimated without controls at the 5-digit level. After adding controls to the 5-digit specification, we see that the coefficient on the routine task index drops in magnitude to .01 but remains statistically
significant in both specifications. Similarly, the coefficient is .10 and
statistically significant at the 3-digit level but drops to .06 when the controls are added. The results indicate that as the mean level of engagement in non-routine manual tasks increases across occupations, it is matched by an increase in the relative wage level.
capital in the production process. The result is that these occupations, whether they require high cognitive ability (Abstract) or simply irregular physical movements and decision making (Non-routine Manual), experience higher relative wages than occupations less involved in tasks with these characteristics. The results in Table 4, however, are presented only for illustrative purposes. As mentioned, it is unclear where the variation is coming from in the results obtained from the pooled cross-section. It could be that variation in wages is coming from differences in relative levels of task engagement across occupations as well as through changes occurring within occupations over time.
Figure 2
Rolling Cross-sectional Regressions of Hourly Wage on O*NET Task Indices at the 3-digit SOC Level
*The left hand side variable is the standardized value of hourly wages.
Note 1: The coefficients are only presented when they were found to have a p-value that was at least the .1 level of significance.
Note 2: The sample was restricted to individuals who remained in the entire sample.
To explore the potential importance of using panel data and methods, the same OLS specification is similarly applied for data from each
-0.2 0 0.2 0.4 0.6 12/20 03 6/ 200 4 12/20 04 6/ 200 5 12/20 05 6/ 200 6 12/20 06 6/ 200 7 12/20 07 6/ 200 8 12/20 08 6/ 200 9 12/20 09 6/ 201 0 12/20 10 6/ 201 1 12/20 11 6/ 201 2 C o ef fic ie nt o f S tan d ar d iz ed T a sk In di ce s o n S tan d ar di ze d H o ur ly Wa g e
observation month in the panel at the 3-digit SOC aggregation level. The results of this set of OLS regressions are presented in Figure 2. Although the ordering of the impact of the task indices on wages is preserved across time, it is clear from the figure that the return to the three task indices varies markedly over time. It also appears that the estimated returns are responsive to fluctuations in the business cycle.
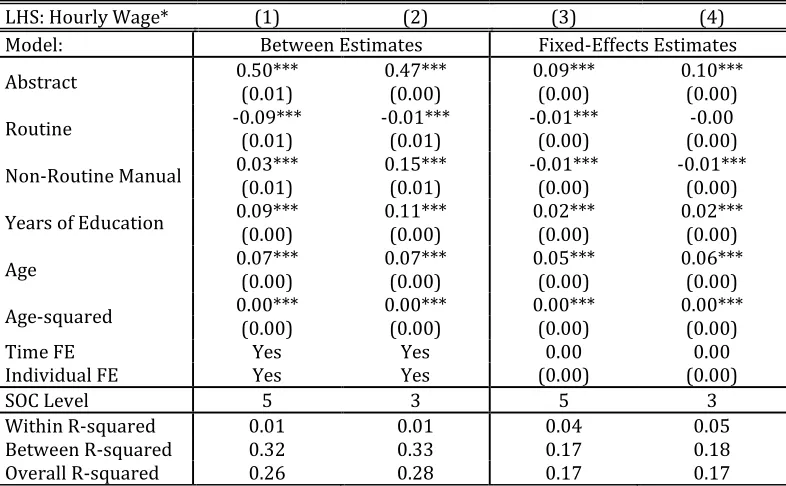
To begin making use of the panel data, we provide a between estimate for individuals in Table 5 and presenting it alongside a traditional fixed-effects estimate of the variation from within individuals. The coefficients on the three task indices for the between estimation can be interpreted as the variation in returns to task engagement across occupations from our panel. The traditional fixed-effects estimates (specifications 3 and 4), on the other hand, regresses deviations in their standardized hourly wage on deviations from the mean value of each variable. The coefficients on the three task indices with the fixed-effects estimates can be interpreted as the variation occurring from changes within occupations. We would note that the
individual fixed-effects also control for average effects for individuals who do not change occupations.
The first and second specifications in Table 5 report that a one standard deviation difference in the abstract index between occupations corresponds with a 0.50 standard deviation increase in hourly wages at the 5-digit SOC level and a 0.47 standard deviation increase at the 3-digit SOC level. These specifications report that as engagement in the routine index between occupations increases by one standard deviation, wages decrease by 0.09 standard deviations at the 5-digit SOC level and 0.01 standard
0.03 increase in wages at the 5-digit SOC level and a 0.15 increase in wages at the 3-digit SOC level. The between occupation variation observed in our panel corresponds with the SBTC hypothesis where occupations with engagement in less easily codified tasks are characterized by relatively higher wages because of historic and current trends in technological progress. The magnitudes of these between estimates are also similar to those found in Table 4 where OLS estimates are provided.
Table 5
Between and Within Effects Regressions of Standardized Hourly Wage on O*NET Task Indices
LHS: Hourly Wage* (1) (2) (3) (4) Model: Between Estimates Fixed-Effects Estimates Abstract 0.50*** 0.47*** 0.09*** 0.10***
(0.01) (0.00) (0.00) (0.00) Routine -0.09*** -0.01*** -0.01*** -0.00
(0.01) (0.01) (0.00) (0.00) Non-Routine Manual 0.03*** 0.15*** -0.01*** -0.01***
(0.01) (0.01) (0.00) (0.00) Years of Education 0.09*** 0.11*** 0.02*** 0.02***
(0.00) (0.00) (0.00) (0.00) Age 0.07*** 0.07*** 0.05*** 0.06***
(0.00) (0.00) (0.00) (0.00) Age-squared 0.00*** 0.00*** 0.00*** 0.00***
(0.00) (0.00) (0.00) (0.00)
Time FE Yes Yes 0.00 0.00
Individual FE Yes Yes (0.00) (0.00)
SOC Level 5 3 5 3
Within R-squared 0.01 0.01 0.04 0.05 Between R-squared 0.32 0.33 0.17 0.18 Overall R-squared 0.26 0.28 0.17 0.17
*The left hand side variable is the standardized value of log hourly wages.
Note 1: The coefficients are presented along with their level of significant. A coefficient concatenated with *
represents a p-value ≤ .1, ** represents a p-value ≤ .05, and *** represents a p-value ≤ .01 significance.
Note 2: The results presented cluster standard errors at the individual level. The results are also robust to clustering at the occupation level.
accounting for constant unobserved heterogeneity, the direction of the variation from changing task requirements within occupations is consistent with the estimates across occupations but that the magnitude of the
estimates are considerably smaller. The association of the abstract task index with wages falls by more than three quarters when the individual level fixed-effects are added (using 3 or 5-digit levels of analysis) in comparison to the OLS specifications in Table 4. Similarly, the parameters associated with routine tasks (for the 5-digit level of aggregation) also fall significantly. The parameters associated with non-routine manual tasks also decline using either the 3 or 5-digit levels of aggregation in the analysis. Thus, controlling for unobserved, time invariant heterogeneity sharply reduces the association between wages and the task measures.
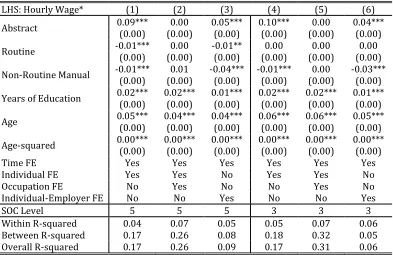
We further investigate the identification of the wage premiums associated with task content by adding additional fixed-effects for specific individuals within jobs and for occupations in Table 6. The job specific fixed-effects for each individual allow us to see if the association between wages and task measures is driven by variation associated with people changing employers. Similarly, while the individual fixed-effects implicitly reduce variation associated with remaining with a specific employer and occupation over time, the addition of occupation fixed-effects further removes variation in the data that would be related to individuals changing occupations over
time – distinct from changing employers.
fixed-effects that control for wage effects that would be experienced by individuals who change occupations in the panel. These specifications allow for wage effects from changing jobs but maintaining the same occupation. The third and sixth specifications include individual-employer (i.e. job spell)
fixed-effects that control for additional variation in an individual’s wage that
[image:31.612.112.505.331.586.2]might arise from changing employers. These specifications allow for wage effects from changing occupations but maintaining the same employer.
Table 6
Fixed-Effects Regressions of Standardized Hourly Wage on O*NET Task Indices
LHS: Hourly Wage* (1) (2) (3) (4) (5) (6) Abstract 0.09*** 0.00 0.05*** 0.10*** 0.00 0.04***
(0.00) (0.00) (0.00) (0.00) (0.00) (0.00) Routine -0.01*** 0.00 -0.01** 0.00 0.00 0.00
(0.00) (0.00) (0.00) (0.00) (0.00) (0.00) Non-Routine Manual -0.01*** 0.01 -0.04*** -0.01*** 0.00 -0.03***
(0.00) (0.00) (0.00) (0.00) (0.00) (0.00) Years of Education 0.02*** 0.02*** 0.01*** 0.02*** 0.02*** 0.01***
(0.00) (0.00) (0.00) (0.00) (0.00) (0.00) Age 0.05*** 0.04*** 0.04*** 0.06*** 0.06*** 0.05***
(0.00) (0.00) (0.00) (0.00) (0.00) (0.00) Age-squared 0.00*** 0.00*** 0.00*** 0.00*** 0.00*** 0.00***
(0.00) (0.00) (0.00) (0.00) (0.00) (0.00)
Time FE Yes Yes Yes Yes Yes Yes
Individual FE Yes Yes No Yes Yes No Occupation FE No Yes No No Yes No Individual-Employer FE No No Yes No No Yes
SOC Level 5 5 5 3 3 3
Within R-squared 0.04 0.07 0.05 0.05 0.07 0.06 Between R-squared 0.17 0.26 0.08 0.18 0.32 0.05 Overall R-squared 0.17 0.26 0.09 0.17 0.31 0.06
*The left hand side variable is the standardized value of log hourly wages.
Note 1: The coefficients are presented along with their level of significant. A coefficient concatenated with *
represents a p-value ≤ .1, ** represents a p-value ≤ .05, and *** represents a p-value ≤ .01 significance.
The second and fifth specifications presented in Table 6 include both an individual and occupation fixed-effect. This fixed-effect controls for each individual in the sample separately for each occupation they are observed working. The baseline coefficient estimates from specifications 1 and 5 become statistically insignificant when these controls are added. We
interpret the contrast between the results with and without the occupation controls as indicating that the results observed in the baseline fixed-effects estimates were driven by variation in wage premiums for individuals associated with changing occupations within the panel. One implication of this result is that wages of incumbent workers do not appear responsive to within occupation changes in the way production is accomplished.
The third and sixth specifications in Table 6 explore whether
controlling for individual-employer fixed-effects (at the 3 and 5-digit levels of aggregation) for each individual has an important impact on the baseline coefficients for the the task indices. As can be seen in Table 6, individuals who stay with the same employer experience wage premiums of roughly half the magnitude observed in the baseline estimates. As mentioned, our
individual-employer fixed-effects controls do not, however, control for individuals who change occupations within the same employer.
VI. Robustness Checks
The results presented in this analysis suggest that patterns of
association between task content and wages are largely driven by mobility of workers moving across or into occupations and that this is partially
from three robustness checks of these core results. The first robustness check extends the original monthly interval between observations from a single month to eight months. The second robustness check assigns a Cobb-Douglas weighting to variables from the work abilities measures from the O*NET database. The third check develops alternative task indices, rather than using the three task indices from Autor et al. (2013. These robustness checks provide additional confirmation of the core findings of the paper.
Table 7
Fixed-Effects Regressions of Standardized Hourly Wage on O*NET Task Indices with an Eight Month Interval between Observations
LHS: Hourly Wage* (1) (2) (3) (4)
Model: Between Estimates Fixed-Effects Estimates Abstract 0.50*** 0.09*** 0.00 0.03***
(0.01) (0.01) (0.01) (0.01) Routine -0.09*** -0.02*** 0.00 -0.01
(0.01) (0.01) (0.01) (0.01) Non-Routine Manual 0.03*** -0.02*** 0.01 -0.03***
(0.01) (0.01) (0.01) (0.01) Years of Education 0.09*** 0.02*** 0.02*** 0.01
(0.00) (0.01) (0.01) (0.01) Age 0.08*** 0.05*** 0.04*** 0.03***
(0.00) (0.00) (0.00) (0.00) Age-squared 0.00*** 0.00*** 0.00*** 0.00***
(0.00) (0.00) (0.00) (0.00)
Time FE Yes Yes Yes Yes
Individual FE Yes Yes Yes No
Occupation FE No No Yes No
Individual-Employer FE No No No Yes
SOC Level 5 5 5 5
Within R-squared 0.02 0.07 0.07 0.05 Between R-squared 0.32 0.18 0.19 0.02 Overall R-squared 0.31 0.18 0.19 0.03
*The left hand side variable is the standardized value of log hourly wages.
Note 1: The coefficients are presented along with their level of significant. A coefficient concatenated with *
represents a p-value ≤ .1, ** represents a p-value ≤ .05, and *** represents a p-value ≤ .01 significance.
Note 2: Each observation is limited to the reference month and reported at eight month intervals. The overall results are also robust to a four and twelve month interval.
Tables 5 and 6. The only distinction between the two tables is the interval between observations. Each respondent in the SIPP is interviewed every four months and asked to report information about the current month (referred to as the reference month) and recall information about the past three months. Table 7 limits the observations to only those observations that were collected and reported for every second reference month. Thus, the
[image:34.612.109.505.354.617.2]observations on each individual span an 8-month gap. The results presented in Table 7 indicate that the results are robust to this change in specification.
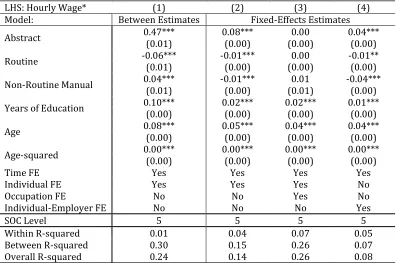
Table 8
Fixed-Effects Regressions of Standardized Hourly Wage on O*NET Task Indices with Cobb-Douglas Weights
LHS: Hourly Wage* (1) (2) (3) (4)
Model: Between Estimates Fixed-Effects Estimates Abstract 0.47*** 0.08*** 0.00 0.04***
(0.01) (0.00) (0.00) (0.00) Routine -0.06*** -0.01*** 0.00 -0.01**
(0.01) (0.00) (0.00) (0.00) Non-Routine Manual 0.04*** -0.01*** 0.01 -0.04***
(0.01) (0.00) (0.01) (0.00) Years of Education 0.10*** 0.02*** 0.02*** 0.01***
(0.00) (0.00) (0.00) (0.00) Age 0.08*** 0.05*** 0.04*** 0.04***
(0.00) (0.00) (0.00) (0.00) Age-squared 0.00*** 0.00*** 0.00*** 0.00***
(0.00) (0.00) (0.00) (0.00)
Time FE Yes Yes Yes Yes
Individual FE Yes Yes Yes No
Occupation FE No No Yes No
Individual-Employer FE No No No Yes
SOC Level 5 5 5 5
Within R-squared 0.01 0.04 0.07 0.05 Between R-squared 0.30 0.15 0.26 0.07 Overall R-squared 0.24 0.14 0.26 0.08
*The left hand side variable is the standardized value of log hourly wages.
Note 1: The coefficients are presented along with their level of significant. A coefficient concatenated with *
Table 8 presents results at the 5-digit SOC level using the same empirical model and specifications used to produce the results reported in Table 5 and 6. The only distinction between the two tables is that the indices are constructed by assigning a Cobb-Douglas weight to the scales for
variables from the work abilities section of the O*NET database. Following Blinder (2007) and Firpo et al. (2011), we assign a Cobb-Douglas weight of two thirds to importance and one third to level. The results presented in Table 8 indicate that the results are robust to this change in specification.
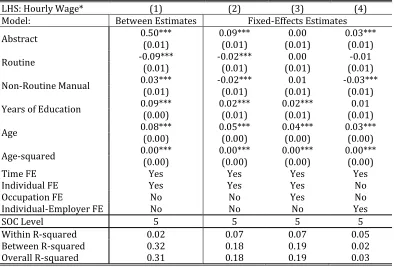
The third robustness check provided involves replacing the three task indices used in the original analysis with three task indices created from a distinct set of O*NET variables. The full set of variables used in this index is presented in Table 9. These indices were constructed with the intent of assuaging any concern that the results might be driven by the selection of the underlying O*NET measures. The task measures were weighted using the Cobb-Douglas structure, trended, and combined into the three task indices using the first component of a principal components analysis. The
[image:35.612.105.508.526.648.2]standardized values of these task indices were used as the primary explanatory variables in this final robustness check.
Table 9
O*NET Task Indices Constructed with Alternate Measures
Abstract
Work With Work Group or Team Getting Information
Information Ordering
Routine
Rate Control
Degree of Automation
Frequency of Decision Making
Non-Routine Manual
Control Precision
The results reported in Table 10 qualitatively replicate those shown in Table 6. The key distinction between these two estimates is that the task indices were constructed from a significantly different set of underlying O*NET variables. This alternative specification provides additional evidence that our initial findings are robust to reasonable alternative methods of constructing the task indices.
Table 10
Fixed-Effects Regressions of Standardized Hourly Wage on O*NET Task Indices with Alternative Measures
LHS: Hourly Wage* (1) (2) (3) (4)
Model: Between Estimates Fixed-Effects Estimates Abstract 0.35*** 0.07*** 0.00 0.01***
(0.01) (0.00) (0.00) (0.00) Routine -0.06*** -0.01*** 0.00 0.01***
(0.01) (0.00) (0.00) (0.00) Non-Routine Manual 0.05*** -0.00** 0.01 -0.03***
(0.01) (0.00) (0.01) (0.00) Years of Education 0.10*** 0.02*** 0.02*** 0.01***
(0.00) (0.00) (0.00) (0.00) Age 0.08*** 0.05*** 0.04*** 0.04***
(0.00) (0.00) (0.00) (0.00) Age-squared 0.00*** 0.00*** 0.00*** 0.00***
(0.00) (0.00) (0.00) (0.00)
Time FE Yes Yes Yes Yes
Individual FE Yes Yes Yes No
Occupation FE No No Yes No
Individual-Employer FE No No No Yes
SOC Level 5 5 5 5
Within R-squared 0.01 0.04 0.07 0.05 Between R-squared 0.27 0.12 0.22 0.04 Overall R-squared 0.20 0.12 0.22 0.05
*The left hand side variable is the standardized value of log hourly wages.
Note 1: The coefficients are presented along with their level of significant. A coefficient concatenated with *
VII. Conclusions
In this study, panel measures of occupational task engagement are developed and attached to panel data on workers to explore the source of wage premiums for routine and non-routine tasks. The OLS regressions pooling the data confirm prior findings in terms of the ordering of the coefficients. However, it was also demonstrated using individual months of data from the available panel a single cross-section of task measures cannot fully capture the dynamics of evolving occupational wage premiums.
The source of the observed wage premiums are further explored by applying a traditional fixed-effects model that captures the variation from evolving task engagement within occupations. When unobserved individual attributes are controlled for using the panel fixed-effect model, the same wage patterns that appeared in the cross-sectional estimates are observed but are sharply attenuated. Additional fixed-effects were included in the model to investigate the extent to which wage premiums are associated with changes in the way occupations accomplish production (as observed through changes in the underlying task measures) and by movement of workers across occupations or employers.
occupations while remaining with their current employer or moving to a new one.
The framework developed in this analysis allows for a wide range of additional applications. Specifically, the panel of occupational task measures can be used to answer a variety of question related to how the nature of occupational employment has changed over the last decade. A panel that captures changes in the way occupations accomplish production might help better understand observed shifts in the wage distribution. Future studies might also rely on a similar estimation strategy to the one employed here in order to investigate how within occupation changes to these same task measures might be predictive of employment transitions.
References
Acemoglu, Daron & David H. Autor. 2010. Skills, Tasks and Technologies:
Implications for Employment and Earnings. NBER Working Papers 16082, National
Bureau of Economic Research, Inc.
Autor, David H. & Lawrence F. Katz & Alan B. Krueger. 1998. Computing Inequality:
Have Computers Changed The Labor Market? The Quarterly Journal of Economics.
MIT Press, vol. 113(4) (November): 1169-1213
Autor, David H. & Frank Levy & Richard J. Murnane, 2003. The Skill Content Of
Recent Technological Change: An Empirical Exploration. The Quarterly Journal of
Economics. MIT Press, vol. 118(4). (November):1279-1333
Autor, David H. & Lawrence F. Katz & Melissa S. Kearney. 2005. Trends in U.S. Wage
Inequality: Re-Assessing the Revisionists. NBER Working Papers 11627, National
Autor, David H. 2013. The “Task Approach” to Labor Markets: An Overview. Journal
of Labour Market Research.
Autor, David H. & Michael J. Handel. 2013. Putting Tasks to the Test: Human Capital,
Job Tasks, and Wages. Journal of Labor Economics. University of Chicago Press, vol.
31(S1): S59 - S96.
Autor, David H. 2014. Polanyi's Paradox and the Shape of Employment Growth.
NBER Working Papers 20485, National Bureau of Economic Research, Inc.
Altonji, Joseph G. & Lisa B. Kahn & Jamin D. Speer. 2014. Trends in Earnings
Differentials across College Majors and the Changing Task Composition of Jobs.
American Economic Review. American Economic Association, vol. 104(5) (May):
387-93
Blinder, Alan S. 2007. How Many Jobs Might be Offshorable? Center for Economic
Policy Studies Working Discussion Paper no. 142, Princeton University.
Firpo, Sergio & Nicole M. Fortin & Thomas Lemieux. 2011. Occupational Tasks and
Changes in the Wage Structure. IZA Discussion Papers 5542, Institute for the Study
of Labor (IZA).
Gathmann, Christina & Uta Schönberg. 2010. How General Is Human Capital? A
Task-Based Approach. Journal of Labor Economics. University of Chicago Press, vol.
28(1): 1-49, 01.
Jensen, Bradford J. & Lori G. Kletzer. 2010. Measuring Tradable Services and the
Task Content of Offshorable Services Jobs. NBER Chapters, in: Labor in the New
Economy, National Bureau of Economic Research: 309-335
Katz, Lawrence F. & Kevin M. Murphy. 1992. "Changes in Relative Wages,
1963-1987: Supply and Demand Factors. The Quarterly Journal of Economics. MIT Press,
Yamaguchi, Shintaro. 2011. Tasks and Heterogeneous Human Capital. Journal of
Appendix (For Online Publication Only)
Individual Worker Panel: Survey of Income Program Participation
The Survey of Income Program Participation (SIPP) was used to construct the individual panel in the analysis. The SIPP is a household-based survey designed as a continuous representative series of national panels where the same individuals are interviewed over a multi-year period lasting approximately four years. The SIPP is the only available individual panel that has the necessary components to conduct this analysis. The SIPP has more detailed occupational codes, more frequent interviews, and a larger sample compared to the Current Population Survey and the Panel Study of Income Dynamics. Although the occupational codes are similar to that reported in the National Longitudinal Survey of Youth, the SIPP has much more frequent interviews and a larger sample.
The 2004 and 2008 SIPP panels were combined to create an
unbalanced panel of approximately two million observations. Specifically, the combined panel spanned the period from February 2004 through December 2012 with some months missing due to breaks in the survey. The sample was restricted to prime working age individuals between 25 and 55 years of age who were not in the military. The combined panels had a total of 94,636 prime working age individuals observed on average 26 times each for a total of 2,200,536 observations.
observation month by the number of weeks worked in the month and the
number of usual hours worked. The characteristics of each individual’s
primary job were the only ones utilized in the analysis. Any information on
an individual’s secondary job as well as information pertaining to self-employed individuals was not included in the analysis.
Occupational Task Requirement Panel: Occupational Information Network and Occupational Employment Statistics
The panel of occupational task requirements was constructed using 17 releases of the Occupational Information Network (O*NET) developer database. The data from the O*NET database were combined with 13 releases of the Occupational Employment Statistics (O*NET) national
employment estimates. The 17 releases of the O*NET database spanned from November 2003 through July 2013 were combined with 13 releases of the OES estimates from November 2003 to May 2012. The O*NET employment figures were used only to weight the O*NET task requirements so that they could be utilized at different occupational aggregation levels.
The 6-digit national OES data was first combined to form a panel with observations corresponding to the 13 release dates. Employment was then linearly trended by occupation to form monthly estimates between the actual OES release months. Those months from the newly formed OES trend
estimates that matched the O*NET release months were combined upwards to create a 5,4,3, and 2-digit version of the original O*NET panel. These higher level versions of the O*NET panel were then again trended monthly to create a panel that corresponded with the observations in the SIPP panel. Following Yamaguchi (2012) we use principal components analysis to create each of the three task indices at the 2 and 3-digit SOC aggregation level.
Appendix Figure 1
Weighted Cross-Occupation Average for Components of the Abstract Task Index 2004-12 0 1 2 3 4 5 7/20 04 1/20 05 7/20 05 1/20 06 7/20 06 1/20 07 7/20 07 5/20 08 11 /2 00 8 5/20 09 11 /2 00 9 5/20 10 11 /2 01 0 5/20 11 11 /2 01 1 5/20 12 Weigh ted C ros s -O ccu p a tio na l Ave ra ge of O *N ET Ta sk Me a su res
Analyzing Data or Information Thinking Creatively
Appendix Figure 2
Weighted Cross-Occupation Average for Components of the Routine Task Index 2004-12
Appendix Figure 3
Weighted Cross-Occupation Average for Components of the Non-Routine Manual Task Index 2004-12
0 1 2 3 4 5 7/20 04 1/20 05 7/20 05 1/20 06 7/20 06 1/20 07 7/20 07 5/20 08 11 /2 00 8 5/20 09 11 /2 00 9 5/20 10 11 /2 01 0 5/20 11 11 /2 01 1 5/20 12 Weigh ted C ros s -O ccu p a tio na l Ave ra ge of O *N ET Ta sk Me a su res
Controlling Machines and Processes Spend Time Making Repetitive Motions
Importance of Being Exact or Accurate Importance of Repeating Same Tasks
Structured versus Unstructured Work Pace Determined by Speed of Equipment
0 1 2 3 4 5 7/20 04 1/20 05 7/20 05 1/20 06 7/20 06 1/20 07 7/20 07 5/20 08 11 /2 00 8 5/20 09 11 /2 00 9 5/20 10 11 /2 01 0 5/20 11 11 /2 01 1 5/20 12 Weigh ted C ros s -O ccu p a tio na l Ave ra ge of O *N ET Ta sk Me a su res
Spatial Orientation Manual Dexterity