http://www.scirp.org/journal/ojapps ISSN Online: 2165-3925
ISSN Print: 2165-3917
Role of Canal Lining on Groundwater
Fluctuations: A Modeling Simulation Approach
for Jaalwala Distributary, Bahawalnagar
Muhammad Hammad Atique Khan1, Muhammad Usman Saleem2, Sajid Rashid Ahmad2, Nasir Ahmad1, Shahid Jamil Sameeni1, Muhammad Akram3, Muhammad Farooq3
1Institute of Geology, University of the Punjab, Lahore, Pakistan
2Collage of Earth and Environmental Sciences, University of the Punjab, Lahore, Pakistan 3Irrigation Department, Government of Pakistan, Lahore, Pakistan
Abstract
Jaalwala Distributary was selected to see the consequences of concrete lining on the underlying saline groundwater table. Its middle and tail portions were concrete lined whereas the head portion was still unlined. Visual MODFLOW 2011.1 was used to simulate the effects of concrete lining on saline groundwa-ter in two-dimensional format. Simulation results showed a gradual rise of electrical conductivity (EC) up to 7000 µS/cm and decline in water table depth to nine feet (2.74 m). It observed negligible inflows from the distributary through its western boundary due to formation of a permanent barrier in the way of seepage of any kind. Results have further predicted that freshwater layer available beneath the Jaalwala Distributary (before its lining) will finish ultimately and the below present saline water also move upward to take this vacated place. Hence it was concluded to line the canals of saline water areas from their sides which will not only protect them from erosion but canal wa-ter theft as well.
Keywords
Water Balance, Jaalwala Distributary, Saline Water Intrusion, Hydrostatic Pressure and Interface
1. Introduction
Dependency of our lives on water cannot be overlooked. It not only exists on the surface of the earth in so many forms but is also present below the lithosphere, having linkages with each other [1]. Apart from natural activities, groundwater was also restored artificially by surplus irrigation, seepage from man-built water How to cite this paper: Khan, M.H.A.,
Saleem, M.U., Ahmad, S.R., Ahmad, N., Sameeni, S.J., Akram, M. and Farooq, M. (2017) Role of Canal Lining on Groundwa-ter Fluctuations: A Modeling Simulation Approach for Jaalwala Distributary, Baha-walnagar. Open Journal of Applied Sciences, 7, 213-232.
https://doi.org/10.4236/ojapps.2017.75019
Received: January 2, 2017 Accepted: May 28, 2017 Published: May 31, 2017
Copyright © 2017 by authors and Scientific Research Publishing Inc. This work is licensed under the Creative Commons Attribution International License (CC BY 4.0).
ways, and water applied intentionally to supplement it [2]. All the ancient em-pires were established near or along some perpetual water sources [3]. The total quantity of water on earth remains the same though it changes from one form to another. It exists as liquid at room temperature, in gaseous state above its boiling point and as solid in the form of snow, hail or ice subject to the temperature, pressure and elevation of that place [4]. Good quality of water found on surface or beneath this earth collectively constitute to the freshwater resources of this planet [5].
Canals were human-made channels used for conveying water to irrigate fields and gardens which navigate on a small or large scale. The history of excavation of canals goes back to at least three thousand years as can be traced in the foot-prints of Nineveh and Babul civilizations. Theory of flow of fluids was put for-ward by Torricelli in 1643. It was the Kennedy who excavated a canal in the In-do-Pak Subcontinent (in the late 19th century) which carried silt-ridden water in it [6]. These canals were designed in such a way that the silt flowing in these channels were unable to damage their sides, wear down their banks or clog them by being dropped in their middle thus jeopardizing their operations [7].
In order to safeguard a canal against any physical damage streamline its gra-dient offers resistance against infiltration and transport the allocated amount of water to reach its ends. Canal lining has an addition advantage in strengthening the banks of canals, checking the growth of weeds and algae in them and lessen-ing the seepage losses that caused in the earthen channels [8]. Seepage of water from the earthen structure of Bari Doab Canal in India was taken as an engi-neering failure when it started operation in 1859. Many suggestions to curtail this outflow from the earthen boundaries of this canal were put forward but the most popular and feasible approach was to line this canal altogether with con-crete. This was adopted as it minimized the incidents of breaches in the canal structure and acquisition of additional valuable agricultural land was not in-volved thereby a saving to the government exchequer [9][10].
The main purpose behind lining of various main canals, distributaries and minors in Pakistan is to reduce seepage losses from the initially excavated ear-then canals along with improving their hydraulic performance, reduction in their operation costs, stoppage of canal-water theft, and delivery of freshwater right into the field of the farmers [11].
Materials used for lining the canals must be of sufficient strength and quality to resist the pressure caused by the flowing water. It also prevents seepage from canal sides and bed so that the hydraulic structure remains safeguarded [12]. Different materials like bricks, cement or concrete were used for lining the can-als in Pakistan. These constituents have their own capacities: reduce the quantity of seepage from their surfaces, decrease the eroding capacity of canal banks from its water, minimize the chances of breach from the high discharged water, allow minimal weeds growth along their sides and minimize the cost of their main-tenance [6] (Table 1).
Table 1. Impact of different lining materials used for reducing the rate of seepage [6].
Types of lining material
Initial rate of seepage
Stabilized rate of seepage
Cusecs per million square foot
No Material (Earthen/ Unlined) 22.4 10.26
Cement, Lime and Brick Ballast (1:5:12) 1.05 0.125 Cement and Sand (1:3) Mortar sandwiched
between the two 0.507 0.027
4” thick Concrete, Sand and Brick Ballast (1:1:3) 0.367 0.02 4” thick Concrete, Lime, Brick Ballast (5:12:24) 1.223 0.39
land surface where it is either permeable and has ruptures or flaws. After the de-velopment of canal irrigation in this region the rate of percolation increased ma-nifolds from these porous surfaces thus making the water come up within a few feet from the land [13]. Apart from the acts of nature aquifers of the Indus Val-ley River System (IVRS) were restored artificially by activities like surplus irriga-tion, seepage from waterways and water applied intentionally to supplement them [2][14]. Seepage from unlined channels not only helps recharge the aqui-fers of the Indus Valley but also was a source of clean and fresh water for all the dwellers living along such waterways [15].
Before the excavation of canals in the IVRS water table of various aquifers was quite deep that enjoyed a dynamic balance of inflows and outflows of percolated water into them. This was disturbed with the addition of a constant source of seeped fresh water from the earthen canals making the water of canal irrigated areas rise at an average rate of 1.5 ft. per year thereby making these areas water-logged by the late 1930 (Table 1). When this standing water in the fields sub-sided because of evaporation and less reclamation supplies from the canals the land was left with a covered surface of accumulated salts. It was believed that these salts came up to the ground surface along with the rising groundwater un-til research during 1937 revealed that they were present in the soil which mixed with the upcoming groundwater and were left on the ground with the subsi-dence of this water [7].
Canals in Pakistan were excavated as earthen (unlined) channels which not only reduce the cost of these projects but have an additional benefit of recharg-ing the groundwater with its freshwater outflows. In areas havrecharg-ing freshwater aquifers seepage from the flowing canals was accepted by the underlying aquifer as such and they become part of it however in the saline water zones such seeped freshwater from the earthen channels is not assimilated in these saline water aquifers but remain above their upper surface as an independent entity. This layers of seeped freshwater presses the saline water (Table 1) downwards be-cause of difference in their densities and hydrostatic pressure. This layer of freshwater was not only used by the community for its domestic purposes but is taken by animals and plants besides irrigating the farm fields. However, lining these canals hinder the seepage and recharge of groundwater resulting either in lowering of fresh water or rise of saline water from below. These results in dis-turbance of water balance of that area forcing the farmers to use both canal and underground water to cater for their needs [8][14].
A lens of fresh water was formed below the running unlined canal and above the underlying saline aquifer which has a distinct interface formed as a result of variance in their gravities. The width of this freshwater layer formed below the operational earthen canals decrease with their distance away from these channels (Table 1) in small oceanic islands where the thickness of fresh water layer float-ing above the salty seawater decrease towards the coast [2][14]
Like all other countries distribution of freshwater was not even in Pakistan. It was surplus in some places while scanty at others. There was also plenty of water available in some seasons whereas it is rare in others. The gap between demand and supply of water as a result of rise in population was more than ten percent in the beginning of this century (2000) which is likely to go up to three times by 2025 due to non-construction of new reservoirs and hence non-replenishment of groundwater [4]. Per capita availability of water in 1951 was more than five thousand cubic meters which has dwindled to thirteen hundred cubic meters [18].
This groundwater study aims to develop a simulated flow model for the canal command area (CCA) of Jaalwala Distributary located at Bahawalnagar, Pakis-tan in a two-dimensional format. It will focus on the reasons behind shrinking and completely diminishing of freshwater layer below the Jaalwala Distributary. Details regarding rise of saline water to the natural surface level (NSL) and fluc-tuations being taking place in the dimensions of the freshwater layer present be-low the Jaalwala Distributary before and after its concrete lining.
In the following sections study area, methods and methodology, results with conclusion will explained.
2. Study Area
the Lower Indus Plain (LIP) which mainly dry and arid having very warm sum-mers and cold winters with scanty rainfall. Jaalwala Distributary is an offshoot of Eastern Sadiqia Canal originating from its RD: 219 + 500/R (reduce distance number 219 plus 500 feet and 1 RD = 1000 ft). It has a length of 29 km with an authorized full supply discharge of 112 Cusecs operating on perennial basis de-pending on the availability of water. The total lined portion covers a length from RD: 407 + 220 to 947 + 430 (tail) whereas the head reach from RD: 0 + 000 to 407 + 219 is still unlined (Figure 1).
[image:5.595.62.537.338.714.2]Total number of outlets (Mogas) in this distributary was 67 out of which 54 are located in the Jaalwala Distributary whereas the remaining 13 outlets are present at Jaalwala Minor. Water coming out of these outlets of the distributary goes into the watercourses owned by the agriculture department from where this water is distributed to the fields. Some watercourses in the command of Jaalwala Distributary were lined whereas the others are not. Major crops of the study area were wheat and cotton which are grown in Rabiand Kharif seasons respectively. Climate of the study area is arid and mean annual rainfall in the area remains near to 119.4 mm while temperature varies from highest value of 52˚C during
summers and touches its lowest of 6.3˚C in winters.
The understudy area lies to the south-east of river Sutlej in the IVRS which has thick alluvium of Quaternary Age. The top 300 feet of land was of alluvium nature having major portion of unconsolidated sand ranging from very fine to coarse grains with clay particles of varying width lying in between them. Traces of lime are also seen at certain depths which are of fluvial and Aeolian origin. The area consists of active as well as abandoned flood plains of Ghaghara River. Strong winds action in the area results in shifting of dunes from one place to another resulting in undulating landforms at regional level.
The alluvium deposit in the area of Jaalwala Distributary contains a ground-water reservoir with ground-water depth varying from three to twelve feet below the land surface. The physical characteristics of the predominant sandy aquifer shows some heterogeneity in terms of both lateral and vertical parameters but when speak in broader terms, this aquifer behaves as a single contiguous, unconfined aquifer in the top 300 feet of this alluvial section. Most groundwater stored in this alluvial aquifer is saline though a layer of freshwater overlying this saline aquifer exists beneath and along the periphery of Jaalwala Distributary. The fresh-saline water interface formed between this fresh seeped water and the sa-line groundwater lies generally at shallow depths from where this freshwater layer is tapped by means of limited yield wells to avoid quality deterioration through up coning.
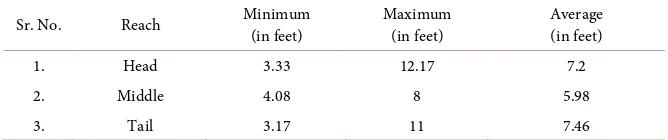
Electrical conductivity was recorded from twenty-one selected sites show that it is highly saline with respect to irrigation parameters though small pockets of freshwater is present. There were various sections where more seepage takes place due to the fact that the canal bed in those areas is earthen and has not been concrete lined. The depth situation of water in the command of Jaalwala Distri-butary was as followed: 3 to 12 feet at the head section, 4 to 8 feet in the middle region and 3 to 11 feet in the tail. Thus the overall average depth of the entire reach of Jaalwala Distributary comes out to be 6.8 feet which is equivalent to about 2.0 meters (Table 2).
[image:6.595.205.539.663.733.2]Out of 535 Tube-Wells (TWs) installed in the Canal Command Area (CCA) of this distributary 100 were located at the head, 215 in the middle whereas 220 at the tail end section. Their average density comes out to be 2.5 tube wells/100 acres having their discharge ranging from 0.42 to 0.5 cusecs. The tube wells in-stalled along or near the Jaalwala Distributary vary in depth from 10.7 m - 17.7 m having an average bore depth of 14.3 meters. Twenty-seven (27) points were selected along Jaalwala Distributary for measuring the water table depths of the area (Figure 2 and Table 3).
Table 2. Water table depth situation in Jaalwala Distributary command area.
Sr. No. Reach Minimum (in feet) Maximum (in feet) Average (in feet)
1. Head 3.33 12.17 7.2
2. Middle 4.08 8 5.98
Table 3. Watercourse wise bore depth and location of tube wells in the vicinity of Jaalwa-la Distributary.
Sr. No. No. of Tube Wells as per Outlet Nos. Bore Depths (in feet) No. of Tube Wells Outlet Nos.
1. 6 8 + 010 R 63
2. 7 8 + 010 L 62
3. 5 8 + 975 L 65
4. 5 11 + 318 L 64
5. 4 12 + 230 L 61
6. 2 12 + 430 R 60
7. 5 11 + 538 R 61
8. 1 17 + 200 R 59
9. 1 14 + 618 R 57
10. 1 12 + 618 L 54
11. 1 19 + 018 L 55
12. 16 22 + 315 R 56
13. 2 22 + 320 L 48
14. 4 24 + 520 L 50
15. 4 25 + 644 L 56
16. 10 25 + 645 R 56
17. 15 29 + 000 L 47
18. 11 30 + 104 R 53
19. 16 32 + 800 L 49
20. 22 32 + 725 R 50
21. 11 36 + 850 L 54
22. 13 38 + 230 R 53
23. 15 40 + 628 L 40
24. 2 40 + 640 L 40
25. 10 40 + 722 R 50
26. 15 44 + 496 R 50
27. 9 46 + 260 L 45
28. 19 48 + 510 R 42
29. 8 50 + 010 L 42
30. 5 52 + 790 L 40
31. 9 53 + 450 R 42
32. 10 56 + 750 R 47
33. 16 56 + 782 L 50
34. 14 56 + 819 L 45
35. 13 61 + 310 L 40
Continued
37. 12 62 + 380 R 40
38. 18 63 + 565 L 40
39. 13 63 + 565 R 42
40. 10 65 + 342 R 40
41. 27 65 + 465 L 40
42. 19 69 + 130 R 45
43. 17 72 + 406 R 40
44. 8 74 + 567 L 45
45. 21 74 + 580 R 55
46. 8 74 + 580 L 45
47. 9 78 + 967 L 35
48. 14 79 + 865 L 45
49. 13 79 + 30 R 40
50. 10 83 + 820 R 40
51. 8 87 + 250 R 40
52. 4 87 + 250 L 35
53. 5 91 + 100 L 55
54. 4 94 + 743 TR 50
Total No. of Tube wells = 535.
3. Methods and Methodology
Samples were taken twice a year for Pre-Monsoon and Post-Monsoon periods of 2009-2012. The electrical conductivity and pH of these samples were recorded on the spot with the help of Hanna HI 9812 pH-EC-TDS meter. It can also make recommendations regarding relief measures to be taken for restoring the un-derstudy system, quantify the amount of water coming in and going out of it, categorize the pumping sites present in it and compute the amount of water be-ing recharged into this system [19].
A groundwater model was prepared to compare the amount of groundwater leached during unlined and lined conditions respectively using MODFLOW in association with other digitized computer based techniques like Geographical Information Systems (GIS) and SURFER while the pace in decline of quality of groundwater was investigated using analytical techniques.
The model encompasses an area of nearly 370 km2 with horizontal and vertic-al dimensions. The model grid was designed to provide adequate spativertic-al resolu-tion within the study area in order to simulate response of the aquifer with re-spect to unlined and lined distributaries. The domain of the model has been ex-tended to a considerable distance from the boundary of command area to mi-nimize impacts of exterior boundary conditions on the model solution (Figure 3).
Figure 2. Map of twenty-seven (27) piezometer points along Jaalwala Distributary Canal Command Area (CCA) for measuring the water-table depths.
which the dimension of each cell was 200 by 200 m. It has two layers in which the upper represents the unconfined aquifer whereas the bottom layer features the confined one. The depth of the unconfined aquifer coincides with the depth of blind pipes of each tube well while the bottom layer contains the filters or screens of them up to their entire length (Figure 3).
Ground surface elevation data was required as a representation of top of the model which was collected from the digital elevation model (DEM). Based on the topographic elevation acquired from the Global Mapper software elevation contours map was draw (Figure 4).
Figure 3. General layout of the model grid and its area.
these ends (Figure 5).
In order to calibrate the model in the light of observed and simulated water levels time series graphs at each piezometer were generated (Figure 3).
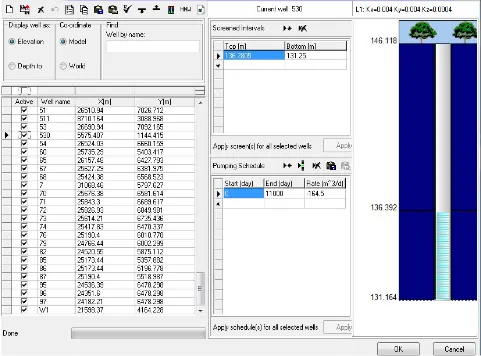
The inventory data of 535 tube wells covering well numbers, X- and Y-coor- dinates as regards model dimensions, top and bottom of the screens, status of wells whether active or otherwise, lengths and locations of blind pipes and fil-ters, pumping schedule and well discharge in m3/day have all been marked to the model (Figure 5 and Figure 6).
First simulation was run for 10 years and the second for 20 years under unlined and lined conditions respectively. Groundwater budget of the aquifer in and around the command of Jaalwala Distributary before and after lining was incor-porated in the model to see a clear picture of the inflows and outflows of water within and outside this unconfined aquifer.
Average discharge capacity of Jaalwala Distributary within the study area throughout the year was 112 Cusecs. Losses from it have been estimated to be around six to seven percent of its discharge at its head which comes out to be 7.8 cusecs (7%). The concentration of the canal water seeping into the aquifer has been calculated as 500 µS/cm which has been added to the model.
4. Results and Discussion
Figure 4. Topographic elevation contours map of jaalwala distributary.
Figure 5. Boundary conditions of the study area as assumed in the model.
Figure 6. Tube well configurations showing their various components, pumping schedule and discharges.
The time-series graphs of predicted water levels was produced by the model 10 years before concrete lining and 20 years after it showed that water table after lining of Jaalwala Distributary declined from 1 to 9 feet depending upon the proximity of piezometers from the main Eastern Sadiqia Canal and the tube wells. Prediction regarding lowering of groundwater table was least near the Eastern Sadiqia Canal (unlined), minimum at the head potion of Jaalwala Dis-tributary (still unlined), intermediate in its middle (lined since 2013) and maxi-mum around the Tail section (Figure 7 and Table 5).
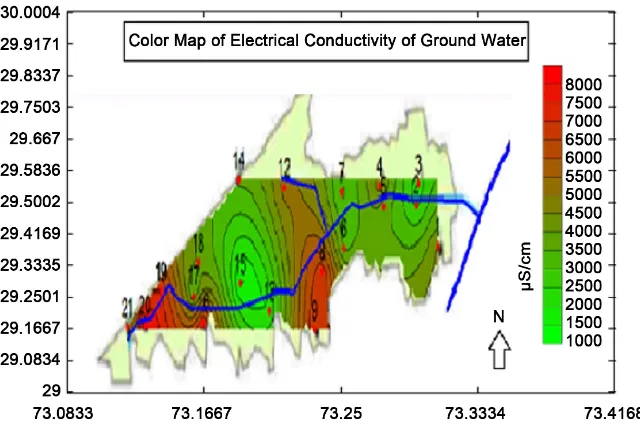
The groundwater quality data as observed from the sites closed to and away from Jaalwala Distributary show that seepage of fresh water from earthen sec-tions of this canal keeps the below lying saline water zone at bay and maintains a thin layer of freshwater above it as is also depicted in the groundwater quality contours (Figure 8 and Table 6).
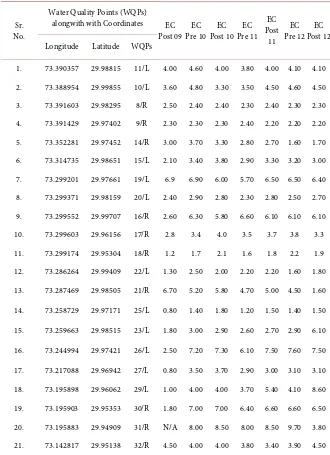
Table 4. Electrical Conductivity variations recorded from 21 selected sites in the com-mand of jaalwala distributary (dS/m).
Sr. No.
Water Quality Points (WQPs) alongwith with Coordinates EC
Post 09 Pre 10 EC Post 10 EC Pre 11 EC EC Post
11 EC Pre 12 Post 12 EC Longitude Latitude WQPs
1. 73.390357 29.98815 11/L 4.00 4.60 4.00 3.80 4.00 4.10 4.10
2. 73.388954 29.99855 10/L 3.60 4.80 3.30 3.50 4.50 4.60 4.50
3. 73.391603 29.98295 8/R 2.50 2.40 2.40 2.30 2.40 2.30 2.30
4. 73.391429 29.97402 9/R 2.30 2.30 2.30 2.40 2.20 2.20 2.20
5. 73.352281 29.97452 14/R 3.00 3.70 3.30 2.80 2.70 1.60 1.70
6. 73.314735 29.98651 15/L 2.10 3.40 3.80 2.90 3.30 3.20 3.00
7. 73.299201 29.97661 19/L 6.9 6.90 6.00 5.70 6.50 6.50 6.40
8. 73.299371 29.98159 20/L 2.40 2.90 2.80 2.30 2.80 2.50 2.70
9. 73.299552 29.99707 16/R 2.60 6.30 5.80 6.60 6.10 6.10 6.10
10. 73.299603 29.96156 17/R 2.8 3.4 4.0 3.5 3.7 3.8 3.3
11. 73.299174 29.95304 18/R 1.2 1.7 2.1 1.6 1.8 2.2 1.9
12. 73.286264 29.99409 22/L 1.30 2.50 2.00 2.20 2.20 1.60 1.80
13. 73.287469 29.98505 21/R 6.70 5.20 5.80 4.70 5.00 4.50 1.60
14. 73.258729 29.97171 25/L 0.80 1.40 1.80 1.20 1.50 1.40 1.50
15. 73.259663 29.98515 23/L 1.80 3.00 2.90 2.60 2.70 2.90 6.10
16. 73.244994 29.97421 26/L 2.50 7.20 7.30 6.10 7.50 7.60 7.50
17. 73.217088 29.96942 27/L 0.80 3.50 3.70 2.90 3.00 3.10 3.10
18. 73.195898 29.96062 29/L 1.00 4.00 4.00 3.70 5.40 4.10 8.60
19. 73.195903 29.95353 30/R 1.80 7.00 7.00 6.40 6.60 6.60 6.50
20. 73.195883 29.94909 31/R N/A 8.00 8.50 8.00 8.50 9.70 3.80
21. 73.142817 29.95138 32/R 4.50 4.00 4.00 3.80 3.40 3.90 4.50
located at the lined tail portion of Jaalwala Distributary (Table 7) which showed less variability in terms of electrical conductivity at sites 3 and 5 up to post-2012 because of constant seepage of freshwater from the unlined portion of the Dis-tributary. On the other hand the electrical conductivity of sampling sites 17 and 19 near the tail portion of the distributary lined since 2005 showed quite a dif-ferent trend. The groundwater quality of these samples during Pre-2009 was quite low which increased to 3000 - 7000 µS/cm because of non-replenishment of freshwater as a result of concrete lining of this section of the Distributary and consequent intrusion of saline water table in its place (Table 7 and Figure 9).
Figure 7. Predicted water levels in various piezometers before and after lining.
Figure 8. Groundwater quality contours as drawn with respect to actual readings of elec-trical conductivity for Post-Monsoon, 2009 (µS/cm).
[image:14.595.213.533.420.633.2]Table 5. Predicted decline in groundwater table by the Model after 20 years of lining (2028).
Piezometer alongwith their Coordinates
Actual water levels just before lining
Predicted decline in water
levels 20 years after lining
Net Balance in groundwater levels 20 years after lining
Piezometer
Nos. Longitude Latitude (In meters) (In meters) (In meters) (In feet) PPZ-06/L 73.39445 29.98846 157.410 157.017 0.393 1.29 PPZ-04/R 73.39479 29.97426 156.756 155.837 0.919 3.01 PPZ-08/R 73.3634 29.97133 155.469 153.906 1.563 5.13 PPZ-07/L 73.36335 29.98834 153.986 151.641 2.345 7.69 PPZ-10/L 73.33153 29.98749 153.042 150.332 2.710 8.89 PPZ-14/L 73.30148 29.98837 149.999 146.198 3.801 12.47 PPZ-15/L 73.26827 29.98436 148.420 144.837 3.583 11.75 PPZ-20/L 73.23511 29.96447 148.196 144.687 3.509 11.51 PPZ-21/R 73.20993 29.94788 148.470 144.426 4.044 13.26 PPZ-22/L 73.20104 29.96506 146.732 144.518 2.214 7.26 PPZ-24/L 73.17312 29.96366 146.317 144.671 1.646 5.40
Table 6. Actual water quality of tube wells located close to and at a distance from Jaalwala Distributary with respect to electrical conductivity (µS/cm) (Post-Monsoon, 2009).
Sr. No. Tube well Nos. Close to Jaalwala Distributary At a distance from Jaalwala Distributary
1. 1 - 4100
2. 2 2300 -
3. 3 2200 -
4. 4 4600 -
5. 5 1600 -
6. 6 - 3200
7. 7 2500 -
8. 8 - 6500
9. 9 - 6100
10. 12 - 4500
11. 13 1600 -
12. 14 - 2900
13. 15 1400 -
14. 16 - 7600
15. 17 3100 -
16. 18 - 4100
17. 19 6600 -
18. 20 9700 -
[image:15.595.207.540.406.738.2]Table 7. Electrical Conductivity of Samples taken from Sites No. 3 and 5 in the Head un-lined portion and from Sites No. 17 and 19 in the Tail Lined portion (µS/cm).
Proposed Water Quality Points
(PWQs) along with Coordinates Electrical Conductivity
[image:16.595.205.539.103.396.2]Longitude Latitude PWQs Post 09 Pre 10 Post 10 Pre 11 Post 11 Pre 12 Post 12 73.388954 29.99855 3 2500 2400 2400 2300 2400 2300 2300 73.352281 29.97452 5 3000 3700 3300 2800 2700 1600 1700 73.217088 29.96942 17 800 3500 3700 2900 3000 3100 3100 73.195903 29.95353 19 1800 7000 7000 6400 6600 6600 6500
Figure 9. Electrical Conductivity variations in the unlined Head portion (at Sites No. 3 and 5) and the lined Tail Portion of Jaalwala Distributary (at Sites 17 and 19) (µS/cm) (Post 2009-Pre 2012).
term fluctuations in Electrical Conductivity after lining are expected at lined sites close to the Distributary because of depletion of freshwater pockets with time and filling their gap by the upcoming saline water table (Figure 10 and Ta-ble 8).
Samples taken from sites No. 5, 13 and 15 close to the Jaalwala Distributary and No. 9, 12 and 18 away from it (Table 6) with the purpose to analyze them chemically with respect to irrigation parameters were evaluated using Piper Dia-gram. Nearly ninety percent of ions present in a hydrologic system were Na+, K+, Ca2+, Mg2+, 2
4
SO−, Cl−, HCO3− and 2 3
CO −. If Na+ and K+ were taken together as one type of positive ions and HCO3
− and 2
3
CO − be assumed as similar nega-tive ions, then top of the cations triangle will be taken by Mg2+, Ca2+ will be as-signed the lower left while Na+ and K+ will collectively take its right corner.
Si-milarly, 2
4
SO− will be given the upper most turning of the anion triangle,
3
Figure 10. Simulated groundwater quality variations at Sites Nos. 2, 3, 4, 12 and 16 before and after Lining with respect to Elec-trical Conductivity (µS/cm) (Post 2009-Pre 2012).
Table 8. Predicted impact of lining on electrical conductivity variations by the model in 2009 and 2028 (µS/cm).
Tube well Nos.
Recorded Electrical Conductivity just before lining
Predicted Electrical Conductivity 20 years after lining
1 4382 6988
2 2598 6994
3 887 6269
4 1599 6965
5 5032 6994
6 6990 6990
7 4523 4788 (still rising)
9 6998 7000
12 1210 6991
13 5037 6997
14 6610 6998
15 4223 4244
16 1307 6774
17 4282 5087
[image:17.595.201.539.451.740.2]to the argument that the seeped freshwater from the channels does not mix with the below lying saline water and retain its independent identity (Table 9).
Groundwater budget was computed by the model before and after lining of CCA of Jaalwala Distributary showed that inflows from Eastern Sadiqia Canal and from Jaalwala Distributary before concrete lining were 7.6 cusecs and 8.5 cusecs respectively. Outflows from the aquifer due to tube wells under unlined conditions was 15.1 cusecs and from the western boundary to downstream areas was 1.1 cusecs. Thus the seepage from Jaalwala Distributary going directly into the aquifer as predicted by the model was 8.5 cusecs which is equal to 7.6% of the discharge delivered at its head section [14] (Figure 11 and Table 9).
[image:18.595.208.540.359.459.2]The model further predicted that Jaalwala Distributary will not further con-tribute any water to the below lying saline aquifer after its concrete lining. If the tube wells in the study area continue to run then inflow from Eastern Sadiqia Canal would increase from 7.6 cusecs (before lining) to 13.6 cusecs. Because of concrete lining of Jaalwala Distributary in the tail section, outflows from the western boundary will be reduced from 1.1 to 0 cusecs due to formation of a permanent structure in the way of seepage. A saving of 7.8 cusecs canal water
Table 9. Estimated seepage loss from the Irrigation canal system of punjab [14].
Canal System Kennedy Benton Blench
Main Canals 5 - 5
Branches 15 16.4 15
Distributaries 6 6.1 7
Water Courses 21 20.2 20
[image:18.595.112.541.367.711.2]Total 47.0 42.7 47.0
has been predicted by the model which is equivalent to 7% of the total discharge of 112 cusecs delivered at the Head of Jaalwala Distributary. This calculation is in accordance with the experimental measurements of conveyance losses in oth-er distributaries in Punjab (Table 9). The model has predicted that formation of a permanent concrete barrier in the way of seepage will minimize the recharge contribution to the underlying layer of good quality water present below the Jaalwala Distributary and will allow the saline water zone present around it to take its place. This situation will further aggravate when the presently installed 535 tube wells along the Jaalwala Distributary would be forced to pump de-graded saline water to the farm fields thereby making the soil of the area non-productive and barren on permanent basis.
The supposition that the farmers at the middle and tail sections of Jaalwala Distributary would get their allocated shares is practically a fiasco as a result of various practical and local reasons. After complete concrete lining of Jaalwala Distributary, the farmers would not be in a position to make conjunctive use of surface and groundwater for irrigating their fields as they would be left with the only option of using canal water which is often short at Middle and Tail.
Seepage tests as conducted by renowned engineers and scientists like Kenne-dy, Benton, Blench and Dyes in the Indus Plains from 1883 onwards have re-vealed that seepage losses from earthen main canals and their branches amount to 20%, from distributaries and minors up to 6%, from water-courses 10% and field losses to 10% [9] (Table 9).
5. Conclusion
It was concluded that after lining Jaalwala Distributary, seepage losses amount-ing to 7.8 cusecs were likely to be saved and lower the water from 1 to 13 feet depending upon their distance from Eastern Sadiqia canal. Thus the positive impacts of lining were predicted by the model which accounts for a considerable savings with respect to seepage and lowers in groundwater table to an extent that the risk of secondary salinization can be evaded.
Acknowledgements
I would like to mention Muhammad Usman Saleem, Collage of Earth and Envi-ronmental Sciences University of the Punjab Lahore, Pakistan for the supervis-ing and publication of this office report as research paper. My gratitude goes to Dr. Muhammad Akram, Hydrologist in Irrigation Department Punjab for shar-ing valuable data in this research. Special thanks for Open journal for applied sciences for giving a platform to publish this effort.
References
[1] Negenborn, R.R., Overloop, P.J., Keviczky, T. and De Schutter, B. (2009) Distri-buted Model Predictive Control of Irrigation Canals. Networks and Heterogeneous Media, 4, 359-380. https://doi.org/10.3934/nhm.2009.4.359
Wi-ley & Sons Inc., Hoboken, 20-21, 590-592.
[3] Fetter, C.W. (2001) Applied Hydrogeology. 4th Edition, Prentice Hall, Upper Sad-dle River, 2, 8.
[4] Ashraf, M. (2009) Importance of Water: In the Light of Quran and Sunnat and Me-thodologies to Conserve It. Pakistan Council of Research in Water Resources (PCRWR), Islamabad, Pakistan, 1-38.
[5] The United Nations World Water Development Report (UNWWDR) (2003) Water for People Water for Life; The Natural Water Cycle. UNESCO, Barcelona, 65-67. [6] Siddiqui, I.H. (1979) Irrigation Canals, Planning, Design, Construction &
Main-tenance. National Book Foundation Pakistan, Lahore, 251-257.
[7] Awan, N.M. and Latif, M. (1982) Technical, Social and Economic Aspects of Water Resources Management in Salinity Control and Reclamation Project No. 1 (SCARP-1) in Pakistan. Centre of Excellence in Water Resources Engineering (CEWRE), Lahore, Pakistan, No. 22, 1-11.
[8] Burt, C.M. (2011) Canal Lining, Irrigation Training & Research Center, Polytechnic State University California, USA, No. 6, 1-2.
[9] Ahmad, N. (1993) Water Resources of Pakistan and Their Utilization. Miraj Din Press, Urdu Bazar, Lahore, Pakistan, 15-31, 4B-1-4B-57.
[10] Ahmad, N. (1998) Drainage of Irrigated Lands of Pakistan. Shaf Printers, 1-R Green Park, Multan Road, Lahore, Pakistan, 5 B-41-5 B-49, 5 C-1-5 C-30.
[11] Javed, I., Hussain, S., Rehman, H. and Malik, A.S. (2014) Engineering Economics and Hydrology of Canal Lining: Evaluation of Canal Lining in Balloki and Sahiwal Canal Division of Lower Bari Doab Canal System. Water and Power Development Authority (WAPDA), Lahore, Pakistan, No. 301, 4, 6, 44.
[12] Asawa, G.L. (2008) Irrigation and Water Resources Engineering. New Age Interna-tional, New Dehli, India, 211-219.
[13] Ahmad, N. (1979) Tubewell, Theory and Practice. Rippon Press, Lahore, Pakistan, 2.1-2.3.
[14] Ahmad, N. (1974) Groundwater Resources of Pakistan. Rippon Press, Lahore, Pa-kistan, 246-249.
[15] Kahlown, M.A., Tahir, M.A. and Rasheed, H. (2005) Water Quality Profile in Pa-kistan, 2005 (Third Report 2003-2004). Pakistan Council of Research in Water Re-sources (PCRWR), Islamabad, Pakistan, 3-7.
[16] Alam, S.M., Ansari, R. and Khan, M.A. (2000) Water Crisis in Pakistan Agriculture. How to Manage Scientifically? Pakistan & Gulf Economist, No. 27, 29-38.
[17] Department of Sustainability, Environment, Water, Population and Communities (DSEWP&C), Australia (2012) Salinity and Water Quality. Australia, 1-3.
[18] Pakistan Institute of Legislative Development and Transparency (PILDAT) (2003) Lahore. 11-21.
Submit or recommend next manuscript to SCIRP and we will provide best service for you:
Accepting pre-submission inquiries through Email, Facebook, LinkedIn, Twitter, etc. A wide selection of journals (inclusive of 9 subjects, more than 200 journals)
Providing 24-hour high-quality service User-friendly online submission system Fair and swift peer-review system
Efficient typesetting and proofreading procedure
Display of the result of downloads and visits, as well as the number of cited articles Maximum dissemination of your research work
Submit your manuscript at: http://papersubmission.scirp.org/
![Table 1. Impact of different lining materials used for reducing the rate of seepage [6]](https://thumb-us.123doks.com/thumbv2/123dok_us/7754844.710842/3.595.210.538.90.230/table-impact-different-lining-materials-used-reducing-seepage.webp)