Munich Personal RePEc Archive
How best to measure pension adequacy
Grech, Aaron George
London School of Economics and Political Science
April 2013
i
How best to measure pension adequacy
Aaron George Grech
Contents
Introduction ... 1
1. Pension adequacy objectives envisaged by policymakers ... 2
2. Pension adequacy indicators ... 4
2.1 Theoretical replacement rates ... 5
2.2 Moving beyond theoretical replacement rate measures ... 11
2.2.1 Increasing the number of hypothetical cases ... 11
2.2.2 Spending and/or income based measures of adequacy ... 13
3. An alternative approach to measure pension adequacy ... 18
Conclusion ... 29
ii
Editorial note
Aaron George Grech is a visiting research fellow at the LSE‟s Centre for Analysis of
Social Exclusion (CASE) and works at the Modelling and Research Office of the Central Bank of Malta. This paper builds on research he carried out as part of his doctoral research at CASE between 2006 and 2010, and expands on results presented in CASEpapers 140 and 161. He would like to thank John Hills for having provided very helpful comments and suggestions on this research work. The latter also benefited from the comments of Nicholas Barr. The simulation model APEX, used to derive pension wealth estimates, was kindly provided by the Directorate for Employment, Labour and Social Affairs of the Organisation for Economic Co-operation and Development (OECD). The author is particularly indebted to Edward Whitehouse and Monika Queisser, for their kind help, advice and support.
The views expressed in this paper are those of the author, and organisations with which he is affiliated with do not carry any responsibility towards data used and interpretations made in the paper. The author also takes full responsibility for all errors and omissions.
Abstract
Though the main benchmark used to assess pension reforms continues to be the expected resulting fall in future government spending, the impact of policy changes on pension adequacy is increasingly coming to the fore. As yet, there does not seem to be a broad consensus in policymaking circles and academic literature on what constitutes the best measure of pension adequacy. While various indicators have been developed and utilised, no single measure appears to offer a clear indication of the extent to which reforms will impact on the achievement of pension system goals. Many indicators appear ill-suited to study the effective impact of reforms, particularly those that change the nature of the pension system from defined benefit to defined contribution.
Existing measures are frequently hard to interpret as they do not have an underlying benchmark which allows their current or projected value to be assessed as adequate or inadequate. Currently used pension adequacy indicators tend to be point-in-time measures which ignore the impact of benefit indexation rules. They also are unaffected by very important factors, such as changes in the pension age and in life expectancy. This tends to make existing indicators minimise the impact of systemic reforms on the poverty alleviation and income replacement functions of pension systems. The emphasis on assumptions which are very unrepresentative of real-life labour market conditions also makes current indicators deceptive, particularly in relation to outcomes for women and those on low incomes.
iii
measures are used to give a better indication of the effective impact of pension reforms enacted since the 1990s in ten major European countries. They suggest that these reforms have decreased generosity significantly, but that the poverty alleviation function remains strong in those countries where minimum pensions were improved. However, moves to link benefits to contributions have raised clear adequacy concerns for women and for those on low incomes which policymakers should consider and tackle.
Key words: Social Security and Public Pensions; Retirement; Poverty; Retirement Policies
JEL number: H55, I38, J26
1
Introduction
In recent decades European governments have embarked on significant pension reforms meant to ensure system sustainability.1 Since reducing the impact on future spending levels was frequently the main aim of these reforms, it is not surprising that many early studies focused just on this aspect.2 However, more recently, researchers have broadened their analysis beyond fiscal considerations3 and started to delve into the broader implications of these policy changes.4
This change in research focus was, in part, inspired by a shift in thinking on pension reforms in international economic institutions. For instance in the 1990s the World Bank was an all-out proponent of privatisation and retrenchment5, so much so that a policy review by its Independent Evaluation Group6 concluded that “Bank involvement in pension reform was often prompted by concerns about fiscal sustainability. Yet, in doing so, there often was a neglect of the primary goal of a pension system: to reduce poverty and provide retirement income within a fiscal constraint”.7 By contrast the Bank‟s present stance is that “pension systems need to provide adequate, affordable,
sustainable, and robust benefits”.8
However, while the standard measure of the fiscal success of a reform – reduced future spending9 – is well-known, understandable and clear, there is no
1
For an overview of these reforms, see European Commission (2010), OECD (2007) and Zaidi et al (2006).
2
See for instance, Disney (2000).
3
See, for example, Dekkers et al (2009) and Zaidi & Grech (2007). Grech (2012) contains an overview of many other such studies.
4
For instance, Forster & Mira D‟Ercole (2005) conclude that “changes in the generosity of public transfers and taxes have played the largest role in shaping
changes in poverty risks among the elderly within individual countries” of the OECD
during the second half of the 1990s.
5
World Bank (1994).
6
The Independent Evaluation Group is an independent unit within the World Bank that acts as an auditor of the impact of policies advocated by the Bank.
7
The World Bank Independent Evaluation Group (2006). The World Bank‟s previous approach and its insistence on a mandatory fully funded second pillar had been criticised by a number of renowned economists, such as Kotlikoff (1999), Orszag & Stiglitz (1999) and Modigliani & Muralidhar (2005).
8
Holzmann & Hinz (2005).
9
A standard example of this approach is Schneider (2009). In it the author argues that
“the larger the decrease in expected spending on public pensions in 2050 between two
2
similar consensus on how best to measure whether pension entitlements will remain adequate. The scope of this paper is to review the indicators that have been proposed and used in the literature, and suggest alternative measures. To start this discussion, the following section outlines the aims of pension provision typically envisaged by policymakers. Section 2 describes the main pension adequacy indicators used in the literature, and their defects. An alternative set of indicators based on estimates of pension wealth for ten European countries is then proposed in section 3. Using pension wealth, rather than the standard pension adequacy indicators, helps address many of the concerns raised in section 2 – such as the limited ability of existing indicators to reflect the impact of different benefit indexation rules,10 changes in pension age and life expectancy and the impact of systemic reforms11 on generosity. While the empirical results have already been presented in Grech (2010), the paper sets out more clearly the methodological improvements of this approach by comparing them with currently used pension adequacy indicators.
1.
Pension adequacy objectives envisaged by policymakers
Pension policy differs largely across countries,12 but this has not stopped international institutions from coming up with adequacy objectives. While in no way prescriptive, these objectives are given their due consideration by national policymakers.
The World Bank, for instance, has wielded considerable influence in shaping
pension reforms. Its current stance is that “pension systems need to provide adequate, affordable, sustainable, and robust benefits”.13 By „adequate‟ the
Bank intends that “all people regardless of their level or form of economic activity” have access to benefits “that are sufficient to prevent old-age poverty on a country-specific absolute level in addition to providing a reliable means to
10
Benefit indexation rules determine how the value of a benefit changes after it is awarded. For instance, a benefit could be increased in line with inflation over time. 11
In a systemic reform, a scheme‟s financing and benefit accrual structure is changed. In most cases, pension systems are changed from pay-as-you-go defined benefit (where benefits are determined in relation to an agreed pensionable income, financed out of current contributions) to defined contribution schemes (where benefits depend on contributions made, any accrued returns on these contributions and the time to be spent receiving the benefit), either notional (i.e. benefits are still financed from current revenues) or funded (i.e. contributions are not immediately spent).
12
Nevertheless, pension provision tends to be uniformly collectively organised. See Jousten (2007) for some theoretical explanations of why this happens across countries. Eckstein et al (1985) shows it is potentially welfare improving to have a compulsory pension scheme.
13
3
smooth lifetime consumption for the vast majority of the population”.14 The
Bank specifies that “for a typical, full-career worker, an initial target of net-of-tax income replacement from mandatory systems is likely to be about 40% of real earnings to maintain subsistence levels of income in retirement”.15 Systems offering rates above 60% are seen as unaffordable, as the Bank argues that they would require contribution rates which would be quite detrimental. Adequacy needs to be guaranteed over time such that “the pension program should be structured so that the financial situation does not require unannounced future
cuts in benefits, or major and unforeseen transfers from the budget” and systems should be able to “sustain income-replacement targets in a predictable
manner over the long term…in the face of unforeseen conditions and circumstances”.16
The International Labour Organisation (ILO) has through the years led representatives of governments, employers and trade unions to agree on a number of conventions on pension provision. These conventions aim to
“guarantee protected persons who have reached a certain age the means of a decent standard of living for the rest of their life” – which is set by Convention 238 as a replacement rate of 45%.17 This needs to be maintained in view of changes in the cost of living subsequent to retirement. The ILO also argues
that “statutory pension schemes must guarantee adequate benefit levels and ensure national solidarity”18
and that risks should not be borne solely by the individual but must be shared among all social agents. Coverage must also extend to all members of society and there should not be gender inequality in provisions.19
Since 2001, the European Union (EU) has achieved agreement among Member States on common objectives on pension policy – the achievement of which is monitored through the open method of co-ordination (OMC). The latter is a voluntary process for political cooperation, where progress towards these goals is measured by monitoring agreed common indicators. EU Member States prepare national reports, which are then assessed by the Commission and
14
Ibid.
15
Ibid. This is in line with International Labour Office (1952) – the basic convention for social security benefits.
16
Unfortunately, the same study, Holzmann & Hinz (2005) concludes that “most existing pension systems, including some of the recently reformed systems, are unable to deliver on these promises”.
17
See Humblet & Silva (2002).
18
See International Labour Office (2001).
19
4
Council and reflected in joint reports.20 In 2012 this culminated in the Commission preparing a white paper on pension reform.21 The pension adequacy objective agreed as part of the OMC states that countries should “in the spirit of solidarity and fairness between and within generations, guarantee adequate retirement incomes for all and access to pensions which allow people to maintain, to a reasonable degree, their living standard after retirement”.22 The achievement of this objective is monitored by looking at 4 primary indicators, namely the at-risk-of-poverty rate of older people, their median relative income, the aggregate replacement ratio and the change in projected theoretical replacement ratio over the next 40 years.23 These indicators will be discussed in the next section. At the outset, it should be noted that the EU has shied away from adopting a minimum quantified pension adequacy indicators approach.
2.
Pension adequacy indicators
Arriving at a precise definition of pension adequacy and operationalising it into an indicator has proven to be difficult. Besides the standard conception that pension adequacy is determined by the degree of poverty alleviation and consumption smoothing24 a system provides to the current pensioner generation, intergenerational comparisons of adequacy also play a role, particularly in the wake of substantial reforms.25 The perceived lack of effective pension adequacy indicators potentially could distort the pension reform debate. Some argue that it partly explains the continued predominance
of fiscal considerations. For instance, Eckardt (2005) argues that “as long as no
reliable prospective income indicators exist, which allow one to evaluate the effect of more structural changes on future benefits, the rather short-term policy-making process may further favour the principle of financial
sustainability”.
20
See, for example, European Commission (2010).
21
European Commission (2012).
22
See European Commission (2005).
23
See European Commission (2009). Member States also monitor developments in 8 secondary indicators and 1 context indicator.
24
See Barr and Diamond (2006) for a theoretical discussion of the purpose of pension systems, and Palacios & Sluchynsky (2006) and Caucatt et al (2007) for an outline of how national pension systems started being set up at the end of the nineteenth century.
25
5
2.1 Theoretical replacement rates
Kolitkoff (1999) argues that pensions “should replace a reasonable fraction of pre-retirement income, i.e., they should be consistent with lifetime
consumption smoothing”. In fact, most pension adequacy measures concentrate
on how benefits compare with previous income. The most commonly used
measure is the replacement rate. The latter tries to “assess how well older
people can maintain their pre-retirement levels of consumption once they stop
working”.26
The most economically accurate measure would be one comparing
someone‟s consumption pre-retirement with that post-retirement. Due to data unavailability, this is approximated by comparing incomes collected on a
longitudinal basis. Goodin et al (1999), for instance, compute the „effective replacement rate‟ of public transfers in Germany, the Netherlands and the US
by finding in national income surveys “those people whose principal source of
income in one year was market income and whose principal source of income in the next year was public-transfer income” and then “calculate their income in the second (public-transfer-dependent) year as a proportion of their income in the first (market-dependent) year”.
However, this direct measure of adequacy has its limitations. First of all, it is a historical measure – in that one needs to wait until retirement to be able to assess replacement rates. Secondly, it is an individual measure and thus may not be representative of the whole population. Thirdly, it is not a prospective measure and so does not give information on future changes in pension system rules – replacement rates would reflect rules as they related to that individual. Fourthly, it is data-intensive and such longitudinal data are not usually available. Fifthly it has no direct link with poverty as if someone is poor, and the pension system replaces 100% of income, while the replacement rate would seem generous, it would still not reduce the risk-of-poverty.27 Finally it is a single point-in-time indicator, and does not take longevity into account and how it affects transfers to the individual.
To surmount some of these issues, theoretical replacement rates are frequently resorted to. The European Commission, as part of the OMC, regularly
publishes estimates of “the level of pension income the first year after
retirement as a percentage of individual earnings at the moment of take-up of
pensions…for an assumed hypothetical worker, who in the so-called „base
case‟ has a given earnings and career profile (male, earnings of average wage
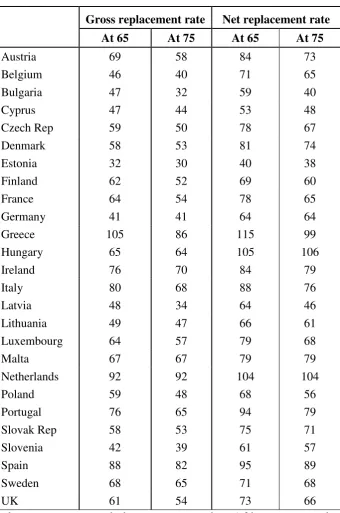
constant over his fulltime 40 years career, retiring at 65, etc)”.28 The latest estimates are shown in Table 1. The OECD also publishes theoretical
26
Munnell & Soto (2005).
27
Goodin et al (1999), in fact, do not use the „effective replacement rate‟ as an adequacy indicator but as a measure of the extent to which welfare systems promote
stability over an individual‟s life course.
28
6
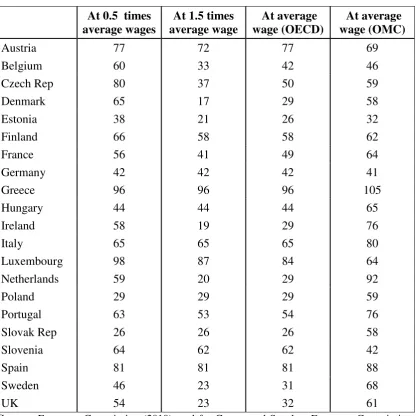
replacement rates for a range of hypothetical individuals, but restricts its results to state pension provision.29 Table 2 compares the OMC estimates with those made by the OECD for the hypothetical worker on average earnings, to give an idea of the role of private pensions. OECD estimates suggests that in ten countries state pensions do not offer the ILO recommended 45% replacement rate, while 6 countries offer what the World Bank deems unaffordable replacement rates. Note that the OECD prepares estimates for workers on different wage levels. This is similar to what is done in the United States, where the Social Security Trustees Report includes estimates for a number of stylised wage earners.30
Blondell & Scarpetta (1999) was one of the first studies of cross-country theoretical replacement rates. However the authors were quick to point out that
“there is no such thing as a single pension replacement rate in any national
retirement scheme”. This because even with the simplest case – flat-rate universal old-age pensions – the gross replacement rate will still differ for individuals as it is determined by their previous earnings, while net replacement rates will be affected by the progressivity of the tax system. In fact, the estimates in Table 2 clearly show that replacement rates for people on different levels of wages differ greatly in most countries, while the data in Table 1 indicate that tax regimes also vary substantially. Table 2 also indicates that in some countries, the OMC replacement rate indicator is buoyed upwards substantially by private pensions. In some cases, such as Poland, Slovakia and the Netherlands, this is due to mandatory or quasi-mandatory private systems. Here the OMC replacement rates are subject to rate-of-return risk. In some other cases, there is also a considerable participation risk, as the OMC replacement rates assume that the average person voluntarily participates in a private pension scheme. For instance, in Ireland the replacement rate including private pensions is 47 percentage points higher than that from the mandatory state pension.
29
See OECD (2011).
30
7
Table 1: Theoretical replacement rates (%) - OMC
Gross replacement rate Net replacement rate At 65 At 75 At 65 At 75
Austria 69 58 84 73
Belgium 46 40 71 65
Bulgaria 47 32 59 40
Cyprus 47 44 53 48
Czech Rep 59 50 78 67
Denmark 58 53 81 74
Estonia 32 30 40 38
Finland 62 52 69 60
France 64 54 78 65
Germany 41 41 64 64
Greece 105 86 115 99
Hungary 65 64 105 106
Ireland 76 70 84 79
Italy 80 68 88 76
Latvia 48 34 64 46
Lithuania 49 47 66 61
Luxembourg 64 57 79 68
Malta 67 67 79 79
Netherlands 92 92 104 104
Poland 59 48 68 56
Portugal 76 65 94 79
Slovak Rep 58 53 75 71
Slovenia 42 39 61 57
Spain 88 82 95 89
Sweden 68 65 71 68
UK 61 54 73 66
Note: Replacement rates are worked out on a gross and net (of income taxes and employee contributions, but always including employer contributions) basis. They represent the situation of people retiring under the legislation enacted by 2008, including any transitional rules to be implemented gradually that may be legislated in enacted reforms. They also include income from private pensions if coverage is significant.
8
Table 2: Theoretical gross replacement rates (%) – OECD
At 0.5 times average wages
At 1.5 times average wage
At average wage (OECD)
At average wage (OMC)
Austria 77 72 77 69
Belgium 60 33 42 46
Czech Rep 80 37 50 59
Denmark 65 17 29 58
Estonia 38 21 26 32
Finland 66 58 58 62
France 56 41 49 64
Germany 42 42 42 41
Greece 96 96 96 105
Hungary 44 44 44 65
Ireland 58 19 29 76
Italy 65 65 65 80
Luxembourg 98 87 84 64
Netherlands 59 20 29 92
Poland 29 29 29 59
Portugal 63 53 54 76
Slovak Rep 26 26 26 58
Slovenia 64 62 62 42
Spain 81 81 81 88
Sweden 46 23 31 68
UK 54 23 32 61
Source: European Commission (2010), and for Greece and Sweden, European Commission (2009), OECD (2011).
Heterogeneity in replacement rates poses significant hurdles to use them as pension adequacy measures. To be able to do this, one would need to know to what extent the hypothetical individual, for whom the theoretical replacement ratio is estimated, is representative of the average pension recipient. On a theoretical level, Blondell & Scarpetta (1999) points out that the simplifying
assumption of a flat earnings profile over the worker‟s lifetime and full
indexation of earnings for benefit calculation may overstate the pension level. Workers tend to move across the wage distribution over their lifetime, starting with low wages and ending with higher wages closer to retirement. Moreover even if wages did not change with age, it is hardly likely that an individual would always receive the increase observed in average wages.
Leaving aside these simplifying assumptions, the main criticism of theoretical replacement rates is the representativeness (or not) of the hypothetical worker.
9
earnings, employed full-time for 40 years uninterruptedly and retiring at 65. Leaving aside the obvious issue of gender, the first consideration is that across Europe the average person does not retire at 65. Eurostat data suggest that the average exit age from the labour force of males in 2010 stood at 61.5 for the EU-27. Employment rates are well below 100%, particularly for women, tend to fall over the working age and differ greatly by country.31 Close to a fifth of the workforce, most of them women, work part-time.32 Moreover by definition, an average wage, while being representative of the wage most commonly experienced in an economy, does not provide any indication of the extent of inequality in wage distribution. Eurostat‟s Structure of Earnings Survey (SES)33 reports that across the EU in 2010, the wage of those in the top tenth percentile of the wage distribution was more than 8 times that of those in the bottom tenth.34 The same data source also indicates earnings follow a pronounced age profile, accelerating rapidly at first before then decelerating after age 50.35
The Commission is aware of these issues and its first report on theoretical replacement rates36 had noted that “the choice of specific common assumptions about the hypothetical worker used for the calculation, such as the age of retirement and length of working and contribution period before retirement, inevitably implies that only a share of all possible situations are taken into
account”.37
European Commission (2009), for instance, notes that in Greece “a
31
The employment rate for men aged 25-64 stood at 75% in 2011 across the EU27, from a low of 67% in Bulgaria to a high of 83% in Sweden. For women the EU27 average was 62%, ranging from 43% in Malta to77% in Sweden. The employment rate for those aged 55-64 was just 55% for men and 40% for women.
32
The respective figure for women was 32%.
33
The SES provides EU-wide harmonised structural data on gross earnings, hours paid and annual days of paid holiday leave which are collected every four years.
34
Wage inequality differs greatly across countries. For example, in Sweden those in the bottom tenth percentile get a wage only a quarter less than the median wage; whereas in the neighbouring Baltic country of Estonia the ratio is more like half.
35
On average across the EU, in 2010, the mean wage of men aged under 30 was just three-fifths the mean wage of men aged 40 to 49. By contrast those aged over 60 have a wage only 3% higher than those aged 40-49.
36
European Commission (2006).
37
A further complication is the economic assumptions taken, as these can be a very important determinant of replacement rates for defined contribution systems. For instance European Commission (2006) had set the long run rate of return on investments at 2.5%. By contrast the real wage growth assumption for some countries, such as Poland, was set higher. Partly as a result of these awkward
assumptions, that imply dynamic inefficiency, the replacement rate of Poland‟s
10
negligible portion of pensioners, below 3%, complete 40 contribution years
before retirement”. Since average career length in Greece is 25 years, while the
[image:14.595.95.527.287.524.2]OMC indicator suggests that pensions in Greece are the most generous in the EU, the poverty rate among Greek pensioners is the fifth highest, as people do not get that implied generous pension. Only in 9 EU countries, men contribute 40 years or more prior to retirement.38 Given these issues, it is not surprising to find that there is only very weak correlation between the net theoretical replacement rate and the difference between the risk of poverty of men aged over 65 and that of men of working age (see Figure 1). The degree of correlation is even weaker when one considers gross theoretical replacement rates.
Figure 1: Cross plot of net replacement rate against the difference in the at-risk-of-poverty rate (2008)
y = -0.15x + 15.3 R² = 0.09
-15 -10 -5 0 5 10 15 20 25 30 35
0 20 40 60 80 100 120 140
D if fe re n ce i n r is k-of -p o ve rt y (p. p .)
Net replacement rate (%)
Note: The difference in the at-risk-of-poverty rate measures the (percentage point) difference between the risk of poverty faced by the 65+ and that faced by the 15-64 in each EU country.
Source: Own analysis using EU-SILC data and European Commission (2010).
These problems with theoretical replacement rates are not specific to the OMC. Mitchell & Phillips (2006) assess how replacement rates computed by the US Social Security Administration (SSA) differ for actual and hypothetical earner profiles, using data from the Health and Retirement Study (HRS). They show that, on average, actual HRS workers have substantially lower earnings paths than the medium SSA hypothetical profile, and incorporating this would make the US system 15% more generous to the average worker than reported by the pointed out that using a scenario based on historical data on rates of return and wage growth would result in a diametrically opposite result.
38
11
SSA. Rettenmaier & Saving (2006) also question the Social Security Trustees
Report‟s practice of computing replacement rates by “converting workers‟ past earnings into today‟s dollars using the rise in average wages over time” and
instead argue that price indexing would be a more accurate measure of pre-retirement resources available for consumption.
2.2 Moving beyond theoretical replacement rate measures
One could summarise the previous section by saying that theoretical replacement rates suffer from two problems; their being limited to a hypothetical case that might not be representative of the general population, and their being abstract measures of system generosity that may not play that much a role in determining the actual living standards of individuals. In fact, researchers that have sought to move beyond theoretical replacement rates have come up with two approaches; (i) look at results for various types of hypothetical cases to better approximate the actual population, and (ii) utilise other measures based on government spending and/or income survey data.
2.2.1 Increasing the number of hypothetical cases
Table 2 shows OECD replacement rate estimates for workers on different levels of wages. This makes a lot of difference for pension systems that do not have a linear earnings-related profile, particularly countries with flat-rate pensions. For instance while the replacement rate for those on half the average wage in the UK is more than double that for those earning one and a half times the average wage, in Germany and Italy replacement rates are the same across the wage distribution.
To investigate the impact of its assumptions, the European Commission requests countries to also present variants of theoretical replacement rates that
depart from these assumptions; such as a case where the individual‟s wage
12
Table 3: Different OMC theoretical net replacement rates (%)
Base case
3 years unemployed
3 years childcare
break
10 years career
break
Retire at 63
Retire at 67
Wage rising to 2xaverage Austria 84 83 82 70 77 88 76
Belgium 71 70 71 64 70 72 50
Bulgaria 59 48 46 40 51 67 59
Cyprus 53 49 49 41 53 53 45
Czech Rep 78 59 55 56 66 90 48
Denmark 74 74 74 74 73 78 46
Estonia 40 38 38 34 35 49 49 Finland 69 66 65 54 62 76 65
France 78 73 75 58 62 89 55
Germany 64 62 65 48 57 74 46 Greece 120 NA NA NA NA NA NA
Hungary 105 102 105 92 92 122 89
Ireland 84 78 81 74 81 86 62
Italy 88 84 76 68 84 93 72
Latvia 64 52 53 48 56 73 57
Lithuania 66 50 50 51 54 79 45
Luxembourg 96 93 96 80 92 97 73
Malta 79 79 79 79 79 79 46
Netherlands 104 102 100 91 93 112 78
Poland 68 66 61 57 66 70 58
Portugal 94 94 88 70 78 109 90
Slovak Rep 75 54 53 57 64 87 56
Slovenia 61 60 61 50 56 70 49
Spain 95 93 95 87 84 100 81
Sweden 65 60 65 NA 62 76 71
UK 73 71 74 58 71 77 52
Note: Replacement rates are worked out on a net of income taxes and employee contributions basis, but include employer contributions. They represent the situation of people retiring under the legislation enacted by 2008, including any transitional rules to be implemented gradually that may be legislated in enacted reforms. They also include income from private pensions if coverage is significant.
Source: European Commission (2010).
13
and seeing how they would be treated by six different public-private pension systems. The cases are a mother and unqualified part-time worker in the retail sector, a mother and qualified part-time worker in the welfare sector, a married carer working in the informal sector, a small business entrepreneur, an unqualified male worker in the car industry and a middle manager in financial services. The results differ greatly across countries, with the female workers and the business entrepreneur tending to fall below the poverty threshold, while male workers getting very high replacement, particularly in countries with strong defined benefit pension systems.
Still, trying to understand the overall impact of a system by having more hypothetical individuals raises the problem of how to weight the different cases to have a synthetic indicator of adequacy. Similarly, one needs to consider how the importance of a particular type of hypothetical case should be treated over time.
2.2.2 Spending and/or income based measures of adequacy
A rather wider measure, which departs from the concept of theoretical replacement rates, involves comparing the disposable income of retired persons
to that of other groups. Forster & Mira D‟Ercole (2005), using data collected
from an OECD questionnaire on household incomes, compute „quasi
-replacement rates‟, defined as “the mean disposable income of persons aged 66 to 75, relative to the mean disposable income of persons aged 51 to 65”.39
Two conceptually similar measures are primary pension adequacy indicators
monitored as part of the EU‟s OMC. The median relative income ratio
compares the median income of persons aged over 65 to that of those aged below 65. The other OMC indicator, i.e. the aggregate replacement ratio, compares the median individual pension income of retirees aged 65-74 in relation to median earnings of employed persons aged 50-59 excluding social benefits other than pensions. These measures differ from the longitudinal replacement rates described in section 2.1, and may suffer from cohort effects particularly in countries which in recent decades passed through rapid periods of economic growth and/or changes in participation rates, such as Eastern European countries.
39
14
Figure 2: Cross plot of median relative income ratio against the difference in the at-risk-of-poverty rate (2008)
y = -51.717x + 44.463 R² = 0.4386
-20 -15 -10 -5 0 5 10 15 20 25 30 35
0.4 0.5 0.6 0.7 0.8 0.9 1 1.1 1.2
D if fe re n ce i n r is k-of -p o ve rt y (p. p .)
Median relative income
Note: The difference in the at-risk-of-poverty rate measures the (percentage point) difference between the risk of poverty faced by the 65+ and that faced by the 15-64 in each EU country.
Source: Own analysis using EU-SILC data and European Commission (2010).
Figure 3: Cross plot of aggregate replacement ratio against the difference in the at-risk-of-poverty rate (2008)
y = -48.339x + 24.75 R² = 0.2681
-20 -15 -10 -5 0 5 10 15 20 25 30 35
0.3 0.4 0.5 0.6 0.7 0.8
D if fe re n ce i n r is k-of -p o ve rt y (p. p .)
Aggregate replacement rate
Note: The difference in the at-risk-of-poverty rate measures the (percentage point) difference between the risk of poverty faced by the 65+ and that faced by the 15-64 in each EU country.
Source: Own analysis using EU-SILC data and European Commission (2010).
[image:18.595.97.515.409.619.2]15
conceptually should be the closest to the theoretical replacement rates – displays a significantly closer relationship. There appears to be very little correlation between the aggregate replacement ratio and the theoretical replacement ratios estimated for many EU27 countries. For instance, while the gross theoretical replacement ratio for Greece is estimated at 105%, the aggregate replacement ratio for men is just 49%. Only in a few countries, notably France and Germany, the aggregate replacement ratio appears to be higher than the theoretical estimate. The aggregate replacement ratio across the EU27 stood at 55% for men and 52% for women in 2011, above the ILO-recommended 45% replacement rate and in only 4 countries it is clearly above 60%.
Another indicator developed by the EU Commission, but not used in the OMC, is the benefit ratio. The latter is defined as “the average benefit of public pensions as a share of the economy-wide average wage”.40 This measure, derived from projections of pension spending and pension beneficiaries submitted to the Commission by Member States, the average public pension (found by dividing spending by the number of beneficiaries) to the output per worker in that economy. A related indicator is the gross average replacement
rate, which is “the average first pension as a share of the economy-wide average wage at retirement”.41 These indicators differ substantially from the theoretical replacement rates, as can be seen in Table 4, and there is very little correlation when comparing results for different countries. Benefit ratios and gross average replacement rates tend to imply much less generous pension systems, with the average across the EU being very close to the ILO-recommended 45% replacement rate. Part of the gap between these measures undoubtedly reflects the inclusion of private pensions in the theoretical replacement rates estimates,42 but it is more likely that the unrealistic labour market assumptions underpinning the theoretical replacement rates play more of a role in explaining differences.
40
European Commission (2012).
41
Ibid.
42
16
Table 4: Different pension adequacy indicators compiled by the EU Commission (%)
Gross theoretical replacement
rate
Median relative income
Aggregate replacement
ratio
Benefit ratio
Gross average replacement
rate
Austria 69 92 56 42 48
Belgium 46 96 68 39 45
Bulgaria 47 77 46 46 50
Cyprus 47 80 51 43 45
Czech Rep 59 67 40 26 29
Denmark 58 83 52 36 33
Estonia 32 74 42 39 36
Finland 62 79 47 49 52
France 64 84 51 40 59
Germany 41 106 71 47 41
Greece 105 90 49 36 59
Hungary 65 88 48 31 38
Ireland 76 106 61 27 37
Italy 80 86 46 49 80
Latvia 48 94 58 24 48
Lithuania 49 82 45 39 38
Luxembourg 64 101 62 59 78
Malta 67 106 65 51 59
Netherlands 92 81 45 44 NA
Poland 59 89 53 47 49
Portugal 76 103 64 46 57
Slovak Rep 58 88 57 39 42
Slovenia 42 107 68 44 51
Spain 88 86 59 19 NA
Sweden 68 96 51 55 72
UK 61 84 61 35 35
Note: Theoretical replacement rates represent the pension entitlements of those retiring in 2008 and include income from private pensions if coverage is significant. Median relative income includes all incomes of those aged over 65, while the aggregate replacement ratio includes only pension income. The benefit ratio and the gross average replacement rate only include state pension income. The income to which these flows are compared varies from average wages (benefit ratio and, to a lesser extent, aggregate replacement ratio) to average income of the under-65s (for the median relative income ratio) to wage before retirement (gross theoretical replacement rate and gross average replacement rate).
17
Moreover the choice of the denominator of the adequacy measure is also very important. In the case of the theoretical replacement rate, pension income is
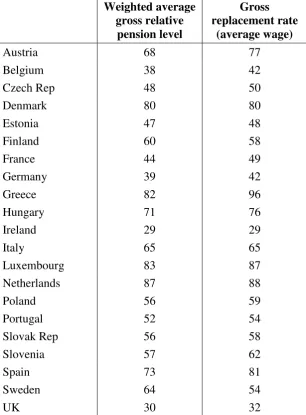
compared to the individual‟s previous income. However, while having a very high replacement rate on a very low level of previous income ensures a good degree of consumption smoothing; it would do little to help alleviate the risk-of-poverty. By comparing pension outcomes to the average wage or income, the benefit ratio and the median relative income ratio provide a better benchmark. The OECD, in recognition of this fact, also estimates relative pension levels for its theoretical full-career workers, where pension entitlements are compared to the average economy-wide wage. To also take into account the fact that pension generosity might not be linear in relation to
one‟s pre-retirement wage, the OECD then weights these relative pension levels for individuals across the wage distribution to arrive at an indicator for the whole distribution. These estimates, presented in Table 5, suggest that pension generosity can be significantly less pronounced when taking the average wage as the numeraire. The gap between the most generous pension system, Greece, and the least generous, the UK, is cut by a fifth. Only in very progressive pension systems operating in very equal societies, e.g. Sweden, the weighted average gross relative pension levels surpass the gross theoretical replacement rate for those on average incomes.
A change in denominator is also suggested in Borella & Fornero (2009), which
proposes the use of a “comprehensive replacement (CORE) rate”, defined as “the ratio between net disposable income when retired and net disposable income when active”. Income includes wages, self-employment and private income, as well as cash benefits from the state. On the other hand, Hurd &
Rohwedder (2008) propose what they call “the wealth replacement rate”. This
involves simulating consumption paths over the remaining life for a household sample observed after retirement, and then assessing whether the resources available to each household could support this consumption path. This approach not only relies on longitudinal data (very difficult to have on a consistent cross-national basis) but is also very data intensive. There have been some attempts to make this sort of adequacy assessment by means of dynamic microsimulation models.43
43
18
Table 5: Different pension adequacy indicators compiled by the OECD(%)
Weighted average gross relative
pension level
Gross replacement rate
(average wage)
Austria 68 77
Belgium 38 42
Czech Rep 48 50
Denmark 80 80
Estonia 47 48
Finland 60 58
France 44 49
Germany 39 42
Greece 82 96
Hungary 71 76
Ireland 29 29
Italy 65 65
Luxembourg 83 87
Netherlands 87 88
Poland 56 59
Portugal 52 54
Slovak Rep 56 58
Slovenia 57 62
Spain 73 81
Sweden 64 54
UK 30 32
Note: Gross replacement rates and gross relative pension levels are both compiled on the basis of male full-career hypothetical cases. However the gross relative pension levels have the economy-wide average wages as the denominator, rather than the individual‟s own wage. The gross relative pension levels are estimated for individuals across the wage distribution.
Source: OECD (2011).
3.
An alternative approach to measure pension adequacy
To summarise the previous discussion, there appear to be two lines of thought in terms of the numeraire to be used to define pension adequacy; namely
someone‟s previous earnings and average contemporary income. Both
19
unchanged conditions. This is partly justified in that actual economic behaviour will be affected by generosity (so workers in Greece have shorter careers because their system provides incentives for them to do so). However it is debatable whether such a theoretical measure is useful to study the poverty alleviation function of pensions.
Interestingly the literature review reveals that there has been little discussion of one particularly major issue with replacement rates – namely their limitation to being single point-in-time indicators. Isolating pension generosity at a single point-in-time fails to take into account differences in longevity and state pension ages between generations and also ignores how pension payments change over the period in retirement. As OECD (2005) points out, these constitute very significant factors, particularly when comparing pension policy on a cross-country basis. A country with low life expectancy could „afford‟ to pay higher replacement rates to its citizens while imposing the same financial burden on workers as a country with higher life expectancy but with lower replacement rates. Similarly a country where pensions lose their relative value significantly over time, can afford to pay a higher replacement rate at retirement than a country where the relative value of pension benefits remains constant throughout retirement.44
These issues matter. Increasing longevity is one of the reasons why pensions have become so topical for governments. Changing the eligibility age has been the most frequent parametric pension reform carried out since the 1990s.45 At first the main change was the equalisation of pension ages between men and women (e.g. Austria, Slovakia), but increasingly countries (e.g. Germany, UK) are raising the age for both genders. At the same time, some countries (e.g. Italy, Sweden) have introduced defined contribution systems, which penalise retiring at the same age if life expectancy rises. Under these systems the same amount of contributions translates into less annual pension if the period which is meant to be covered increases. Another frequent reform has been the shift from uprating pensions in line with changes in average earnings. For instance, Austria and Germany at first moved towards linking pensions to net earnings, so that the burden of higher social security contributions would be more fairly shared between workers and pensioners. More recently, Austria adopted price
uprating while Germany introduced the „sustainability factor‟ to adjust pension benefits to changes in the dependency ratio. Very few countries now have in place pension systems where generosity stays constant in relative earnings terms.
44
Indexation, of course, can reduce the generosity of all types of social benefits. See Sutherland et al (2009) for a review of how indexation has affected the British welfare system over time.
45
20
The impact of indexation on generosity can be quite substantial. Table 1 includes OMC estimates of gross and net theoretical replacement rates for someone at retirement (at age 65) and ten years after (at age 75). On average, across the EU there is a drop of 11% and 10% in gross and net replacement rates, respectively. In some countries, the declines are much more pronounced (e.g. nearly a third in Latvia, a fifth in Poland and Greece). Given that life expectancy in 2010 for men and women was close to 20 years, the ten-year period constitutes just the half-life of a pension stream. If the relative value loss proceeds in a linear fashion, by the last year of life pensions would be a fifth less in earnings terms than at the beginning. This impact would be even more pronounced if earnings growth accelerates over time, for example as a result of economic convergence between EU countries.
The best way to address such concerns is by resorting to estimates of pension wealth.46 Brugiavini et al (2005), while noting that “there is no simple and
unique definition of pension wealth” argues that “for an individual, pension
wealth is, broadly speaking, the present discounted value of future pension rights, taking into account of mortality prospects.” In mathematical notation, this can be expressed as:
∑ ………. (1)
where is pension wealth at age of retirement (h), S is the age of certain death, β is the pure time discount factor, a is the age of the individual, is the conditional survival probability at age (s) for an individual alive at age (a) and
is the pension expected at age (s).
Equation (1) brings out the advantages of pension wealth estimates over replacement rates. Firstly, this is a measure that expressly takes into account the period for which benefits will be received. Increased longevity increases pension wealth, but it does not impact replacement rates. Similarly an increase in pension age decreases pension wealth, while it does not show up in changes in replacement rates. The inclusion of a discount factor helps address the well-known economic fact that income streams in the future are less attractive than earlier ones. Secondly, pension wealth measures the entire income stream, rather than focusing on just one payment in time. Thus if pension benefits fall in relative value over time, pension wealth would be less than if they stay constant. A replacement rate tells you nothing about how it will evolve.47 A reform changing indexation would not change the replacement rate at retirement, but it would clearly show up when looking at pension wealth.
46
The concept of pension wealth was first used in applied economics in Feldstein (1974).
47
21
OECD (2011) suggests that pension wealth “can be thought of as the lump sum
needed to buy an annuity giving the same flow of pension payments as that promised by mandatory retirement-income schemes”. Take, for instance, a case where the pension benefit is equivalent to 50% of average earnings throughout a retirement period of 20 years. Assuming away time preference over when to receive the money, you would be as better off if you forgo receiving pensions in lieu of a payment equivalent to ten times average earnings. If however benefits are expected to fall in relative terms by a tenth every ten years (broadly in line with the EU average decline in replacement rates over time), you would require just a payment of nine times.
There are two ways in which pension wealth is typically calculated – the empirical and the institutional approaches. The empirical method involves using data from income and wealth surveys. As a result it tends to be retrospective in that it reflects current entitlements and past pension system rules.48 By contrast, the institutional approach tries to calculate prospective
pension entitlements by applying “the pension system‟s parameters – such as accrual rates, minimum pensions, indexation rules, eligibility requirements etc.
– to calculate pension benefits”49
for a number of stylised individuals and then grosses up results. In this section we present pension wealth estimates computed using this approach for ten EU countries which have undergone considerable pension reforms.50 These countries, namely Austria, Finland, France, Germany, Hungary, Italy, Poland, Slovakia, Sweden and the UK, not
only cover 70% of the EU‟s population, but also have very different pension systems and enacted very different reforms.51 These pension wealth estimates
were computed using the OECD‟s APEX cross-country pension entitlement model52 and cover only state pensions (including minimum pensions53). Our
48
For a thorough discussion of this approach and how it is being integrated in national accounts see ECB (2009). There are variants of this approach which try to incorporate future entitlements by trying to project the impact of future rules.
49
See Whitehouse (2003).
50
Note that these estimates are based on the pension system rules as at 2010. The deterioration of the sovereign debt crisis led to some subsequent reforms, particularly in Hungary and Italy, where generosity was cut substantially (see European Commission (2012) for details). However for the other countries these estimates remain valid.
51
For a brief description of these reforms, see Grech (2010).
52
The APEX (Analysis of Pension Entitlements across countries) model was originally developed by Axia Economics, with funding from the OECD and the World Bank.
The model codes in detail the parameters of a country‟s pension system (which are vetted by social security officials from that country). It is used by the OECD‟s biennial „Pensions at a Glance‟ publication, the World Bank‟s „Pensions Panorama‟
and forms the basis of one of the OMC indicators (the prospective change in net theoretical replacement rates).
53
22
estimates compare the pre-reform (i.e. the pension system rules for pensioners retiring now) with the post-reform (i.e. the rules under which people will retire in 2050) pension systems.
The OECD publishes estimates of pension wealth, but these are for the standard full-career case. By contrast, our results try to approximate reality better by adopting an alternative measure of career length based on Labour Force Survey data on labour market participation by age and gender.54 In all ten countries, elderly women are much more at-risk-of-poverty than elderly men. Yet, by assuming full careers for women, OECD estimates of pension wealth for women are higher than those for men, as women have longer life expectancy. Also, rather than focus on the median case, our focus is on individuals in the bottom half of the wage distribution who tend to be more dependent on state pensions and less reliant on other forms of retirement income provision. Table 6 compares these estimates of pension wealth with those for someone with a full-career and on average wages.
Across the ten countries, adjusting for actual-careers and the level of wages lowers net pension wealth. The reduction is, as expected, largest for women, who get only 80% of the full-career average wage entitlement. However the reduction for men is also strong, at 85%, particularly in countries with relatively low employment rates (e.g. Slovakia). While the full-career estimates
suggest women get the equivalent of one year‟s average wage more than men,
adjusting for actual labour participation and lower wage levels reveals that they get roughly the same amount as men. Links between the level of contributions and that of benefits offset most of the impact of having a higher life expectancy. More simply, women have to make nearly the same pension entitlements last for more than men. Keep in mind that, even ignoring lesser entitlements due to lower wages and more broken careers, pension wealth estimates suggest that women are worse off than men – something that replacement rates do not show. In fact, the net replacement rates published by
the OECD, and used in the EU‟s OMC, are the same for both genders. If
pensions maintained their relative value over time, one would expect the difference in longevity between men and women to be reflected in an equivalent difference in net pension wealth. By contrast, across these ten countries while post-retirement longevity is 17.5 years for men and 23.3 years for women (i.e. a third higher for women), even with the same wage and labour participation, net pension wealth of women is just 15% higher. The worst affected are those in countries with long retirement periods where pensions are indexed to prices. For instance, in Poland while the post-retirement longevity
54
23
[image:27.595.95.502.187.460.2]differential between genders is 60%, that in pension wealth is just 6%. Unsurprisingly the risk-of-poverty among elderly women is 6.9 percentage points (70%) higher than that for men. In Germany, where there is not such a differential, the gap in poverty rates is half as large.
Table 6: Net pension wealth estimates for current pension systems (multiple of average wage)
Male full-career on average wage
Male actual-career in bottom half of
wage distribution
Female full-career on average wage
Female actual-career in bottom half
of wage distribution
Austria 7.8 8.1 8.6 8.2
Finland 7.5 5.3 8.9 5.8
France 8.3 6.8 9.4 5.5
Germany 6.1 5.2 7.4 4.8
Hungary 9.2 6.2 11.4 8.5
Italy 8.8 8.4 9.6 8.4
Poland 7.0 4.6 7.4 6.2
Slovak Rep 9.2 8.3 11.3 8.7
Sweden 6.6 6.2 7.5 6.1
UK 4.4 3.8 5.1 4.5
Average* 7.0 5.9 8.0 6.0
Note: Net pension wealth for actual-career case based on labour market participation by age and sex data. See Grech (2012) for details. The actual-career case reflects the pension entitlements for those earning a wage up to the 50th percentile of the wage distribution.
* Weighted average by population.
Source: OECD (2011) and own estimates using same model used in OECD (2011).
To link better the adequacy indicator to the risk-of-poverty among pensioners, pension wealth estimates need to be compared with a quantitative benchmark.55 For this purpose we compute that measure of total pension flows which would enable an annual income equal to the poverty threshold throughout retirement.
If net pension wealth is higher than this „net pension requirement‟, on average, the pension system would be preventing poverty during retirement.56 Net
55
In this paper we focus on the poverty alleviation dimension of pension adequacy. Pension wealth can, however, be used to look at the income replacement dimension (one would need to redefine pension wealth from multiples of the economy-wide
average wage to multiples of the individual‟s pre-retirement wage) and the intergenerational dimension (by comparing pension wealth entitlements of successive cohorts). Grech (2010) provides indicators for all three dimensions.
56
Note however that since transfers are not constant for all years, even when net
pension wealth is equal to the „net pension requirement‟ there may be years when one
24
[image:28.595.94.502.232.468.2]pension requirements for 2005 and 2050 are presented in Table 7. These suggest for instance, that given the current anticipated length of retirement, men in Austria require net pension wealth of at least 5.1 times the average wage if they are to stay out of poverty, on average, throughout their retirement. Women tend to have a higher net pension requirement than men, as they live longer. At present, in some of these countries, they also have lower pension ages.
Table 7: Net pension wealth requirement to remain out of risk-of-poverty (multiple of average wage)
Men Women
2005 2050 2005 2050
Austria 5.1 7.2 6.5 7.2
Finland 4.9 6.1 6.1 6.9
France 6.5 7.6 7.7 8.5
Germany 5.1 6.0 5.8 6.6
Hungary 5.3 7.5 6.6 7.2
Italy 5.3 7.4 6.3 7.2
Poland 4.2 6.7 5.9 7.7
Slovak Rep 5.3 7.1 6.2 7.0
Sweden 5.3 6.2 6.1 6.9
UK 5.0 7.0 5.3 5.7
Average* 5.3 6.9 6.2 7.1
Note: Net pension wealth requirement is the pension wealth required so that the average annual pension is enough to keep one above the risk-of-poverty (i.e. 60% of the median equivalised income).
* Weighted average by population.
Source: Own estimates using discount rate of 2% and Eurostat life expectancy projections.
The benefit of having this benchmark is that it directly conveys information about the strength of the poverty alleviation function of the pension system. For instance, if we know that given the current life expectancy in Austria, to remain, on average, out of risk-of-poverty a man needs pension wealth equivalent to 5.1 times the average wage, this immediately suggests that current pension wealth of 8.1 is more than sufficient. By contrast knowing that the gross replacement rate for someone on the mean wage in Austria is 69%
tells us little on the pension system‟s efficacy in reducing risk-of-poverty,
especially since replacement rates are in terms of one‟s previous income and
not the current poverty threshold.
25
life expectancy. If pension wealth stays the same, the net pension requirement benchmark helps us to realise that pensioners have to spread over a larger number of years the same transfers that their predecessors had. By contrast, a replacement rate at the point of retirement is not usually affected by a change in life expectancy.57 Since pensions lose their relative value over time, if life expectancy is higher, having the same replacement rate in the future could well imply a weaker poverty alleviation function of pensions.
Similarly having a net pension requirement benchmark improves our evaluation of the impact of pension age changes. The latter tend to leave replacement rates unchanged while reducing pension wealth. Using replacement rates, one would conclude there was no change in generosity, and vice-versa if one uses pension wealth. However by reducing the period in retirement, pension age changes also limit the net pension requirement. For instance, at present Polish men, due to their low life expectancy, have a net pension requirement considerably lower than men in the UK – who face their same pension age of 65. By 2050, the situation will be reversed, even though Polish men will still have shorter life spans than UK men. However the latter will start receiving their pensions at 68, rather than at 65 like Polish men. Table 7 shows that the net pension requirement for men is going to increase more than that for women. This reflects the fact that pension age equalisation will offset a lot of the anticipated increase in longevity for women.
Table 8 presents net pension wealth estimates for 2050 for those in the bottom half of the wage distribution computed on the basis of EU Commission forecasts of labour participation rates and Eurostat life expectancy projections. These estimates suggest that despite cuts in pension generosity and increases in pension ages,58 net pension wealth should still rise slightly across the ten countries under review.59 The increase in pension entitlements is lower than the expected rise in the period in retirement. Pension wealth will need to be spread more thinly, so to speak, across a longer retirement period.
57
Unless the system has defined contribution elements, in which the annual benefit depends on the period over which the cumulative pension entitlements need to be spread. In this case, higher longevity lowers replacement rates.
58
In the absence of the pension reforms carried out since the mid-1990s, net pension wealth across these ten countries would have increased by about 47% for men and 26% for women, which coupled with the increase in the pensioner cohort size would have resulted in very high fiscal burdens.
59
26
Table 8: Net pension wealth estimates for those in the bottom half of the wage distribution (modelled to reflect their projected actual career) retiring in 2050 (multiple of average wage) compared to OMC indicator on
replacement rates
Men Women
Net pension wealth 2050
% Change on 2005
Net pension wealth 2050
% Change on 2005
Austria 8.1 -1 7.3 -11
Finland 8.5 +61 8.2 +43
France 5.7 -15 6.5 +18
Germany 6.0 +16 6.4 +35
Hungary 7.2 +17 7.0 -17
Italy 7.1 -16 6.1 -28
Poland 4.9 6 4.4 -28
Slovak Rep 5.2 -37 4.8 -45
Sweden 6.7 +8 6.5 +6
UK 5.2 +36 5.3 +18
Average* 6.0 +2 6.0 +1
Note: Net pension wealth for actual-career case based on labour market participation by age and sex data. See Grech (2012) for details. The actual-career case reflects the pension entitlements for those earning a wage up to the 50th percentile of the wage distribution.
* Weighted average by population.
27
Figure 4: Achievable poverty thresholds based on net pension wealth entitlements of men in the bottom half of the wage distribution
Source: Own estimates using same model used in OECD (2011). Net pension requirement based on discount rate of 2% and Eurostat life expectancy projections.
Figure 5: Achievable poverty thresholds based on net pension wealth entitlements of women in the bottom half of the wage distribution
Source: Own estimates using same model used in OECD (2011). Net pension requirement based on discount rate of 2% and Eurostat life expectancy projections.
0 60
Austria Finland France Germany Hungary Italy Poland Slovakia Sweden UK Average
Achievable poverty threshold (% of mean disposable income)
2050
Current
0 60
Austria Finland France Germany Hungary Italy Poland Slovakia Sweden UK Average
Achievable poverty threshold (% of mean disposable income)
[image:31.595.87.504.432.711.2]