http://www.scirp.org/journal/jsea ISSN Online: 1945-3124
ISSN Print: 1945-3116
The ISBSG Software Project Repository:
An Analysis from Six Sigma Measurement
Perspective for Software Defect Estimation
Mhammed Almakadmeh, Alain Abran
École de Technologie Supérieure, Université du Québec, Montréal, Canada
Abstract
The International Software Benchmarking Standards Group (ISBSG) provides to researchers and practitioners a repository of software projects’ data that has been used to date mostly for benchmarking and project estimation purposes,
but rarely for software defects analysis. Sigma, in statistics, measures how far a
process deviates from its goal. Six Sigma focuses on reducing variations within processes, because such variations may lead to an inconsistency in achieving projects’ specifications which represent “defects”, which mean not meeting customers’ satisfaction. Six Sigma provides two methodologies to solve or-ganizations’ problems: “Define-Measure-Analyze-Improve-Control” process cycle (DMAIC) and Design of Six Sigma (DFSS). The DMAIC focuses on im-proving the existed processes, while the DFSS focuses on redesigning the ex-isting processes and developing new processes. This paper presents an ap-proach to provide an analysis of ISBSG repository based on Six Sigma mea-surements. It investigates the use of the ISBSG data repository with some of the related Six Sigma measurement aspects, including Sigma defect measure-ment and software defect estimation. This study presents the dataset prepara-tion consisting of two levels of data preparaprepara-tions, and then analyzed the qual-ity-related data fields in the ISBSG MS-Excel data extract (Release 12 - 2013). It also presents an analysis of the extracted dataset of software projects. This study has found that the ISBSG MS-Excel data extract has a high ratio of missing data within the data fields of “Total Number of Defects” variable, which represents a serious challenge when the ISBSG dataset is being used for software defect estimation.
Keywords
ISBSG, Six Sigma, Defect Estimation, DMAIC, Design for Six Sigma, COSMIC Function Points
How to cite this paper: Almakadmeh, M. and Abran, A. (2017) The ISBSG Software Project Repository: An Analysis from Six Sigma Measurement Perspective for Soft-ware Defect Estimation. Journal of SoftSoft-ware Engineering and Applications, 10, 693-720.
https://doi.org/10.4236/jsea.2017.108038
Received: May 22, 2017 Accepted: July 8, 2017 Published: July 11, 2017
Copyright © 2017 by authors and Scientific Research Publishing Inc. This work is licensed under the Creative Commons Attribution International License (CC BY 4.0).
http://creativecommons.org/licenses/by/4.0/
1. Introduction
Six Sigma has achieved recognizable success over the past 20 years in industry in general, while only a few studies have been conducted within the software in-dustry to explore its use and expected benefits. In particular, there is a lack of Six Sigma related empirical studies based on large repository of software project da-ta such as the repositories of the International Software Benchmarking Sda-tan- Stan-dards Group (ISBSG).
Since the 1980’s, Six Sigma is registered as a trademark of Motorola in the USA (Motorola, 2004). It is based on the Edwards Deming’s Plan-Do-Check-Act
cycle [1]. Six Sigma is considered as a data-driven suite of improvement
metho-dologies based on a common philosophy and it is supported by tools for
mea-surements and for process and product improvement [2]. Six Sigma involves a
long term commitment that requires a full commitment from upper
manage-ment in the organization to change decision making strategies [3]. In the last 20
years, the use of Six Sigma has increased in different industries [3].
One of the major differences between Six Sigma and other quality initiatives is
that it involves a project by project approach of implementation [4]. Six Sigma
focuses on both management and technical components [5]:
A. The management components involve to select the right people for Six Sigma
projects, to select the right process measures, to provide resources for Six
Sigma training, to provide clear direction to project selection, etc. [5].
B. The technical components focus on process improvements by reducing
vari-ation using certain statistical tools and techniques adopted for problem
solv-ing purposes [5].
Six Sigma can help organizations to improve their business processes and bottom-line issues: Six Sigma implementation involves determining customer’s
requirements and defining defects in terms of their “critical to quality”
parame-ters [6].
The success of Six Sigma in different industries over the last two decades has encouraged exploring Six Sigma applications in other industries, such as the
software industry [1] [7] [8] [9] [10] and [11]. Although Six Sigma has been
adopted by many industries, it still considered new in the software industry [5].
Few research studies on Six Sigma have been published in the software litera-ture: on the one hand, some challenge whether Six Sigma can be indeed relevant
to software organizations [8], while other such as [5][12] claim that Six Sigma
can bring large benefits to software organizations.
The International Software Benchmarking Standards Group (ISBSG) was founded in 1994 by a number of national software measurement associations
[13] to:
• Develop “the profession of software measurement by establishing a common
vocabulary and understanding of terms”.
• Provide “software development practitioners with industry output standards
improve the management of IT resources by both business and government”
[14].
The ISBSG dataset provides “software development practitioners with
indus-try output standards against which they may compare their aggregated or indi-vidual projects, and real data of international software development that can be analyzed to help improve the management of Information Technology (IT) re-sources by both business and government” [15].
The data collected using the ISBSG data collection questionnaire are assem-bled, evaluated, and stored in a database in Australia. A standardized extract of a number of data fields in this database is provided for a fee in the format of a Re-lease; moreover, in addition to these ISBSG Releases, special extracts of
addi-tional data fields are available upon a specific request for research purposes [16].
The ISBSG database of software projects is a multi-organizational and mul-ti-environment dataset with more than 100 data fields on more than 6000 projects from industry and public organizations, the majority of which were col-lected after 2001; these projects are related either to software development and
software enhancements and from various software industry sectors [16].
The ISBSG repository collects a large number of independent variables and a considerable amount of descriptive information on the various characteristics of software projects, including quality-related data fields, through the software life cycle phases [17].
The data fields include, for instance, information about project staffing, effort by phase, development methods and techniques, team work, project type, or-ganization type, software process along with the various life cycle phases, tech-nology and tools used for developing and carrying out the project, people and work effort for each project team member, software product, quality attributes,
size attributes, and so on [16].
The International Software Benchmarking Standards Group (ISBSG) provides to researchers and practitioners a repository of software projects’ data that has been used to date mostly for benchmarking and project estimation purposes, but rarely for software defects analysis. Sigma, in statistics, measures how far a process deviates from its goal. Six Sigma focuses on reducing variations within processes, because such variations may lead to an inconsistency in achieving projects’ specifications which represent “defects”, which means not meeting customers’ satisfaction. Six Sigma provides two methodologies to solve organi-zations’ problems: “Define-Measure-Analyze-Improve-Control” process cycle (DMAIC) and Design of Six Sigma (DFSS). This paper investigates the use of the ISBSG data repository with some of the related Six Sigma measurement aspects, including Sigma defect measurement and software defect estimation.
The rest of this paper is structured as follows. Section 2 presents overview of Six Sigma from the scientific research literature in software and in general: Six Sigma definitions, concepts, and the statistical toolkits.
ex-tract release 12 of 2013.
Section 4 presents the quality-related information in the ISBSG questionnaire, and conducts a mapping of the ISBSG questionnaire to the related measurement steps in Six Sigma (DMAIC and DFSS) methodologies. It presents the data set
preparation which consists of two levels of data preparation based on [18], and
next analyzes the quality-related data fields in the ISBSG MS-Excel data extract (Release 12 - 2013). It also presents an analysis of the extracted software projects of the ISBSG dataset.
Finally, section 5 summarizes the research findings and recommendations, and suggests a number of the future related research challenges.
2. Six Sigma—Overview
Six Sigma has evolved over the last two decades and its definition can have dif-ferent meanings. For instance, Six Sigma has been extended to three levels in
[19]:
• a measurement system;
• a methodology:
- DMAIC which stands for “Define-Measure-Analyze-Improve-Control”, and
- DFSS which stands for “Design for Six Sigma”.
• a management system.
The Six Sigma approach satisfies all three levels at the same time. This paper focuses on two perspectives of interest: as a Sigma level and as related measure-ment steps in improvemeasure-ment methodologies (DMAIC and DFSS).
2.1. Six Sigma as a Measurement System
Six Sigma can be defined as a statistical expression which measures the quality of meeting customer’s requirements. “The term ‘Sigma’ is often used as a scale for levels of ‘goodness’ or quality”. Using this scale, ‘Six Sigma’ equates to 3.4 defects
per one million opportunities (DPMO) [19]. Figure 1 illustrates how Six Sigma
measures quality. In Figure 1 for example, when 30.9% of products are without
defects, the Sigma level is 1; and when 99.9997% of products are without defects, the Sigma level is 6. Fewer defects correspond to higher level of Sigma, and thus higher level of customer satisfaction: each additional Sigma level corresponds to
an exponential reduction in defects [20].
Figure 1 illustrates a process that is centered with a normality distribution
with mean (μ) aligned with target (T), and the specifications located six standard
deviations on to the mean sides [2].
The “sigma level” corresponds to “where a process or product performance
falls when compared to customer specifications. In other words, the difference between the upper and lower bounds of the customer specification (denoted by the Lower Specification Limit, or LSL, and Upper Specification Limit, or USL)
Figure 1. How six sigma measures quality [21].
The key measurements used in Six Sigma include [2]:
• Critical to quality (CTQ),
• Mean (μ),
• Standard deviation (δ),
• The common Six Sigma Defect measures such as: Defect rate: Defects Per
Unit (DPU) or Defect Density (DD), Sigma level, Process capability indices (CP, CPk), and Yield.
As result to the natural drifting that can occur in the process execution, it is observed that it over time the process mean drifts from the target by 1.5-standard
deviation [2]: therefore, the long-term standard deviation of the process will be
greater than the observed one on the short-term [22]. In other words, when a
process fits on “6 sigma” between the process mean and one of the nearest speci-fication limit in a short-term data variation, it will be “4.5 sigma” in the long term fit. So the six sigma process in fact corresponds to “4.5 sigma” referred to
as “6 sigma” minus the 1.5-sigma shift [22]. The long-term data variation, on the
other hand, contains common cause variations and special cause variations [23].
However the short-term data variation does not contain the special cause varia-tion, so basically, it will have a higher process capability than the long-term data variation [23].
2.2. Six Sigma as a Problem Solving Methodology
Six Sigma provides two methodologies to solve organizations’ problems: DMAIC and Design of Six Sigma (DFSS).
2.2.1. Six Sigma DMAIC
[4] and is summarized in Table 1. Six Sigma DMAIC involves process im-provement that can be achieved through a systematic approach for reducing variation and defects of existing processes.
2.2.2. Design for Six Sigma (DFSS)
Design for Six Sigma (DFSS) is a Six Sigma approach that involves designing
new or re-designing processes and products at early stages of the life cycle [4].
Most DFSS training courses and textbooks divide the process into between four
to six phases [24]: they may vary within the steps included on each one [24];
however, they all have similar objectives and goals [2] [24] [25]. This study
adopts the Chowdhury’s framework of IDDOV; however, it must be noted that
IDDOV will be treated as five process cycle phases [24]: Identification-Design-
Development-Optimization-Verification—see Table 2.
Besides the IDDOV framework, there are other DFSS frameworks such as:
• Define, Measure, Analyze, Design, Verify (DMADV)
• Concept, Design, Optimize, Verify (CDOV)
• Define, Measure, Analyze, Design, Optimize, Verify (DMADOV)
The Six Sigma of DMAIC and DFSS methodologies are complementary
strat-egies and employ some of the same tools and techniques [24]. However, there
are differences between them and Table 3 outlines those differences [24]. When
[image:6.595.208.536.412.603.2]deciding whether to use DFSS techniques or the traditional Six Sigma DMAIC it
Table 1. DMAIC process [20].
Steps Key processes
Define Define the requirements and expectations of the customer. Define the project boundaries. Define the process by mapping the business flow.
Measure Measure the process to satisfy customer’s needs. Develop a data collection plan. Collect and compare data to determine issues and shortfalls.
Analyze Analyze the causes of defects and sources of variation. Determine the variations in the process. Prioritize opportunities for future improvement.
Improve Develop creative alternatives and implement enhanced plan. Improve the process to eliminate variations.
[image:6.595.169.537.414.751.2]Control Develop a strategy to monitor and control the improved process. Control process variations to meet customer requirements. Implement the improvements of systems and structures.
Table 2. IDDOV process [24].
Steps Key processes
Identification Identify the opportunity and Define the requirements. Design Define initial design.
Development Develop the high level design concepts and design alternatives to select the best design.
Table 3. Differences between six sigma DMAIC and DFSS [24].
Element Six Sigma DFSS
Focus Existing process New process
Goal Reduce variation Reduce variation and optimize performance
Action taken Analyze Design
Best suited for Maximizing current process Developing new products or reengineering existing processes
Major effect is on CP (reducing variation) CPk (centering within customer requirements)
is important to consider whether the project involves a new process or an
exist-ing one [24]: DFSS is best employed on new products and processes, while the
Six Sigma DMAIC is used to improve existing ones [24].
DFSS works on the Design phase in the software life cycle, while the DMAIC
comes after the Design phase of the software development life cycle [24].
DFSS share the same goals with DMAIC, and can be represented as a contin-uing step to Six Sigma DMAIC; it also provides a set of tools and techniques that
help to reduce variation in the process design [24]. The DFSS is an addition to
DMAIC initiatives, not a replacement. The expected process Sigma level for a
DFSS product is at least 4.5 [24][25].
The goal of Six Sigma is to have processes or products that are almost defect
free: achieving this goal is not as simple as it sounds [24]: it requires hard
work-ing and full commitment from the organizations’ top management. However, it is possible for organizations that follow the DMAIC model to adopt Six Sigma tools as their statistical toolkit [24].
2.3. Tools and Techniques in Six Sigma
Tools used in Six Sigma include qualitative and quantitative (statistical) tools for data analysis, root cause analysis, root cause validation, and identification and
selection of process improvements [2]:
• Qualitative tools refer to: process mapping, fishbone diagram, cause and
ef-fect matrix, failure mode efef-fects analysis (FMEA), etc.
• Quantitative tools refer to: Kruskal-Wallis, one- and two-sample T-test,
analysis of variance, confidence intervals, F-tests, one- and two-proportion tests, Monte Carlo simulation, regression, Design of Experiments (DOE), etc.
3. The International Software Benchmarking Standards
Group (ISBSG)
3.1. ISBSG Data Repository—Overview
In software engineering, the data collected for empirical studies is very impor-tant. Data repositories such as the ISBSG provides a free set of questionnaires to collect data on software projects, including software functional size measured with measurement methods recognized by ISO. ISBSG collects data in a reposi-tory and provides an extract of data to practitioners and researchers in a
Figure 2. Management of the ISBSG repository [17].
The data collection questionnaire is available on the ISBSG website
(http://isbsg.org/data-collection-questionnaires/) and includes a large number of quantitative and descriptive information on the different characteristics of a software project, namely: team project effort by phase of development, the de-velopment methods and techniques, etc.
ISBSG provides to its users a dictionary of the terms and measures it has de-fined to facilitate the understanding of the questionnaire, to assist in the collec-tion of project data in the repository and to standardize the way that the data
collected are analyzed [13]. The questionnaire consists of seven sections broken
down into several sub-sections.
ISBSG offers at a modest license fee the public the data collected from various organizations around the world, with different methodologies, techniques and
phases of the software life cycle, and in standard format [17]. For example,
ISBSG provides useful data for multiple purposes, namely the comparison of
productivity models, models for estimating the effort, etc. [17]. Such models can
be used by organizations to improve their capacity in terms of planning and control of projects. In addition, the ISBSG repository collects a large number of numeric data on the different characteristics of the software project, including
with its various project phases from planning to completion [17]. The ISBSG
collects data related to software quality that span the entire software life cycle, from project initiation to project completion.
3.2. ISBSG Internal View
The internal view of the ISBSG data repository corresponds closely to their data collection questionnaire, with some additional fields added by their repository
manager [26].
data set which contains software project data collected from various organiza-tions around the world from 1989 on. This data set has been used in number of
studies focusing on software estimation, such as in [13] to estimate software effort.
For example, the ISBSG provides data are related to:
• Defect prediction: such as number of defects recorded during the various
software life cycle phases, effort, size in Function Points and LOC (Lines Of Code), number of requests for specification changes during the software life
cycle, type of application, etc. [16].
• Effort prediction: such as effort by phases, summary work effort, normalized
work effort, etc.
The ISBSG questionnaire contains six parts [26]:
• Project attributes
• Project work effort data
• Project size data (in Function Points)
• Project quality data
• Project cost data
• Project estimation data
For the purpose of software benchmarking, ISBSG collects, analyzes and re-ports data relating to products developed and processes implemented within
or-ganizational units in order to [26]:
• Support effective management of the processes.
• Objectively demonstrate the comparative performance of these processes.
The projects have been submitted from 25 countries and the major contribu-tors are: the United States, Japan, Australia, Finland, Netherlands and Canada
[13]. The data extract contains different types of projects: 61 percent are
en-hancements, 37 percent are new developments, and 2 percent are re-develop- ment projects.
The ISBSG offers 141 data fields in the data extract: they are not all necessarily filled out by the submitters since only a subset of the data fields is mandatory.
Software Functional Size is measured in Function Points. The four main Function Points measurement methods represented in the Repository are IFPUG, COSMIC, FiSMA and NESMA.
There are various data collection questionnaires of ISBSG data that have the same structure with a slight difference in Section “Functional size”. In this re-search work the COSMIC functional sizing method has been selected. The COSMIC method can be used to measure the size of a change (addition, modifi-cation or deletion) to software of one CFP, and it can also be used to measure
the size of software that is added, changed or deleted [27], whereas it is not
possible to measure the size of a change to a software component with the IFPUG method for example: IFPUG can only be used to measure the size of
software components that are added, changed or deleted [27].
The ISBSG data collection questionnaire includes 7 sections divided into
sub-sections [27]—see Table 4 and Figure 3.
Table 4. Number of questions within the ISBSG COSMIC questionnaire.
Section Number of questions
Submitter information 4
Project process 51
Technology 9
People and work effort 23
Product 7
COSMIC project functional size 30
Project completion 17
Total 141
Figure 3. Structure of the ISBSG COSMIC data collection questionnaire [26].
B. Project Process: collects information about how the project was performed. C. Technology: collects information about the technology used on the project. D. People and Work Effort: collects descriptive information about the people
who worked on the project and the effort they expended.
E. Product: collects description about the software product or application created or enhanced.
software.
G. Project Completion: collects overview information on the project comple-tion.
(For more details: http://isbsg.org/data-collection-questionnaires/).
3.3. Anonymity of the Data Collected
The ISBSG recognizes the imperative of guaranteeing the anonymity of the or-ganizations that submit data to its repositories. The ISBSG carefully follows a secure procedure to ensure that the sources of its data remain anonymous. Only submitters can identify their own projects/applications in the repositories using the unique identification key provided by the ISBSG manager on receipt of a submission.
3.4. Extract Data from the ISBSG Data Repository
The ISBSG assembles this data in a repository and provides a sample of the data fields to practitioners and researchers in an Excel file. All of the information on a project is reviewed by the ISBSG data administrator and rated in terms of data quality (from A to D). In particular, the ISBSG data administrator looks for omissions and inconsistencies in the data that might suggest that its reliability could be questioned.
For this study, the ISBSG data repository was selected in particular because the ISBSG collects data on the quality of software that spans the entire life cycle of a software project, from its inception to its completion.
4. Data Preparation: ISBSG and Six Sigma
4.1. Quality-Related Information in the ISBSG Questionnaire
The ISBSG data collection questionnaire [13] was analyzed in order to identify
the data fields that collect information directly related to software quality. The data quality fields among the data collected in the Project Process category and
the Project Completion category are listed in Appendix A. A number of data
fields such as software size, number of defects are included in this list since they are useful for normalization purposes in order to calculate quality-related ratios, such as defect density.
From Appendix A, it can be observed that:
- The “Number of defects reported” is present in most of project phases (Q.27,
Q.32, Q.38, Q.43, and Q.49) except the planning phase. For three ISBSG phases (e.g., build or programming, test, implementation or installation) and (Q.130) in the project completion category (e.g., the information collected for defects reported during the first month of the software operation by the us-ers), the number of defects is classified into three defect levels (ISBSG 2013a):
- Minor defect: “Does not make the software unusable in any way”.
- Major defect: “Causes part of the software to become unusable”.
- The defects data fields correspond to the quality section in the ISBSG MS-Excel
data extract structure—see Table 5.
- The “Number of change requests made” is also collected for most of project
phases (Q.33, Q.39, Q.44, Q.50), that is from design to implementation or in-stallation phases.
- The User Satisfaction Survey (Q.132) collects information about the
satisfac-tion level as perceived by the end user, and the project cost collects informa-tion about Development team costs, Customer/End-user costs, and IT opera-tion costs.
4.2. Mapping the of ISBSG Questionnaire to Six Sigma
Methodologies (DMAIC and DFSS)
This section presents the detailed mappings between the six sigma methodolo-gies of DMAIC and DFSS (IDDOV) with the ISBSG questionnaire data. The mapping of ISBSG questionnaire sections to Six Sigma for software is presented in Appendix B and Appendix C.
From Appendix B and Appendix C, it can be observed that:
The DMAIC for process improvement comes after the design stage of
soft-ware development process, which focuses on enhancing the existed processes, whereas, the DFSS-IDDOV methodology comes before the design stage, which allows for re-designing processes before the implementation phase of projects process.
The DMAIC approach aligns with the software enhancement sub-section
within the COSMIC Project Functional Size category.
The DFSS-IDDOV approach aligns with the software new development and
re-development’ sub-section within the COSMIC Project Functional Size category.
In contrast, questions (104, 105, 106, 107, 108, and 109) in Appendix C
ob-tain information on functional size when to improve the existing processes (through adding, changing, or deleting functionalities).
Questions (98 and 99) collect the software functional size when to re-design
existing process or designing new of processes.
[image:12.595.205.538.656.737.2]In summary, the ISBSG data fields with information related to software quali-ty have been identified which gives that 39 questions are related to software quality within the COSMIC sizing method questionnaire (Release 12 - 2013). The detailed mappings between the six sigma methodologies of DMAIC and DFSS (IDDOV) and the ISBSG data questionnaire have been conducted: it highlights
Table 5. Defect data fields in the ISBSG data extract [26].
Quality Fields Description
Minor defects delivered Number of minor defects reported Major defects delivered Number of major defects reported Extreme defects delivered Number of extreme defects reported
that DMAIC comes after the design stage at the process life cycle, whereas, DFSS comes early; it also shows that DMAIC aligns with software enhancement of software project type, and DFSS aligns with software new development and re-development of software project type.
5. Application Analysis for the Proposed Approach to ISBSG
5.1. Analysis of the Quality-Related Data Fields in the ISBSG
MS-Excel Data Extract (Release 12 - 2013)
This section presents the data extraction of the ISBSG MS-Excel to be used in the
next research phases. As recommended by [18] and [28] two verification steps
have to be carried out before using the data set for analysis: data quality verifica-tion and data completeness verificaverifica-tion.
5.1.1. First Level of Data Preparation
The first step of data quality verification is carried out by the ISBSG repository manager, who analyzes the data collected from the questionnaires and then rates
the project data collected [17]. This rating information is recorded in a data
field: the Data Quality Rating (DQR) with the following admissible values [17]:
- “A: the data submitted was assessed as being sound with nothing being
iden-tified that might affect its integrity.
- B: the submission appears fundamentally sound but there are some factors
which could affect the integrity of the submitted data.
- C: due to significant data not being provided, it was not possible to assess the
integrity of the submitted data.
- D: due to one factor or a combination of factors, little credibility should be
given to the submitted data”.
It is advisable for analysis purposes to consider only those projects having a
DQR equal to A or B (e.g. the data collected have a high degree of integrity) [28].
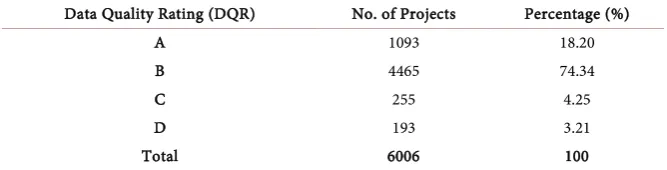
The number of projects, with their corresponding data quality rating, is
pre-sented in Table 6 for ISBSG Release 12. The 448 projects with a C or D quality
rating were dropped for our empirical analyses in the subsequent research phas-es: this left 5558 projects with an A or B data quality rating.
5.1.2. Second Level of Data Preparation
[image:13.595.206.540.650.735.2]A second step is required in the data preparation. The quality-related data fields are not mandatory in the ISBSG repository and many software projects do not have data about defects.
Table 6. Project Data Quality Rating (DQR).
Data Quality Rating (DQR) No. of Projects Percentage (%)
A 1093 18.20
B 4465 74.34
C 255 4.25
D 193 3.21
We applied next a further data filtering and analysis to select only projects sized with the COSMIC sizing method and which have data in the field of “Total number of defects”: this left 393 COSMIC-sized software projects with a data quality rating A and B.
Table 7 presents the number COSMIC-sized of projects with, or without, in-formation about defects for a period of one month after of the software’s
opera-tion, and categorized within [13] as: Minor Defects, Major Defects, and Extreme
Defects, and Total Number of Defects.
The columns in Table 7 are on the number of projects with defect severity
type’s information correspond to:
- Blank data fields: represents the number of projects without any information.
- Non-Blank data fields: represents the number of projects with defect
num-bers.
- Zero Defect data fields: represents the number of projects with zero defects
reported.
- Max Defect data fields: represents the maximum number of defects registered
in the MS-Excel data extract for a defect severity type.
In particular, from Table 7:
- Blank or no recorded “total number of defects” = 311 software projects,
- With a “total number of defects” = 79 software projects.
A zero value in the total number of defect field (e.g. total defects = 0) = 33 software projects. This might be real information, but the zero value might also be caused by poor data entry, and some organizations might have entered a zero value instead of leaving the field blank for a missing value. To be on the safe side for this analysis, these 33 projects are dropped from further analysis. This leaves 360 projects available for further quality-related analysis, where:
- 49 projects have data for “Total Number of Defects” (projects 1 to 49) and
- 311 projects have missing data (projects 50 and over).
Figure 4 shows the distribution of the software sizes of the data set of N = 360 COSMIC-sized software projects, with a software size ranging from 2 to 2090 CFP (COSMIC Function Points), with most values at the low end. The median is 133 CFP.
5.2. Analysis of Software Projects of ISBSG Dataset
N
= 360
Projects
5.2.1. Software Projects’ Development Type Analysis Results
Figure 5 and Figure 6 present next the number of software projects by type and their percentage, where:
• Enhancement projects = 149 projects, which represents 41% of projects
[image:14.595.204.540.703.734.2]number,
Table 7. Number of projects (DQR = A and B) by defect severity type.
Quality Blanks Non-Blanks Zero Defect Max Defect Total
Figure 4. Distribution of the COSMIC functional size of data set N = 360 projects.
Figure 5. Number of software projects by type N = 360 projects.
Figure 6. Number of software projects by type and their percentage N = 360 projects.
• Re-development projects = 11 projects, which represents 3% of projects
[image:15.595.157.539.472.672.2]• New software development projects = 200 projects, which represents the
highest percentage of 56% of projects.
From the software projects’ type distribution, it can be noted that software organizations have submitted more data on development of new processes or products (200 projects) than on the re-design of existing ones (11 projects). Therefore, this indicates that DFSS projects could be used for creating new processes or products (in order to prevent defects at early stages of software life cycle) more than seeking to re-design existing ones.
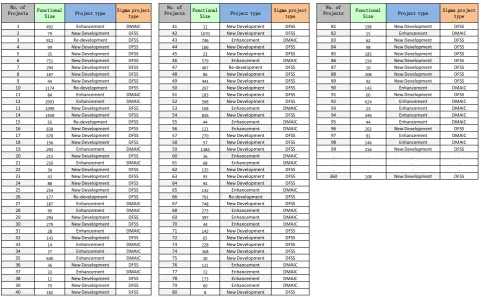
Based on Appendix B and Appendix C, Figure 7 presents an example of
sample results for software projects of ISBSG data set N = 360 with regards to
software projects’ development type and Sigma projects’ type with their COSMIC functional size.
5.2.2. Six Sigma Projects’ Type Analysis
Figure 8 and Figure 9 present the number of Sigma projects by type and their percentage, where the number of the DMAIC projects is 149 projects, which represents 41.4% of projects number, and the number of DFSS projects is 211 projects, which represents the highest percentage of 58.6%.
[image:16.595.58.540.406.703.2]Figure 10 shows the software sizes of DMAIC projects, with a range from 2 to 2003 CFP, with most values at the low end. The median size is 95 CFP.
Figure 11 shows the software sizes of DFSS projects, with a range from 8 to 2090 CFP, with most values at the low end. The median size is 175 CFP.
Figure 7. An example of sample results for software projects of ISBSG data set N = 360 with regards to software projects’
devel-opment type, sigma projects’ type. No. of
Projects Functional Size Project type Sigma project type No. of
Projects Functional Size Project type Sigma project type
No. of
Projects Functional Size Project type Sigma project type
1 492 Enhancement DMAIC 41 11 New Development DFSS 81 198 New Development DFSS
2 79 New Development DFSS 42 1670 New Development DFSS 82 15 Enhancement DMAIC
3 912 Re-development DFSS 43 746 Enhancement DMAIC 83 62 New Development DFSS
4 99 New Development DFSS 44 186 New Development DFSS 84 98 New Development DFSS
5 35 New Development DFSS 45 23 New Development DFSS 85 185 New Development DFSS
6 751 New Development DFSS 46 579 Enhancement DMAIC 86 154 New Development DFSS
7 294 New Development DFSS 47 467 Re-development DFSS 87 10 New Development DFSS
8 187 New Development DFSS 48 86 New Development DFSS 88 208 New Development DFSS
9 44 New Development DFSS 49 441 New Development DFSS 89 92 New Development DFSS
10 1174 Re-development DFSS 50 297 New Development DFSS 90 143 Enhancement DMAIC
11 84 Enhancement DMAIC 51 183 New Development DFSS 91 60 New Development DFSS
12 2003 Enhancement DMAIC 52 568 New Development DFSS 92 624 Enhancement DMAIC
13 1099 New Development DFSS 53 108 Enhancement DMAIC 93 23 Enhancement DMAIC
14 1958 New Development DFSS 54 826 New Development DFSS 94 346 Enhancement DMAIC
15 55 Re-development DFSS 55 44 Enhancement DMAIC 95 44 Enhancement DMAIC
16 838 New Development DFSS 56 121 Enhancement DMAIC 96 202 New Development DFSS
17 678 New Development DFSS 57 270 New Development DFSS 97 81 Enhancement DMAIC
18 156 New Development DFSS 58 57 New Development DFSS 98 146 Enhancement DMAIC
19 293 Enhancement DMAIC 59 1384 New Development DFSS 99 216 New Development DFSS
20 215 New Development DFSS 60 36 Enhancement DMAIC . . . .
21 250 Enhancement DMAIC 61 68 Enhancement DMAIC . . . .
22 34 New Development DFSS 62 135 New Development DFSS . . . .
23 43 New Development DFSS 63 93 New Development DFSS 360 108 New Development DFSS
24 88 New Development DFSS 64 94 New Development DFSS
25 254 New Development DFSS 65 142 Enhancement DMAIC
26 177 Re-development DFSS 66 791 Re-development DFSS
27 187 Enhancement DMAIC 67 748 New Development DFSS
28 90 Enhancement DMAIC 68 273 Enhancement DMAIC
29 294 New Development DFSS 69 397 Enhancement DMAIC
30 279 New Development DFSS 70 44 Enhancement DMAIC
31 28 Enhancement DMAIC 71 142 New Development DFSS
32 143 New Development DFSS 72 65 New Development DFSS
33 14 Enhancement DMAIC 73 228 New Development DFSS
34 37 Enhancement DMAIC 74 368 New Development DFSS
35 640 Enhancement DMAIC 75 30 New Development DFSS
36 36 New Development DFSS 76 121 Enhancement DMAIC
37 33 Enhancement DMAIC 77 72 Enhancement DMAIC
38 12 New Development DFSS 78 173 Enhancement DMAIC
39 70 New Development DFSS 79 60 Enhancement DMAIC
Figure 8. Number of sigma projects by type—N = 360.
Figure 9. Number of sigma projects by type and their percentage—N = 360.
Figure 10. CFP software sizes of DMAIC projects—N = 149.
The modeling through a linear regression of the relationship of the dependent variable “Total Number of Defects” (TD) based on an independent variable “Functional Size” in Function Points is used on the imputed dataset to obtain the TD estimates and standard errors (build TD estimation models).
[image:17.595.209.537.459.625.2]- Estimate TD (dependent variable) based on Functional Size (independent
va-riable).
- Analysis of TD with R2 and P-value of the estimation results of TD using CFP
as the dependent variable.
- Analyze the values of Defect Density (DD) for each software project within
the dataset of N software projects based on the formula of the Defect Density which measures the quality of software in terms of defects delivered in unit size of software. It is expressed as Defects per Function Points (Defect/CFP). The following criteria for analyzing the results of TD estimation models:
- Coefficient of determination (R2): the coefficient has a value between 0 and 1.
- Standard Errors (STD-E);
- P-value: Statistical Significance;
- T-test: Statistical Significance.
Given the complete data N = 49 projects, the TD estimation model (based on
the independent variable “Functional size”) is built with both the complete data
[image:18.595.207.541.468.633.2]set N = 49 projects—see Table 8.
Table 8, displays a 95% mean confidence interval and a T-test with the
asso-ciated P-value and whether the independent variable “Functional size” has
im-pact on the TD parameter estimates (of complete observations, N = 49 projects):
the inferences are based on the t-distribution, and followed by a graphical re-presentation of “Total Number of Defects” based on “Functional Size”—see
Figure 12.
Table 8 presents the results of the TD estimation model (to be used for gene-rating predicted values as “imputes” for the missing TD) for the variable “Total Number of Defects” trained with the independent variables “Functional Size” for the imputation and based on the reported total defects of 49 projects.
Figure 11. CFP software sizes of DFSS projects—N = 211.
Table 8. Regression parameter analysis and statistical tests for TD estimation model
based on the completed dataset—N = 49.
Variable Intercept Coefficients R2 95% Confidence Limits T-test Standard Error P-value
Table 8 also shows the parameter estimates for the “Total Number of Defects” estimation model are: (constant = 1.63 defects and 0.017 defects/CFP).
There-fore, the Total Defect estimation model based on the complete dataset N = 49
projects is:
(
)
(
)
(
)
Total Number of Defects=1.63 defects +0.017 defects CEP ∗Functional Size CFP
It also can be observed from Table 6 that the T-test and the P-value are
statis-tically significant. Table 6 also shows the coefficients of determination (R2)
[image:19.595.159.542.303.484.2]which is (0.5) for the TD estimation model (based on “Functional Size”) that to be used for the imputation procedure. The confidence interval is (Lower Limit is 0.0113, and Upper Limit is 0.0225).
Figure 13 shows the distribution of the total defects based on complete
data-set of N = 49 software projects sized by COSMIC method, with a range from 1
[image:19.595.157.541.531.717.2]defect to 63 defects, where 80% of values are less than or equal to 10 defects. The average is 10 defects.
Figure 12. Normal probability plot of total defects and functional size based on the complete
data-set—N = 49.
Figure 14 shows the distribution of the software sizes based on complete
da-taset of N = 49 software projects sized by COSMIC method, with a software size
ranges from 11 CFP to 2003 CFP (COSMIC Function Points), with most values at the low end. The median is 186 CFP.
Figure 15 shows the distribution of the defect density based on complete
da-taset of N = 49 software projects, with a range from 0.0012 Defects/CFP to
0.2093 Defects/CFP, The median is 0.0269 Defects/CFP.
Figure 16 shows the Sigma values for complete dataset N = 49 software projects, with a range from 2.31 Sigma to 4.54 Sigma, and the average is 3.49 Sigma.
Software projects with ranging of Sigma values (e.g., from 3 Sigma to 4.5 Sig-ma) can be then used for building defect estimation models in terms of the in-dependent variable “Functional Size”: where higher levels of Sigma correspond to fewer defects, this implies higher levels of customer satisfaction.
6. Conclusions and Future Work
[image:20.595.156.541.330.516.2]The study reported here has investigated the extent to which the ISBSG repository
[image:20.595.207.539.548.715.2]Figure 14. CFP software sizes of complete dataset, N = 49 projects.
Figure 16. Sigma values of the complete dataset—N = 49.
can be used in terms of some of the related Six Sigma measurement aspects such as Sigma defect measurement in the context of software defect estimation pur-poses. This study presented the quality-related information in the ISBSG ques-tionnaire, and conducted mapping of the ISBSG questionnaire to the related measurement steps in Six Sigma (DMAIC and DFSS) methodologies. It pre-sented the data set preparation consisting of two levels of data preparations
based on [18], and then analyzed the quality-related data fields in the ISBSG
MS-Excel data extract (Release 12 - 2013). It also presented an analysis of the ex-tracted dataset of software projects.
This study has found that the ISBSG MS-Excel data extract (Release 12 - 2013) has a high ratio of missing data within the data fields of “Total Number of De-fects” variable, which represents a serious challenge when the ISBSG dataset is being used for software defect estimation. Thus, the missing data problem was tackled using imputation technique in order to have complete datasets that could be useful for building defect estimation models. This study has also found that using the Sigma defect measurement aspects, such as the Sigma levels, which can be useful to improve designing software defect estimation models.
This study has found that:
- The parameter estimates for the “Total Number of Defects” estimation model
using the complete dataset N = 49 projects correspond to the following Total
Defect estimation model:
(
)
(
)
Total Number of Defects=1.63 Defects+0.017 Defects CEP ∗Functional Size CFP
- The distribution of the total defects from the complete dataset of N = 49
software projects had a range from 1 defect to 63 defects, where 80% of val-ues were less than or equal to 10 defects. The average was 10 defects.
- The distribution of the software sizes from the complete dataset of N = 49
software projects had a range from 11 CFP to 2003 CFP (COSMIC Function Points). The median was 186 CFP.
- The distribution of the defect density based on complete dataset of N = 49
- The Sigma values for complete dataset N = 49 software projects, had a range
from 2.31 Sigma to 4.54 Sigma, and the average was 3.49 Sigma.
- Software projects with a range of Sigma values (e.g., from 3 Sigma to 4.5
Sigma) can be then used for building defect estimation models in terms of the independent variable “Functional Size”: whereas, higher levels of Sigma correspond to fewer defects, this implies higher levels of customer satisfac-tion.
Furthermore, this study can be very useful to the industry, researchers and practitioners in:
1) Analyzing the availability of the quality-related information in the ISBSG repository.
2) Preparing for detailed studies through requesting specific quality-related data fields form the ISBSG organization.
3) Improving the ISBSG repository in terms of the software quality-related data collections.
4) Investigating the usefulness of Sigma measurement-related aspects along with software defect estimation using the ISBSG repository. However, more stu-dies are needed in order to clarify the use of such measurement aspects using the available software data repositories.
References
[1] Tonini, A.C., Spinola, M.D.M. and Laurindo, F.J.B. (2006) Six Sigma and Software Development Process: Dmaic Improvements. Technology Management for the
Global Future, 6, 2815-2823. https://doi.org/10.1109/picmet.2006.296875
[2] Nanda, V. and Robinson, J. (2011) Six Sigma Software Quality Improvement. McGraw-Hill Education, New York.
[3] Wang, H. (2008) A Review of Six Sigma Approach: Methodology, Implementation and Future Research. Wireless Communications, Networking and Mobile Compu-ting,Volume 1-4.https://doi.org/10.1109/wicom.2008.1887
[4] Feng, Q. (2008) Six Sigma: Continuous Improvement toward Excellence, in Colla-borative Engineering. Springer, New York, 43-60.
https://doi.org/10.1007/978-0-387-47321-5_3
[5] Antony, J. and Fergusson, C. (2004) Six Sigma in the Software Industry: Results from a Pilot Study. Managerial Auditing Journal, 19, 1025-1032.
https://doi.org/10.1108/02686900410557926
[6] Teng, S.J. (2008) The Pros and Cons of Six Sigma Quality Management.
Proceed-ings of International Conference on Advanced Information Technologies, Hanoi,
6-9 October 2008, 1-10.
[7] Al-Qutaish, R.E. and Al-Sarayreh, K.T. (2008) Applying Six-Sigma Concepts to the Software Engineering: Myths and Facts. Proceedings of the 7th International
Con-ference on Software Engineering Parallel and Distributed Systems, Cambridge, 20-
22 February 2008, 178-183.
[8] Hong, G. and Goh, T. (2003) Six Sigma in Software Quality. The TQM Magazine, 15, 364-373. https://doi.org/10.1108/09544780310502697
Conference,4-7 December 2007,446-453. https://doi.org/10.1109/aspec.2007.43
[10] Motorola (2011) Free Six Sigma Lessons.
http://web.archive.org/web/20051107013618/http://www.motorola.com/content/0,, 3069-5787,00.html#
[11] Murugappan, M. and Keeni, G. (2000) Quality Improvement-The Six Sigma Way.
Quality Software 2000 Proceedings of First Asia-Pacific Conference on IEEE, Hong
Kong, 30-31 October 2000, 248-257. https://doi.org/10.1109/apaq.2000.883798
[12] Mahanti, R. and Antony, J. (2009) Six Sigma in the Indian Software Industry: Some Observations and Results from a Pilot Survey. The TQM Journal, 21, 549-564.
https://doi.org/10.1108/17542730910995837
[13] International Software Benchmarking Standards Group (2013) ISBSG Development and Enhancement Repository R12. International Software Benchmarking Standards Group, Australia.
[14] Cukic, B. (2005) Guest Editor’s Introduction: The Promise of Public Software Engi-neering Data Repositories. IEEE Software, 22, 20-22.
https://doi.org/10.1109/MS.2005.153
[15] Menzies, T. (2008) Improving IV&V Techniques through the Analysis of Project Anomalies: LINKER-Preliminary Report. Agricultural & Biological Chemistry, Vo-lume 1-13, 11.
[16] Cheikhi, L. and Abran, A. (2013) Promise and ISBSG Software Engineering Data Repositories: A Survey. Joint Conference of the International Workshop on
Soft-ware Measurement, 10, 17-24. https://doi.org/10.1109/iwsm-mensura.2013.13
[17] Cheikhi, L. (2008) Études Empiriques des Relations entre les Modèles de Qualité Du Logiciel D'iso 9126 en Utilisant le Référentiel de Données D'isbsg et la Méthode Taguchi. École de Technologie Supérieure, Montreal.
[18] Déry, D. and Abran, A. (2005) Investigation of the Effort Data Consistency in the ISBSG Repository. École de Technologie Supérieure, Montreal.
[19] Motorola (2011) What Is Six Sigma?
http://www.intrarts.com/Motorola/index.shtml
[20] Kwak, Y.H. and Anbari, F.T. (2006) Benefits, Obstacles, and Future of Six Sigma Approach.Technovation, 26, 708-715.
https://doi.org/10.1016/j.technovation.2004.10.003
[21] Heckl, D., Moormann, J. and Rosemann, M. (2010) Uptake and Success Factors of Six Sigma in the Financial Services Industry.Business Process Management Journal, 16, 436-472. https://doi.org/10.1108/14637151011049449
[22] Tennant, G. (2001) Six Sigma: SPC and TQM in Manufacturing and Services. Gow-er Publishing, Farnham.
[23] Isixsigma (2014) 1.5 Sigma Process Shift.
https://www.isixsigma.com/new-to-six-sigma/dmaic/15-sigma-process-shift/
[24] Tayntor, C.B. (2007) Six Sigma Software Development. CRC Press, Boca Raton.
https://doi.org/10.1201/9781420044287
[25] Shaout, D.A. and El-Haik, D.B. (2008) Software Design for Six Sigma: A Roadmap for Excellence. John Wiley Press, Hoboken.
[26] Cheikhi, L., Abran, A. and Buglione, L. (2006) ISBSG Software Project Repository & ISO 9126: An Opportunity for Quality Benchmarking. European Journal for the In-formatics Professional, 7, 46-52.
Measuring Software. The COSMIC Measurement Practices Committee.
Appendix A:
ISBSG Data Fields with Information Related to
Software Quality
Category Phases Collected Data ISBSG Questionnaire
Project process infrastructure Process
Type of software project (Question: 5) The project consists of software that is reusable (Question: 7) Process improvement program (Question: 13)
Planning
Rank project objectives (Question: 15) Initial measure of the project’s functional size made in project planning (Question: 17) Estimate of total project effort made in project planning (Question: 18) Estimated project completion date set in project planning (Question: 19) Estimate of total project cost made in project planning (Question: 20) Size of any preliminary functional model created during project planning (Question: 21) Duration of project planning (Question: 22)
Specification
Size of any functional model created during the specification activity (Question: 25) Number of defects recorded in the documents and other work products of this phase (Question: 27) Functional size measured after the specification activity (Question: 28) Duration of the specification activity (Question: 29)
Design
Number of defects recorded during the design phase (Question: 32) Number of changes raised during design (Question: 33) Functional size measured after completion of design (Question: 34) Duration of the design activity (Question: 35)
Build or programming
Type of what produced or modified during the build activity (Question: 36) Number of defects recorded and resolved during the build activity (Question: 38) Number of changes raised during build (Question: 39) Duration of the design activity (Question: 40)
Test
Number of defects recorded during the test activity (Question: 43) Number of changes raised during testing (Question: 44) Duration of the design activity (Question: 45)
Implementation
Number of distinct versions of the software delivered to the customer or end user
during the projects (Question: 47) Number of defects recorded during the implementation activity (Question: 49) Number of changes raised during implementation (Question: 50) Functional size measured after completion specification activity (Question: 51) Duration of the implementation activity (Question: 52)
Product information General Project made (or not) reuse of previous software development work (Question: 93) Estimate amount of functionality provided by reused work products (Question: 94)
Project
completion information General
Factors that have a negative impact on the project performance or outcomes (Question: 129) Number of defects recorded during the first month of the software’s operation (Question: 130)
The lines of code generated by this project
The percentage of these lines of code that are not program statement (Question: 131)
User satisfaction survey
Did the project meet the stated objectives? Did the software meet business requirements?
Quality expectation for the software? Quality expectation for user documentation?
Ease of use requirements for the software? Was sufficient training or explanation given?
Schedule for planning and specification? Schedule for design, build, test, and implement?
Continued
Project cost Customer/End-user costs for each activity/total Development team costs for each activity/total
IT operation costs for each activity/total (Question: 135)
Appendix B: Mapping ISBSG Questionnaire Sections to Six
Sigma
Category Sub-sections Six Sigma DMAIC DFSS IDDOV
Project process
Process infrastructure X X
Planning X X
Specification X
Design X
Build or Programming X X
Test X X
Implementation/ installation X X
Project management and monitoring Technology General Information
People and work effort
Development Team Customers and End Users
IT Operations Work Effort validation
Product General Information
COSMIC project functional size
New development or redevelopment software size X
Enhancement software size X
Context of the functional size measurement Experience of the functional counter
Project completion
General information X
User satisfaction survey Project costs Cost Validation
Appendix C: Detailed Six Sigma Views in in the ISBSG Data
Collection Questionnaire
Category Phases Collected Data Questionnaire ISBSG Six Sigma DMAIC IDDOV DFSS
Project
process Process infrastructure
Type of software project (Question: 5) X X The project consists of software that is reusable (Question: 7)
Process improvement program (Question: 13) X X
Planning
Rank project objectives (Question: 15) X X Initial measure of the project’s functional size made in
project planning (Question: 17) X Estimate of total project effort made in project
planning (Question: 18) Estimated project completion date set in project
Continued
Estimate of total project cost made in project planning (Question: 20) Size of any preliminary functional model created
during project planning (Question: 21) X Duration of project planning (Question: 22)
Specification
Size of any functional model created during the
specification activity (Question: 25) X Number of defects recorded in the documents and other
work products of this phase (Question: 27) X Functional size measured after the specification
activity (Question: 28) X
Duration of the specification activity (Question: 29)
Design
Number of defects recorded during the design phase (Question: 32) X Number of changes raised during design (Question: 33) X Functional size measured after completion of design (Question: 34) X
Duration of the design activity (Question: 35)
Build or programming
Type of what produced or modified during the build
activity (Question: 36) Number of defects recorded and resolved during the
build activity (Question: 38) X X Number of changes raised during build (Question: 39) X X
Duration of the design activity (Question: 40)
Test
Number of defects recorded during the test activity (Question: 43) X X Number of changes raised during testing (Question: 44) X X
Duration of the design activity (Question: 45)
Implementation
Number of distinct versions of the software delivered to
the customer or end user during the projects (Question: 47) Number of defects recorded during the
implementation activity (Question: 49) X Number of changes raised during implementation (Question: 50) X
Functional size measured after completion
specification activity (Question: 51) X Duration of the implementation activity (Question: 52)
Product General information
Project made (or not) reuse of previous software
development work (Question: 93) Estimate amount of functionality provided by reused
work products (Question: 94)
COSMIC Project Functional Size
New Development or Re-development Software
Size
COSMIC functional sizing standard (Question: 95) Approach used to determine the project functional size (Question: 96) Measurement view point of the count (Question: 97) Major components of an application or of
infrastructure software (Question: 98) X
Size software (Question: 99) X
Enhancement Software Size
Continued
Functional size of the software before the
enhancement project (Question: 104) X Major components of an application or of infrastructure
software (Question: 105) X Added functionality-size software (Question: 106) X Changed functionality-size software (Question: 107) X Deleted functionality-software (Question: 108) X Software size in COSMIC function points (Question: 109) X
Project
completion General information
Total duration of the project (Question: 126) Total inactivity time on the project (Question: 127) Factors that have a positive impact on the project
performance or outcomes (Question: 128) X X Factors that have a negative impact on the project
performance or outcomes (Question: 129) X X Number of defects recorded during the first month of the
software’s operation (Question: 130) X The lines of code generated by this project
The percentage of these lines of code that are not
program statement (Question: 131)
User satisfaction survey
Did the project meet the stated objectives? Did the software meet business requirement?
Quality expectation for the software? Quality expectation for user documentation?
Ease of use requirements for the software? Was sufficient training or explanation given?
Schedule for planning and specification? Schedule for design, build, test, and implement?
(Question: 132)
Project cost Customer/End-user costs for each activity/total Development team costs for each activity/total
IT operation costs for each activity/total (Question: 135)
Submit or recommend next manuscript to SCIRP and we will provide best service for you:
Accepting pre-submission inquiries through Email, Facebook, LinkedIn, Twitter, etc. A wide selection of journals (inclusive of 9 subjects, more than 200 journals)
Providing 24-hour high-quality service User-friendly online submission system Fair and swift peer-review system
Efficient typesetting and proofreading procedure
Display of the result of downloads and visits, as well as the number of cited articles Maximum dissemination of your research work
Submit your manuscript at: http://papersubmission.scirp.org/
![Figure 1. How six sigma measures quality [21].](https://thumb-us.123doks.com/thumbv2/123dok_us/7742911.708280/5.595.83.543.71.320/figure-sigma-measures-quality.webp)
![Table 2. IDDOV process [24].](https://thumb-us.123doks.com/thumbv2/123dok_us/7742911.708280/6.595.169.537.414.751/table-iddov-process.webp)
![Table 3. Differences between six sigma DMAIC and DFSS [24].](https://thumb-us.123doks.com/thumbv2/123dok_us/7742911.708280/7.595.207.538.90.193/table-differences-sigma-dmaic-dfss.webp)
![Figure 2. Management of the ISBSG repository [17].](https://thumb-us.123doks.com/thumbv2/123dok_us/7742911.708280/8.595.121.537.70.283/figure-management-isbsg-repository.webp)

![Table 5. Defect data fields in the ISBSG data extract [26].](https://thumb-us.123doks.com/thumbv2/123dok_us/7742911.708280/12.595.205.538.656.737/table-defect-data-fields-isbsg-data-extract.webp)