The impact of the stream
fl
ow hydrograph on sediment supply from
terrace erosion
John Lee Higson
a, Michael Bliss Singer
a,b,⁎
aDepartment of Earth and Environmental Sciences, University of St Andrews, United Kingdom bEarth Research Institute, University of California Santa Barbara, United States of America
a b s t r a c t
a r t i c l e i n f o
Article history:
Received 22 January 2015
Received in revised form 22 July 2015 Accepted 24 July 2015
Available online 29 July 2015
Keywords:
Bank stability Hyporheic Legacy sediment Yuba River Gold Rush
Mercury contamination
Sediment supply from banks and terraces has important implications for grain-size distributions in alluvial rivers (and by extension for aquatic habitat), as well as for the delivery offloodplain-stored nutrients and contaminants to the aquatic environment. The interactions between streamflow hydrographs and lateral channel boundary failure control the sediment supply from banks and terraces. However, the relationships between variable flow and discrete sediment supply from catastrophic erosion of lateral boundaries and subsequent mass sedi-mentflux in rivers are not well characterised by existing methods and models that focus only on one of several relevant interrelated processes. In order to improve predictive capability of catastrophic sediment supply from lateral boundaries, we adopt a new approach to modelling the process interactions between stream hydrology, erosion of banks/terraces, and the corresponding discrete supply of sediment to channels. We develop a model-ling framework for terrace—channel coupling that combines existing theories offlow through porous media, bank stability, and fractional sedimentflux. We demonstrate the utility of this modelling approach by assessing hydrologically driven erosion, evolution of grain size in the channel, andfine sedimentflux from a study site along the Yuba River in California over individualflood hydrographs and over decadal historicalflow series. We quantify the supply of sediment eroded from a contaminated nineteenth century fan terrace of hydraulic gold mining tailings intersecting the Yuba, andfind that a threshold for erosion exists at a stage in the channel in excess of 8 m producing episodic sediment concentrations in excess of ~300 mg L−1. The modelling produced erosion andfine sediment pulses from each of three majorfloods in the past several decades until theflow drops below 500 m3s−1and a bed armor layer forms, while no sediment was generated from the terrace during small-erfloods. We further assess the impact on terrace erosion of various river management scenarios with distinct hydrograph shapes andfind increased erosion potential when the terrace contains antecedent moisture or the flood time series is run over an extended duration. Sensitivity analysis demonstrated that elevated antecedent moisture within the lateral boundary and increased hydrograph rising time each reduce bank stability and thus increase volumes of failed material. We also show thatfluctuations in the hydrograph, typically associated with hydroelectricity generation, result in a more stable terrace than those of a longer duration because there is less time for hyporheic stream water to infiltrate the lateral boundary. This study demonstrates that changes in hydrograph shape as a consequence of climatic forcing or anthropogenic dam releases may have considerable impacts upon sediment delivery and associated contaminants from banks and terraces to the downstream environment.
© 2015 The Authors. Published by Elsevier B.V. This is an open access article under the CC BY license (http://creativecommons.org/licenses/by/4.0/).
1. Introduction
The erosion of banks and terraces supplies sediment to channels and thus has important implications for grain-size distributions and mor-phology in alluvial rivers and by extension for aquatic habitat, as well as for the delivery offloodplain-stored nutrients and contaminants to the aquatic environment. Once sediment enters the channel from
banks and terraces, a proportion of it is transported by competent flows, while the remainder becomes incorporated into the channel bed material, where it may affect channel capacity and thusflood risk (Slater et al., 2015). Thus, the problem of sediment supply to channels has important implications for the partitioning of fractional longitudinal sedimentflux, the evolution of channel grain-size distributions (GSDs), and stream habitat and for morphological development along river reaches and over temporal periods ranging from multiple storms to millennia. Sediment supplied from lateral boundaries may comprise a large proportion of the total sediment load to rivers (Odgaard, 1987; Simon and Darby, 2002). In the relatively low energy systems of the
⁎ Corresponding author at: Earth Research Institute, University of California Santa Barbara, United States of America.
E-mail addresses:john.higson@ed.ac.uk(J.L. Higson),bliss@eri.ucsb.edu(M.B. Singer).
http://dx.doi.org/10.1016/j.geomorph.2015.07.037
0169-555X/© 2015 The Authors. Published by Elsevier B.V. This is an open access article under the CC BY license (http://creativecommons.org/licenses/by/4.0/).
Contents lists available atScienceDirect
Geomorphology
UK,Walling et al. (1999)showed that in the long-term up to 37% of the suspended sediment yield originated from lateral boundary erosion. In addition, sediment budget research on the Amazon River has demon-strated contributions of bank erosion that are 1.3 times larger than the total sedimentflux at the river mouth (Óbidos) (Dunne et al., 1998). Contribution of sediment from lateral boundaries during highflow stage should be particularly large influvial systems with unconsolidated high banks or terraces along the channel margins (e.g.,Singer et al., 2013) and in basins where rainstorms produce majorfloods substan-tially larger than meanflows.
Localised sediment supply to channels from bank and terrace ero-sion (hereafter calledlateral boundary erosion) is a key source of sedi-ment to lowland channel systems, in which tributaries may play a more limited role in terms of their influence on channel sediment dy-namics (Rice, 1998) within lowland valleyfloors (Singer and Dunne, 2001; Singer, 2008a,b; Singer, 2010). Lateral boundary erosion may be generated by mass wasting of banks and terraces as a result of failure in-duced by pore pressures once the bank toe has been removed (Simon et al., 2000). This has been observed followingfloods as extensive failed bank material along channel margins near riverbanks. We have docu-mented many such failures within the Sacramento Valley of California, suggesting that lateral boundary failure did not occur during the rise to peak of theflood (otherwise bank material would have been carried away), but at the peak or on the falling limb of the hydrograph as a cat-astrophic mass wasting process in response tofloodplain water table fluctuations (Rinaldi et al., 2004; Luppi et al., 2009). The implication is that differences in hydrograph shape (whether caused by climate change or anthropogenic modification of hydrology) have the potential to affect erosion of channel boundaries and therefore impact the supply of sediment to the channel from these sources. Thus, streamflow may be the primary driver of lateral boundary erosion through its influence on near-bank stresses and their support of lateral hyporheic water tables that rise and fall within stream banks.
Failure induced by pore pressures in lateral boundaries has not typ-ically been considered to be the dominant mechanism affecting the sup-ply of sediment from banks and terraces and manyfloodplain-channel morphology modelling efforts have subsumed the relevant erosion pro-cesses into lateral boundary erodibility based on characterisations of the flowfield (e.g.,Johannesson and Parker, 1989; Lauer and Parker, 2008). Such models typically explore the velocityfield interacting within the geometry of river bends to identify loci and rates of lateral erosion. However, several other recent research efforts have placed great em-phasis on links between boundary water status, bank stability, bound-ary failure, and in-channel sediment transport (Amiri-Tokaldany et al., 2003, 2007; Rinaldi et al., 2004, 2008). Various reviews of research on the mechanisms of river width adjustment and approaches to its model-ing were undertaken in previous decades (Thorne, 1982; ASCE, 1998a, b), so we will not endeavour to repeat this summary here. What is im-portant here is that it is challenging to systematically predict lateral boundary erosion and its contribution to sediment loads over short timescales (individual or sequences of storms) because bank/terrace erosion occurs catastrophically along channel margins during or follow-ingfloods. Lateral boundaries are subjected to infiltrating rain into floodplain materials and, more significantly, hyporheic water tables as a function of rising river stage that affect material stability. As water content in lateral boundaries increases, frictional resistance between grains is reduced and the entire deposit becomes more prone to failure (Osman and Thorne, 1988; Casagli et al., 1999).
The processes by which water content in lateral channel boundaries affects timing and volumes of bank/terrace failure are the subject of ex-tensive research applying the theory of infinite slope stability (Terzaghi, 1942; Selby, 1993) to riverbanks (Simon et al., 1991; Darby and Thorne, 1996). The infinite slope stability method produces a factor of safety based on linear (Mohr–Coulomb) relationships between shear strength and the normal stress on the failure surface, which take into account material properties, slope geometry, and water content in the matrix.
Later implementations have considered the local hydrology explicitly, including confining pressure of river stage, infiltration, and the hydro-logic role of vegetation (Simon and Collison, 2001; Darby et al., 2007). Coupled with a groundwater model that computes water table rise and fall within the bank/terrace, these components provide a good framework for predicting lateral boundary failure in response to hydro-logic changes in the near-channel zone. These components can then be coupled to characterisations of the fate of the failed lateral boundary material (Amiri-Tokaldany et al., 2007). An important open question is how variations in the drivingflow (discharge hydrographs) interact with river banks/terraces over various timescales from individualfloods to decades. If developed, this understanding could be used to better as-sess the impact of hydrology on sediment supply from lateral channel boundary erosion.
Evidence is increasing that hydrologic variability has important im-plications for channel bed material transport and sorting (Hassan et al., 2006; Humphries et al., 2012; Mao, 2012; Alvarez and Schmeeckle, 2013; Singer et al., 2013; Singer and Michaelides, 2014). Similarly, the shape of the discharge hydrograph and antecedent mois-ture conditions within lateral channel boundaries are likely to impact failure probabilities for particular bank materials, with implications for the fate and transport of sediment once failure of banks occurs (Rinaldi et al., 2004; Luppi et al., 2009). In the case offine-grainedfl ood-plain materials, a significant proportion of the failed sediment would likely become part of the river's washload (nonsettling component of suspended load) and thus be transported through the reach and depos-ited on downstreamfloodplains (Kilham et al., 2012). Legacy terraces from past climatic forcing and/or anthropogenic activities (Bull, 1997; Singer et al., 2013) are typically composed of noncohesive materials and are thus more prone to failure than relatively cohesive riverbanks constructed by modern lowland rivers carrying higher percentages of silt and clay. These lateral boundary units often contain a wide mix of grain sizes that interact with the riverbed in various ways. While some of the failed sediment certainly contributes tofine-grained suspended loads (Carson et al., 1973; Bull, 1997), relatively coarse sed-iment typically becomes incorporated into the bed. Therefore, a partitioning of sediment loads occurs upon failure, such that the bed in-herits a censored signature of bank erosion as has been found for hill-slope sediment supply to channels (Michaelides and Singer, 2014).
In this paper, we couple two preexisting modelling frameworks: 1) water status in lateral boundaries is based on the channel discharge hydrograph; and 2) infinite slope stability analysis of terrace failure and subsequent grain size selective sediment transport is used to assess the impact of terrace erosion on bed material grain size andfine-grained sedimentflux. We investigate whether consistent thresholds for terrace erosion exist and how various configurations of in-channelflow might be expected to affect the contribution of sediment from lateral bound-aries. We then model the impact of individual storm hydrographs, as well as a decadal sequence of dailyflows at a site along the Yuba River in California, which is impacted by contaminated historical river tailings terraces produced by nineteenth century hydraulic gold mining in the Sierra Nevada foothills (Singer et al., 2013). We further investigate in a simplistic manner how climate changes or dam operations may affect lateral boundary erosion.
2. Field setting andfield data collection
in the form of levees havefixed these legacy sediments into the active Yuba River corridor (James and Singer, 2008).
More than 4 × 10⁶kg of mercury (Hg), used for gold separation, is
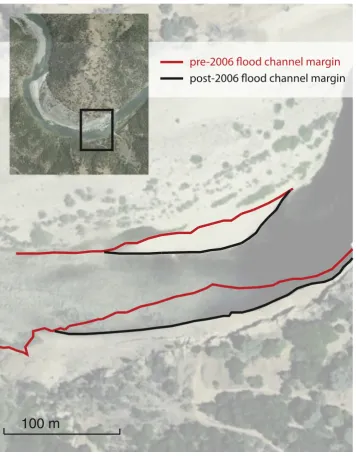
es-timated to have been lost during the mining process (Aplers et al., 2005). Documented concentrations of total Hg in legacy terraces along the Yuba River vary over two orders of magnitude above background values (Singer et al., 2013). Exceedingly high Hg concentrations have also been documented within lowland Sacramento Valley sediments (Hornberger et al., 1999; Springborn et al., 2011) and even in lowland biota and food chains (Greenfield et al., 2005; Eagles-Smith et al., 2009; Greenfield and Jahn, 2010). Much of this Hg appears to emerge from legacy hydraulic mining sediment along the Yuba and other Sierran streams (Bouse et al., 2010; Gehrke et al., 2011; Donovan et al., 2013). It is transported from the toxic upland terraces to the lowlands during majorfloods (Kilham et al., 2012; Singer et al., 2013), leading to planform changes de-tectable in aerial photographs that bracket the timing of thesefloods (Ghoshal et al., 2010) as well as from recent DEM analysis (Carley et al., 2012). Because vertical incision has slowed considerably owing to the ex-posure of coarse bed sediments that create an armored surface layer in the Yuba and other reaches within the Sacramento Valley (Singer, 2008b), lateral erosion has emerged as the dominant processes of hydrau-lic sediment entrainment along the Yuba (Singer et al., 2013). Such epi-sodicflooding of the Yuba River has been shown to force erosion of lateral boundaries and, consequently, valleywide reworking and redistri-bution of unvegetated legacy sediments into lowland environments (Singer et al., 2008, Singer et al., 2013; Singer and Aalto, 2009; Kilham et al., 2012; Springborn et al., 2011) (Fig. 2).
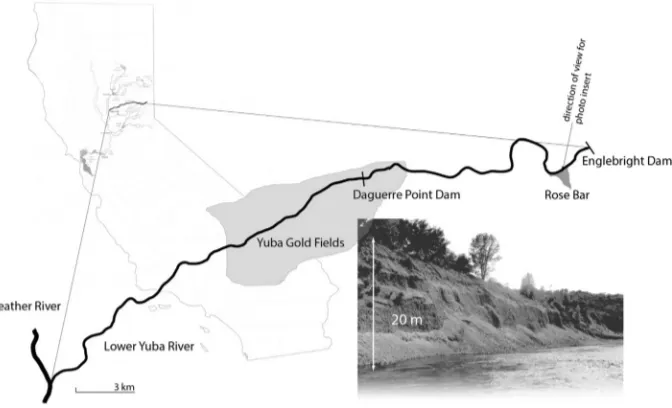
In order to characterise terrace failure and entrainment into sedi-ment loads, we have selected a study area called Rose Bar along a stretch of the Yuba River near Timbuctoo Bend (27 km upstream of the confl u-ence with the Feather River), which includes the largest legacy tailings terrace along the Yuba downstream of Englebright Dam (Fig. 1), and ap-pears to be recruiting sediment over decadal timescales. Sediment accu-mulation rates in Englebright Reservoir based on subaqueous coring (Snyder et al., 2006), are low relative to estimated rates of sediment flux into the Central Valley (Singer et al., 2013), suggesting the domi-nance of downstream, along-channel bank/terrace sediment on decadal sediment budgets for the Yuba that may contribute up to 45% of the total net flux from the Yuba into the downstream Feather River (Carley et al., 2012). The region is subjected to a Mediterranean climate with hot, dry summers and cool, wet winters and ~ 80% of the annual rainfall occurs between November and March (Snyder et al., 2006). The annual precipitation along the lower Yuba River is 500 mm and
mean daily discharge is 100 m3s−1. In spite of various upstream dams
controlling some of the flood flow (Singer, 2007), variability in streamflow is great duringfloods and the hydrographs remain very peaked with rising and falling times that may be increasing and thus leading to longer periods of terrace inundation (Singer et al., 2013) and subsequent downstream transport offine sediment during large floods (Kilham et al., 2012).
Ourfield measurements show that the Rose Bar terrace surface stands ~20 m above the surface of the river bed and the terrace slope angle is 75°. At this site, we collected representative GSDs of dry terrace sediment by bulk dry sieving in thefield (fullφsize classes from 0.063 to 256 mm), satisfying the criteria that the largest particle in the distri-bution comprised no more than 1% of the total sample mass, which is a slight relaxation from the recommendations ofChurch et al. (1987), also employed bySinger (2008a, 2008b). Prior to the bulk collection, smaller samples were sieved from three elevations in the terrace to assess the variability of the GSD through the stratigraphy of the bank. We also characterised the bed material GSD through Wolman pebble counts (Wolman, 1954) on the bar surface and by bulk sieving of the face material (after removing the surface layer). Bar surface and subsur-face GSDs were averaged based on mass (Bunte and Abt, 2001) to generate an initial representative GSD for the riverbed, which was then permitted to adjust through model iterations. Lateral boundary GSDs are required as input to models of water tablefluctuation and bank stability because they determine porosity and permeability and thus control hydraulic conductivity, while channel GSD is required for initial conditions for bed material transport modelling (see below). In order to gain a detailed cross-channel profile, we utilised 0.6-m hori-zontal resolution bathymetry collected by the U.S. Army Corps of Engi-neers in 1999 and determined cross-sectional bank geometry in the field (including bank and toe angles and lengths) using an Impulse 200 Laser Rangefinder with a resolution of 0.01 m.
3. Modelling sediment supply from lateral boundaries
[image:3.595.136.472.53.257.2]Various models have been developed in order to represent the inter-action between lateral boundary erosion and river channels. These models largelyfit into two categories: channel centerline migration models and bank failure models. Channel centerline models, originally conceived by Ikeda et al. (1981) and later developed by others (e.g.,Johannesson and Parker, 1989; Howard, 1992), assume that sedi-ment deposition occurs on the inside of river bends, building point bars and deflecting the high velocity core of theflow toward the outer bank.
Erosion occurs based on depth-averaged near-bank velocity and the cross-sectionally averaged velocity multiplied by an empirical bank erod-ibility coefficient to maintain equilibrium channel geometry. Such model-ling frameworks have been adapted recently for more complex problems, including theflux and residence time of contaminatedfine-grainedfl ood-plains (Lauer and Parker, 2008) and the influence of lingering slump blocks on migration rates (Parker et al., 2011). Generally, channel center-line migration models have been used to predict long-term evolution (years to millennia) in the planform of meander channels (e.g.,Howard, 1992; Sun et al., 1996), but they are challenged to characterise the direct impact of event-based hydrology on bank erosion.
Mass failure models (lateral boundary failure models) simulate ero-sion on a discontinuous timescale, which is appropriate where large but infrequent events dominate lateral erosion (Thorne, 1982). A visual as-sessment of the Lower Yuba River suggests that planar (as opposed to rotational and/or cantilever) failure is the primary mechanism for mass failure on the reach. Planar mass failure occurs when gravitational forces exceed the internal resisting forces within the bank/terrace (Fredlund et al., 1978). They typically focus on (i) lateral boundary
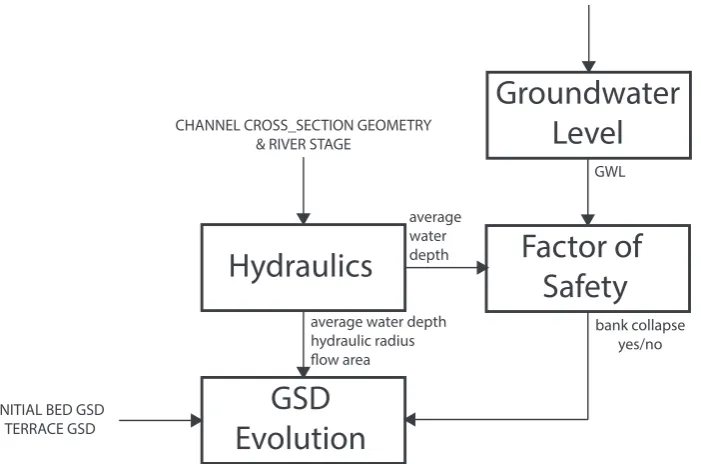
geometry and the influence of tension cracks (Osman and Thorne, 1988) or (ii) the effects of positive and negative pore-water pressures (Casagli et al., 1999; Rinaldi and Casagli, 1999; Simon et al., 2000) in the saturated and unsaturated zones within the lateral boundary mate-rials. Our emphasis here is to assess the influence of the saturated and unsaturated conditions within the lateral boundary (driven byfl uctua-tions in the water table). We have thus adopted a multipronged model-ling approach to investigate the hydrologic controls on mass failure and to address the contribution of failure material to channel sediment loads. The components are (Fig. 3): (i) channel hydraulics (average water depth, hydraulic radius,flow depth); (ii) water table elevation (WTE) in the lateral channel boundary; (iii) lateral boundary stability; and (iv) bed materialflux and corresponding riverbed GSD evolution. We describe these components in detail below.
3.1. Channel hydraulics
The magnitude of waterflux into lateral boundary materials along a river is largely a function of local channel discharge, which integrates
[image:4.595.117.474.52.509.2]100 m
runoff generation processes in the contributing upstream drainage basin. Such local streamflow is straightforwardly characterised by his-torical flood records, which contain information on the various hydrograph characteristics (e.g.,Singer, 2007) that may affect such near-channel erosion processes. We used theflow data and stage-discharge relationship from the nearest gauging station that was rated forflow (USGS site 11418000—3 km upstream). No tributaries enter the Yuba between this gauging station and Rose Bar, so we assume streamflow is approximately uniform and that the cross section at Rose Bar is similar in shape and configuration to the gauging site.
3.2. Water table elevation in the lateral boundary
The elevation of the water table within the lateral boundary strongly controls bank stability through its effect on pore-pressures and the unit weight of bank or terrace sediment (Simon and Collison, 2001). We em-ploy a Darcian water table model (i.e.,flow through the porous media is determined by a rise or fall in pressure gradient) based on the Dupuit– Forchheimer assumption that the groundwater moves horizontally and hydrostatically. We conceive of the Rose Bar terrace as a single sediment layer with uniform porosity and permeability determined from the measured terrace GSD. While this assumption may be limiting in cases where vertical variability exists in the lateral boundary, it is appropriate for many channel terraces that exhibit more uniform GSDs because of their anthropogenic history as tailings fans left over after mining. The Rose Bar terrace is one such tailings fan, so it is largely homogenous in grain-size distribution and by extension in porosity and permeability. We noted only a 4% increase in the gravel-to-sand ratio over roughly 10 m of the vertical terrace profile. In order to maintain a water table gradient, we divide the bank into a consecutive series of vertical col-umns and calculate the water table elevation in each accounting for lat-eralflow between neighbouring columns. We use local river stage (see above) as a boundary condition for the model and assume that water may only enter or exit the model domain from the channel (as lateral hyporheicflow). We therefore also assume that no recharge of the water table occurs from infiltrating precipitation at the top of the terrace and no verticalflow out from the base of the terrace. We make these as-sumptions because the latter two terms in the water budget of the lat-eral boundary are expected to be very small compared with the latlat-eral hyporheicflow for this site. The Dupuit–Forchheimer equation can be
written as
∂h ∂t¼
K ε∂∂x h
∂h ∂x
ð1Þ
whereh= water table elevation (m),t= time (s),K= permeability (m/d),ε= porosity (decimal fraction of pore space), andx= horizontal distance (width) into the bank (m).
In order to maintain model stability, the water table elevation (WTE) time step was set at 15-minute intervals; the input values for the river stage were therefore interpolated from the USGS daily series. Column widths were delineated at 20-cm spacings (Fig. 4b), in order to retain suf-ficient detail to represent later boundary erosion, while encompassing the size of the largest clast (160 mm along the A-axis) found in the terrace.
3.3. Bank stability
Based on the water tablefluctuations discussed above, we modelled erosion of the lateral boundary of our cross-section via infinite slope sta-bility adapted for riverbanks (Amiri-Tokaldany et al., 2003;Simon et al., 2003), which is applicable only for planar failures that apparently pre-vail at this site. We extracted a channel–terrace cross section by com-bining bathymetry with subaerial survey via laser rangefinder to obtain a representative transect of the Rose Bar terrace (Fig. 1). Our sur-vey at this site indicated little variation in angle or shape of the cut bank. Bank stability, measured by Factor of Safety (FoS), is determined as the ratio between the physical resisting forces (Fr) to the forces driving bank
erosion (Fd) (Fig. 4a):
FoS¼Fr
Fd: ð
2Þ
The resultant driving force (Fig. 4a) is
Fd¼Fwsinβ−Fcpsinδ ð3Þ
whereFw= weight of unit width of the failure block (N m−1),β= angle
of failure plane (degrees), Fcp = hydrostatic confining pressure
(N m−1), andδ= angle between the direction of the resultant
[image:5.595.126.477.62.294.2]hydro-static confining pressure and at normal to the failure plane (degrees).
The resultant resisting force (Fig. 4a) is
Fr¼c0LþFsucþFwcosβþFcpcosδ−Fhutanϕ0 ð4Þ
wherec′= effective cohesion averaged across each individual river-bank soil layer (kPa),L= length of failure plane (m),Fsuc= suction
force caused by negative pore-water pressure (N m−1),F
hu=
hydro-static uplift force caused by positive pore-water pressure (N m−1),
andϕ′= angle of internal friction (degrees). The model calculatesFw
as a summed weight of the saturated and unsaturated volumes:
Fw¼ðAunsatγsedÞ þðAsatγsedsatÞ ð5Þ
whereAunsat= projected area by unsaturated layer (m2),γsed= specific
weight of sediment layer (N m−3),A
sat= projected area by saturated
layer (m2), and γ
sedsat = specific weight of saturated soil layer
(N m−3). In order to determine the depth in the bank at which the
sed-iment changes from saturated to unsaturated upon drainage (and the reverse during seepage into the bank), the WTE results are combined with the following equation for capillary rise between the pore spaces in the sediment (Amiri-Tokaldany et al., 2003):
hcr¼4σcosθ
γd
w ð
6Þ
wherehcr= height of capillary rise (m),σ= magnitude of the surface
tension (N m−1),θ= angle of contact between liquid and solid (de-grees),γw= specific weight of water (N m−3), andd= average
diam-eter of the pore-spaces between the sediment (m) (Bowles, 1979):
d≅15D10: ð7Þ
In cases where no tension cracks are present, such as in ourfield area (noted after an extensive search along the terrace top),βis simply
determined as the average of the angle of internal friction and the bank angle (Table 1) (Osman and Thorne, 1988).
TheFcpon a riverbank is defined by compressive forces acting upon
the bank face (Amiri-Tokaldany et al., 2003) as
Fcp¼
ffiffiffiffiffiffiffiffiffiffiffiffiffiffiffiffiffiffiffiffiffiffiffi F2xþF
2 y
r
[image:6.595.116.471.48.314.2]ð8Þ Fig. 4.(a) Force diagram to resolve the factor of safety (FoS) (Eq.(2)) and minimum percentage representation of channel bed cover following terrace failure.WL= Water level (m);L= length of failure plane (m);Hw= depth of water in river (m);H= elevation between the emergence of the failure plane and the top of the bank (m);Wforce= weight of unit width of the
failure block (N m−1);F
cp= hydrostatic confining pressure (N m−1);Fnpwp= negative porewater pressure (N m−1);Fuplift= positive porewater pressure (N m−1);β= angle of failure
plane (degrees);ω= angle of resultant force through failure plane (degrees). (b) Diagram to show percentage bed cover by failed terrace material, 4% for a single column fail, 12% for a 2 column fail, and 24% for a 3 column fail;WTE= water table elevation (m);n= column width (20 cm).
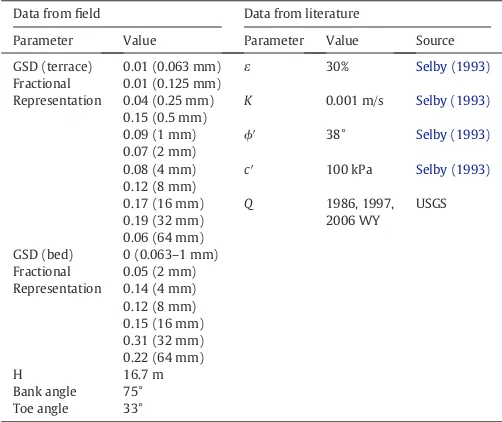
Table 1
Field-measured and literature-based parameter values. Data fromfield Data from literature
Parameter Value Parameter Value Source GSD (terrace) 0.01 (0.063 mm) ε 30% Selby (1993)
Fractional 0.01 (0.125 mm)
Representation 0.04 (0.25 mm) K 0.001 m/s Selby (1993)
0.15 (0.5 mm)
0.09 (1 mm) ϕ′ 38° Selby (1993)
0.07 (2 mm)
0.08 (4 mm) c′ 100 kPa Selby (1993)
0.12 (8 mm)
0.17 (16 mm) Q 1986, 1997, USGS 0.19 (32 mm) 2006 WY
[image:6.595.301.552.532.743.2]in which
Fx¼
1 2H
2
wγw ð9Þ
Fy¼γwVw ð10Þ
whereHw= depth of water in river (m),Vw= volume of water per unit
width on the sloping bank face (m3m−1), and the subscriptsxandy
in-dicate the horizontal and vertical directions of the force (F), respectively.
FollowingAmiri-Tokaldany et al. (2003),δis then determined by
δ¼90−ðβþωÞ ð11Þ
in which
ω¼tan−1Fy
Fx ð12Þ
andω= angle of resultant force through failure plane (degrees). The length of the failure surface is determined by
L¼Hf psinβ ð13Þ
whereHfp= elevation between the emergence of the failure plane and
the top of the bank (m) (Fig. 4a).
We used GSDs measured in thefield (Table 1) from which we can derive representative values forc′andϕ′(Selby, 1993; Simon et al., 2000). We introduce a cohesion value (Table 1) to account for the chemical cementation that was present within the lateral boundary. These are needed to determine the rate of increasing soil strength with increasing matric suction, i.e., pressure induced by soils in order to try and equalise moisture content (Simon and Collison, 2001; Li et al., 2005) in the absence of hydrologicalfield measurements.
We determined the shallow phreatic (water table) boundary eleva-tion using WTE from Eqs.(1) and (6)with selected values of porosity and permeability (Table 1) and subsequently computed the weight act-ing upon the failure plane Eq.(5). Substituting this quantity and values from Eqs.(8), (11), and (13) into Eqs.(3) and (4), we obtain a value for theFoSEq.(2). If Eq.(2)produces a valueb1, the bank is considered to fail at a single point in the bank. Our model then loops theFoSmodel through each column width into the terrace, specified in the WTE model, until the lateral boundary reaches a point of stability (any valueN1). We then compute a two-dimensional area of failure material from the lateral boundary along the cross section.
3.4. Sedimentflux and bed grain-size distribution evolution
Once we determined the lateral boundary failure area (above) in the modelling framework, we account for the textural contribution of the failed sediment to the channel by updating the local river channel GSD. We determine how far into the channel the sediment supplied from the lateral boundary failure extends according to a simple proce-dure that captures the essence of the problem without detailed parameterisation. We assume that minor terrace failures cover the por-tion of the channel bed occupied by the initial bank/terrace toe (Fig. 4b). This assumption is made on the basis that no majorflood events have occurred following the failure of the lateral boundary (a single-column failure) during a recent (2006) largeflood event. Therefore, the present day terrace toe must be a minimum representation of the bed cover (4%) produced by the lateral boundary failure during that event. Deeper terrace failures (multiple columns) are assumed to be proportional to the volume of failed material, while maintaining the same toe angle (33° for the Rose Bar terrace) and are calculated geomet-rically with respect to the cross-sectional area of the column(s). These length scales of sediment supply from the lateral boundary are then used to update channel GSDs, information which feeds back into
calculations of average channel sedimentflux. We use these cover per-centages of failed material to update the overall channel GSD by mixing the terrace GSD with the pre-existing channel GSD (from the previous time step) at specified percentages ratios of terrace:channel contribu-tion (i.e., single-column fail = 4:96%; 2-column fail = 12:88%; and a 3-column fail = 24:76%).
Once we have updated the GSD following lateral boundary failure, we determine the partitioning of bedload and suspended load by com-puting fractional bed material sedimentflux for each full phi grain size class at the same time steps as the WTE modelling. This allows us to characterise the grain size evolution of the riverbed, as well as the partitioning of sediment loads between coarse andfine fractions when the terrace fails. Note that we are not adjusting riverbed topography based on the assumption that this is much slower to change in response to terrace failure than is the channel GSD because of the relative magni-tude of these failures to the channel width (~75 m). Thefine sediment pulse associated with terrace failure is of particular importance for the Yuba study area given the high concentrations of Hg within these legacy sediments (Singer et al., 2013), the strong affinity of Hg and other tran-sition metals forfine sediments (Gibbs, 1977), and the great risks to lowland ecosystems of its downstream delivery (Singer et al., 2013).
We calculate fractional transport rates for all grain-size classes via the Singer–Dunne equation (Singer and Dunne, 2004):
qsn¼α
ρsU2 τ−τc
ffiffiffiffiffi
τ
n
p ffiffiffiffiffiffiffiffiffiffiffiffiffiffiffiffiffiffiffiffiffiffiffiffiffiffiffiffiρs
ρ−1
gd3n s
2gHS fn ð14Þ
whereqsnis the unit bed material transport rate (kg s−1) per unit width
of size classn,αis a dimensionless grain-size dependent parameter based on particle hiding and sorting,ρsis the density of sediment
(as-sumed to be 2650 kg m−3),Uis the streamwise velocity (m s−1),
com-puted via an empiricalfit of the Darcy–Weisbach formula based on grain size (Knighton, 1998),τ⁎is dimensionless shear stress forD50,τ⁎cis the
dimensionless critical shear stress forD50(assumed to be 0.045),τ⁎nis
the dimensionless shear stress computed for a particle in size classn, ρis the density of water (assumed to be 1000 kg m−3for 10 °C
water),gis the gravitational acceleration (9.81 m s−2),d
nis the
charac-teristic grain size (m) of the size class for which the computation is being made,fnis the fraction of bed material in that grain-size class,H
is theflow depth (m), andSis the water surface slope (m m−1).
log10α¼1:62σφþ0:58 Di
D50
−0:5
−7:85 ð15Þ
whereσφis the sorting coefficient of bed material,Diis the characteristic
grain size of each grain-size class,D50is the characteristic (median)
grain size of bed material. Sediment flux is computed as a cross-sectional average using average values offlow hydraulics. We compute fine sedimentfluxes generated by terrace failure as suspended sedi-ment concentrations by dividing dailyflux of material in grain-size clas-ses between 0.063 and 1 mm by the daily channel discharge, assuming this material is rapidly well mixed in theflow.
During periods where the lateral boundary does not fail, Eq.(14) simply iterates to compute fractional sedimentflux based on the evolv-ing GSD at every time step. Upon bank failure, the GSD is updated as de-tailed above and Eq.(14).
3.5. Model operation and goals
the seminal events in the last several decades to produce geomorphic change); (ii) a decadalflow series that incorporates these three events but accounts for historical variability inflows in between thesefloods; (iii) characteristic hydrograph shapes modified from that of one histor-icalflood (2006), but which retain the same overallflood volume; and (iv) simulated anthropogenic modification to the discharge hydrograph (e.g., power peaking).
4. Results and discussion
4.1. Hydrograph shape
Our model shows a tight link between the WTE and theFoSof the lateral boundary when driven using channel stage data for the 1986 (Fig. 5a), 1997 (Fig. 5b) and 2006 (Fig. 5c)flood events. Across these majorflood events of the last several decades, we identify in our model a threshold WTE range of 8–9.25 m above the datum that, once exceeded, induces terrace failure at thefield site. This threshold range is supported by the absence of failure during the second, lower peak of the 1986flood (Fig. 5a) and failure at the peak stage during the 2006flood event (Fig. 5c), bounding a critical range of WTE. The 1997 flood event (Fig. 5b) was the only storm of high enough magnitude to produce a 2-column failure (i.e., 40 cm into the terrace); the other two events induced only single-column failures. The 1997flood was previously shown to deliver a very high sediment load to into the Feath-er RivFeath-er (Kilham et al., 2012; SingFeath-er et al., 2013). This suggests that storms of varying magnitudes and hydrograph shapes could dramatical-ly impact the volume of sediment supplied from lateral boundaries merely as a function of changes in the WTE. The progressive increase in the WTE with each peak in the channel stage and the delayed decline in the WTE within the lateral boundary columns is most clearly visible through the 2006 water year (Fig. 5c). Following a rapid decline in chan-nel stage, the WTE in the lateral boundary is left elevated several metres above the channel water surface. Over time, this retention of water in
the bank weakens boundary material properties and enables collapse, suggesting the importance of antecedent moisture to terrace failure.
Because discharge-driven WTE exerts a strong control on the stabil-ity of sediments within the lateral boundary (Fig. 5), we hypothesise that different hydrograph shapes should affect terrace failure through their influence on WTE and its duration.Singer et al. (2013) and Singer (2007)documented increased rising and falling limbs for the largestfloods in recent decades along the Yuba River. Furthermore, re-gional climate changes are projected to produce larger and longerfloods in the Sacramento River basin well into the future (Dettinger, 2011), as well as shifts in precipitation regimes toward more rainfall and less snow (Knowles et al., 2006).
One characteristic of a storm hydrograph that could be relevant to terrace stability is the baseline discharge above which a flood hydrograph is imprinted. This stage in the channel when theflood be-gins to affect the antecedent moisture (saturation) within the lateral boundary. Elevated water table levels can result from increased rainfall and runoff throughout the hydrologic year, or for near-channel terrace materials, through a series of successiveflood events capable of saturat-ing lateral channel boundaries. However, it is unclear how such ante-cedent moisture may affect failure probabilities within lateral channel boundaries, information that is important for anticipating the knock-on effects of sequences offloods.
To assess this, we adjusted the starting WTE in our model by altering the shape of the driving stream hydrograph while maintaining the same peak discharge. We conducted several modelling experiments that pro-gressively increased the initial discharge (Fig. 6a–c) and therefore stage and terrace WTE. Wefind that increasing the initial channel stage and by extension, antecedent moisture in the lateral boundary rapidly de-creases theFoSsuch that failure occurs at a much greater distance into the terrace (deeper failure generating more sediment supply). Specifi -cally, a doubling of the initial (baseline) channel discharge produces 40-cm (40%) deeper failure, and a tripling of this discharge produces more than three times the depth of failure. In both cases, the failure
Fig. 5.Timeseries of the WTE (m) and theFoSof the Rose Bar cross-section during three water years containing majorfloods: (a) 1986, (b) 1997, and (c) 2006. Isolines in the WTE andFoS
also occurred one to several days earlier (Fig. 6a–c). In order to verify how antecedent moisture might affect terrace stability and to make an estimate on the probability of failure over a longer time-period, we also ran a simulation of 23 years that includes all theflood events shown inFig. 5. The probability of failure on any day within this timeseries is 0.0009, indicating these failure events are quite rare. In fact, we expect this failure probability to be far lower for the entire hy-drologic series over the last six decades. We note that while no change in the depth of failed material occurred (i.e., distance of failure into the terrace) for any of the recent major events, running the entire timeseries reduced (made less stable) the lowestFoSvalues for each event (Fig. 7) compared with those for modelled individual water years (Fig. 5). For example, theFoSfor the 1986, 1997, and 2006 events at the 20-cm depth into the lateral boundary were 40%, 1%, and 7% lower in the 23-year series (Fig. 7). At the 40-cm distance into the boundary during the 1997 failure event, we note an 18% decrease in theFoS. These are the results of antecedent moisture in the river terrace prior to eachflood event.
Our extended timeseries modelling further highlighted that at in-creasing distances into the lateral boundary, the near-bank impact of hyporheicflow dissipates because the highflow in the channel is
modulated as a smoothed and moderate water table elevation. For ex-ample, the WTE at 1 m into the lateral boundary for all three major flood peaks is nearly obscured and exhibits only smallfluctuations with the varying hydrograph (Fig. 7). These results support the impor-tance of antecedent moisture conditions within the near-channel zone when predicting lateral boundary stability. They suggest that aflood event that occurs when the hyporheic WTE is elevated (e.g., resulting from a previousflood or extended high rainfall), the resulting collapse would be more severe, i.e., failure at a greater distance into the terrace, and would occur earlier (c.f.,Fig. 6a–c). In our modelling, an increase in the antecedent discharge from 15% to 50% of the peak discharge (a tre-bling of the baseline discharge from 400 to 1200 m3s−1) shifts the
ini-tial lateral boundary failure one day earlier (Fig. 6a and c). While the timing of the initial failure remains close to day 10 within the modelled series, if the input timeseries instead begins when the discharge begins to rise above the antecedent conditions, failure occurs three days sooner as a result of doubling the antecedent discharge (Fig. 6a–b) andfive days sooner when trebling the antecedent discharge (Fig. 6a–c).
[image:9.595.103.504.51.464.2]Failure on the falling limb of the hydrograph has been noted else-where (Casagli et al., 1999; Rinaldi and Casagli, 1999; Rinaldi et al., 2004). Rinaldi and Darby (2007) suggested that collapsed lateral
Fig. 6.Effects of hydrograph shape on theFoSin the Rose Bar cross-section during a characteristicflood event. Modelled inputflood hydrographs are shown above their correspondingFoS
boundary material produced on the falling limb is likely to remain at the toe for an extended period, compared to that produced by failure on the rising limb or at theflood peak. This is consistent with our field observations of sediment accumulation on the toe during low flow that was likely produced during the last major erosion event of 2006 (Fig. 1). Thus, hydrograph shape apparently impacts the timing of lateral boundary failure, but the length of rising/falling limbs with respect to an unchanging peak discharge should also in-fluence the magnitude of terrace collapse. Wefind that extension (lengthening) of the rising limb produces a substantial reduction in FoS(i.e., increased probability of failure) compared with a contrac-tion or steepening of the rising limb (c.f.,Fig. 6d; e). Increasing the time to peak (from 5 days to 20 days) allows for greater hyporheic flow of water into the lateral boundary thus elevating the terrace WTE near the channel boundary, and shifting failure about a week earlier. This extended permeation offlow reduced theFoSfrom −0.5 to−0.9 for the 20-cm column but also induced failure at the 40-cm-width increment (Fig. 6e). The effect on the timing of failure is clear when comparing the initial failure (at the 20 cm width) be-tween the two simulatedflows. The extended rising limb (Fig. 6e) in-duces failure on the rise to peak at only 66% of the discharge required to induce failure with the steeper rising limb and shifts the timing of this failure 11 days later. Both simulations, however, produced initial failure on the rising limb of the hydrograph, consistent withNardi et al. (2012), likely as a result of loss in apparent cohesion and the re-moval of sediment at the toe.
A commonflood control measure is to cut off the discharge peak (e.g., by storing highflows in upstream reservoirs), thereby dampening the event hydrograph, although various strategies depend on theflood control capacity in the drainage basin (Singer, 2007). Cutting off the peak yields a notable increase in our modelled value ofFoS(Fig. 6f),
indicating that clear links between anthropogenic modifications to flow regimes and lateral boundary stability exist.
[image:10.595.96.493.52.376.2]To further investigate such links, we conducted simulations of four reduced peakflow regimes (stepped percentage reduction from the original peak discharge for the 1986flood), while maintaining the same 70-dayflow volume. Wefind that controlling theflood peak is an effective way to maintain lateral boundary stability. The 40% reduc-tion in peakflow dramatically reduced the depth of failure, and a 50%
Fig. 7.Timeseries of theFoSof the Rose Bar cross-section during a 23-year (1984–2007) model run. Lowest values inFoSare identified. The dashed line at the bottom of the plot displays modelled WTE at 1 m into the terrace.
[image:10.595.307.548.513.708.2]reduction imparted stability to the terrace (Fig. 8). However, this simu-lation required a 50% increase in the duration offlow at peak discharge, during whichFoShovers around the value of terrace failure. We can see in this example that while theFoSin the lateral boundary, following ini-tial failure on day 9 in the event, is always above the threshold for failure (a value of 1), it oscillates above and below a value of 1.3, which is con-sidered to be conditionally stable (Wilson et al., 2007; Parker et al., 2008). However, to reduce the chance of terrace failure during aflood similar to that of 1986, the peak discharge would have to be reduced by 50%.
Conversely, it may be desirable in somefluvial systems with altered streamflows (e.g., Richter et al., 1996) to modify flow releases (e.g.,Richter and Richter, 2000) in order to simulateflood events capable of scouring riverbeds and even eroding lateral boundaries to entrain fresh bed material substrate suitable for aquatic habitat (Kondolf et al., 1996; Poff et al., 1997; Singer and Dunne, 2006). Our modelling framework would be useful for that purpose (e.g., by increasingflood peak discharge until a failure is predicted). The range of conditionally stable values discussed above might be useful for entraining new bed material from banks and terraces as substrate for aquatic habitat (Kondolf and Wolman, 1993), without producing disruptive geomorphic change that reshapes the channel (Wolman and Gerson, 1978). A 40% reduction in the peak discharge for the modelled event might just achieve this goal over theflood period.
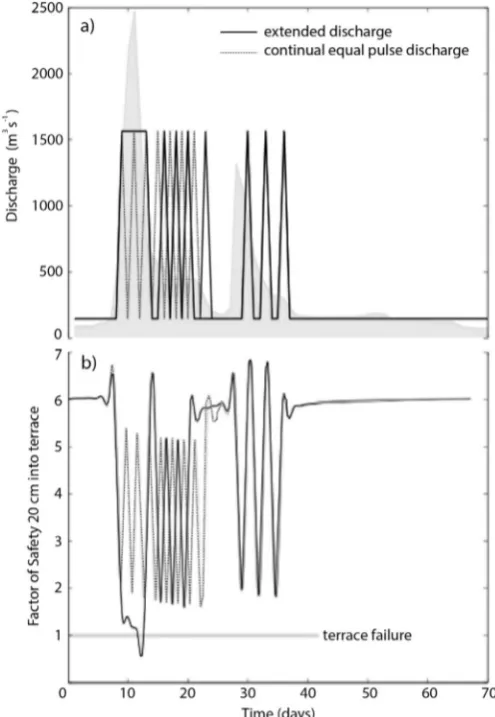
Ourfinal assessment of hydrograph shape is simulation of a hydro-powerflow regime (power peaking), conditions under which lateral boundaries are subjected to sharp rises and falls in discharge pulses (rather than the single peaks assessed inFig. 6). We conducted two modelling experiments—one to assess the effect of a prolonged individ-ual power peak on theFoSin the lateral boundary and the other to in-vestigate a longer series of high discharge pulses (Fig. 9). Again, we used the 1986flood as a base hydrograph and maintained the same total discharge volume while altering for power peaking in both scenar-ios. Wefind that an extended highflow release has a marked negative impact upon the stability of the lateral boundary. When the peak dis-charge is maintained over a period of three days, rather than comprised by a series of three individual peaks, theFoSdeclines from 1.9 to 0.5 causing failure. Shorter durationflow releases progressively reduce theFoS, but it remains above the failure threshold (Fig. 9a and b), con-sistent with thefindings ofDarby et al. (2000). This suggests that low flow power peaking that occurs in the summer months resulting from high electricity demand would not be expected to produce much bank/terrace failure in a channel like the Yuba. However, based on the impact to terrace failure of hydrograph shape in higherflows, close con-sideration should be paid to designing appropriate dam releases during flood event to meet management objectives with respect to the erosion of banks and terraces. Furthermore, influvial systems where banks are created by the modern river (rather than terraces created by legacy pro-cesses), power peaking may be an important consideration for down-stream bank failure.
4.2. GSD Evolution andfine sedimentfluxes
Our modelling framework also allows us to investigate links be-tween the timing of lateral boundary failure and the downstreamflux offine sediment within the channel and to quantify the evolution of the riverbed GSD associated with terrace contributions. Following later-al boundary collapse, an injection offine sediment (b1 mm particle di-ameter) is delivered to the riverbed, but it is removed over a period of 25 days (Fig. 10a). As soon as an armor layer is reestablished (in this in-stance, duringflowsb500 m3s−1) in the model, the bed material grain-size distribution becomes stable (Fig. 10a) (as observed byParker, 1990; Hassan et al., 2006; Mao, 2012). However, in this case, the stable armor layer becomes slightlyfiner as a result of the terrace failure (Fig. 10a).
In terms of sediment pulses produced by terrace failure, our model-ling suggests that during the 1986 water year,fine sedimentflux at the
Rose Bar cross section occurred only following bank collapse (Fig. 10b), producing mean sediment concentration of ~ 300 mg L−1. Recent re-search (Kilham et al., 2012; Singer et al., 2013) reported surface sedi-ment concentrationsN100 mg L−1persisting in the Yuba River up to
[image:11.595.311.559.53.412.2]30 days following the peak discharge of the 1986flood. While these con-centrations cannot be directly compared, our higher concentration value is likely associated with the localised impact of terrace failure on sedi-ment concentration at the peak of the event and does not account for the incorporation and dilution of other boundary failures along the course of the lower Yuba during the same event. Assessment of sedi-ment concentrations from satellite imagery likely reflects the mixing of many discontinuous upstream failures, yielding a lower value of sed-iment concentration, especially well after the event peak (Kilham et al., 2012). In the Yuba, transport of the gravel surface layer that might trap underlyingfine sediment is low and rare because of the presence of bed armoring that maintains bed stability for mostflows. Thus, downstream transport offine sediment is largely derived from lateral boundary fail-ures such as those at Rose Bar. And it is precisely these intense episodes offine sedimentflux derived from failed terraces that are of concern to downstream biota because of the association of this sediment with Hg (Singer et al., 2013). These factors surely play into decadal, reach-scale sediment budgets for this and similarfluvial systems with a legacy of mining.
Fig. 9.(a) 70-day timeseries of simulated hydropowerflow regimes (power peaking). The background hydrograph is the unaltered USGS discharge data (from below Englebright Dam) for the 1986flood event, the solid black line has an initial prolonged release of
flow, and the grey line indicates a series of shorter pulseflows while maintaining the same volume of water as the unaltered discharge series. (b) The corresponding modelled
4.3. Sensitivity analysis
Given the strong links between modelled WTE andFoSresults (Fig. 5), we performed a sensitivity analysis to assess the effects of ter-race materials (porosity and permeability,εandK) within the WTE model onFoS(Fig. 11a–c), using the 1986flood event. FromSelby (1993)we can determine that altering the sand:gravel mix (GSD) with-in the terrace has a greater impact onK than on ε.Selby (1993)
[image:12.595.119.472.53.235.2]presentedεvalues for sand and gravel within an overlapping range; however,Kvalues for sand are an order of magnitude lower than those presented for gravel. Varyingεbetween 25% and 40% (based on gravel and sand GSDs inSelby (1993)), wefind no apparent impact on the timing at which the minimumFoSvalue occurs. The calculated min-imum values ofFoSfor porosities of 25% and 40% are−0.51 and−0.17, respectively, resulting in a 66% increase in bank stability associated with more available pore space in the terrace matrix. We tested the effects of
Fig. 10.(a) Timeseries of the bed material GSD evolution in the Rose Bar cross-section during the 1986 water year. Grain-size classes are represented by individual lines. Annual discharge hydrograph is shown above the GSD evolution plot, and shaded in grey is the period of time through which the GSD on the river bed was evolving. (b) Modelledfine sedimentflux (b1 mm) and sediment concentrations for the 1986flood are represented by the dark lines in their respective plots and a discharge hydrograph is shown shaded in grey.
[image:12.595.109.477.394.716.2]permeability (K) over a range from 0.01 to 0.0001 m s−1and it is
evi-dent that the stability of the terrace is increased by lowering K (Fig. 11a and b). At 20 cm into the lateral boundary,K= 0.01 m s−1
re-sults in aFoSof−1.38, whileK= 0.0001 increasesFoSto 2.10 (more stable), an ~ 250% increase in lateral boundary stability. At 40 cm into the lateral boundary, the stability increases over 1000% (withFoSvalues from−0.46 to 5.00) for the same assessed range inKvalues. Therefore, the material properties affecting theflow of water in the lateral bound-ary clearly have an important influence on theFoS, and the model is markedly more sensitive to permeability. Considering these factors, field measurements of permeability (e.g., via permeameter) would cer-tainly reduce uncertainty in terrace/bank stability models.
5. Conclusion
Episodic reworking of terrace material along the Lower Yuba River is responsible for mass delivery offine sediments (in particular), which contain most of the Hg contamination (Springborn et al., 2011; Singer et al., 2013), to the downstream environment. Here, we identified the mechanism for thisflux as terrace failure during largeflood events (Fig. 10), and we identified how it might vary according to hydrograph shape and antecedent moisture conditions (Fig. 6). In addition, we assessed the impact of various anthropogenically forcedflow regimes (Figs. 8 and 10) on terrace failure.
Lateral boundary stability in the Rose Bar has been shown to be strongly linked to the magnitude of the peak discharge and its influence on the WTE within the lateral boundary (Fig. 5), the duration of time taken to reach that peak (Fig. 6d and e), and the antecedent conditions prior to the peak (Fig. 6a–c). Each of these conditions leads to a sustained high river stage acting on the face of the lateral boundary facilitating greater lateral infiltration, resulting in increased weight of the terrace ma-terials acting upon the failure plane and ultimately generating mass fail-ure. The longer the residence time of a high stage in the channel, the greater the time would be required for the WTE to respond to drawdown in stage/discharge visibility (Fig. 5c). We conclude that changes in the shape of theflood hydrograph, which may be forced by climate or by an-thropogenic controls for damming, have the potential to drive increased/ decreased mass wasting of lateral boundaries of rivers.
Acknowledgements
This work was funded in part by the Natural Environment Research Council in the form of a PhD studentship to Higson and by a U.S. Nation-al Science Foundation grant to Singer (EAR-1226741). We thank S. Mudd and J-P. Reneau for assistance in model development, and A. Simon for helpful discussions. We would also like to acknowledge Mikael Attal, Vincent Rinterknecht, and several anonymous reviewers for helpful input/advice as well as the journal editor for detailed editing.
References
Alvarez, L.V., Schmeeckle, M.W., 2013.Erosion of river sandbars by diurnal stagefl uctua-tions in the Colorado River in the Marble and Grand Canyons: full-scale laboratory experiments. River Res. Appl. 29 (7), 839–854.
American Society of Civil Engineers, 1998a.River width adjustment. I. Process and mech-anisms. J. Hydrol. Eng. 124 (9), 881–902.
American Society of Civil Engineers, 1998b.River width adjustment. II. Modeling. J. Hydrol. Eng. 124 (9), 903–917.
Amiri-Tokaldany, E., Darby, S.E., Tosswell, P., 2003.Bank stability analysis for predicting reach scale land loss and sediment yield. J. Am. Water Resour. Assoc. 39, 897–909.
Amiri-Tokaldany, E., Darby, S.E., Tosswell, P., 2007.Coupling bank stability and bed defor-mation models to predict equilibrium bed topography in river bends. J. Hyrologic Eng. 133 (10), 1167–1170.
Aplers, C.N., Hunerlach, M.P., May, J.T., Hothem, R.L., 2005.Mercury contamination from historical gold mining in California. USGS Fact Sheet 2005-3014 (1.1).
Bouse, R.M., Fuller, C.C., Luoma, S., Hornberger, M.I., Jaffe, B.E., Smith, R.E., 2010. Mercury-contaminated hydraulic mining debris in San Francisco Bay: San Francisco. Estuary Watershed Sci. J. 8 (1), 28.
Bowles, J.E., 1979.Physical and Geotechnical Properties of Soils. McGraw-Hill Inc., United Kingdom, p. 478.
Bull, L.J., 1997.Magnitude and variation in the contribution of bank erosion to the suspended sediment load of the River Severn, UK. Earth Surf. Process. Landf. 22, 1109–1123.
Bunte, K., Abt, S.R., 2001.Sampling surface and subsurface particle-size distributions in wadable gravel- and cobble-bed streams for analysis in sediment transport, hydrau-lics, and streambed monitoring. US Dept. of Agriculture, Forest Service, Rocky Moun-tain Research Station, General Technical Report.
Carley, J.K., Pasternack, G.B., Wyrick, J.R., Barker, J.R., Bratovich, P.M., Massa, D.A., Reedy, G.D., Johnson, T.R., 2012.Significant decadal channel change 58–67 years post-dam accounting for uncertainty in topographic change detection between contour maps and point cloud models. Geomorphology 179, 71–88.
Carson, M.A., Taylor, C.H., Grey, B.J., 1973.Sediment production in a small Appalachian watershed during spring runoff, Eaton Basin 1970–1972. Can. J. Earth Sci. 10, 1707–1734.
Casagli, N., Rinaldi, M., Gargini, A., Curini, A., 1999.Pore water pressure and streambank stability: results from a monitoring site on the Sieve River, Italy. Earth Surf. Process. Landf. 24, 1095–1114.
Church, M., Mclean, D., Wolcott, J.F., 1987.River bed gravels: sampling and analysis. In: Thorne, C.R., Bathurst, J.C., Hey, R.W. (Eds.), Sediment Transport in Gravel Bed Rivers. Wiley, Chichester, pp. 43–79.
Darby, S.E., Thorne, C.R., 1996.Numerical simulation of widening and bed deformation of straight sand-bed rivers. I: model development. J. Hydrol. Eng. 122, 184–193.
Darby, S.E., Gressler, D., Thorne, C.R., 2000.Computer program for stability analysis of steep, cohesive riverbanks. Earth Surf. Process. Landf. 25, 175–190.
Darby, S.E., Rinaldi, M., Dapporto, S., 2007.Coupled simulations offluvial erosion and mass wasting for cohesive river banks. J. Geophys. Res. Earth Surf. 112.
Dettinger, M., 2011.Climate change, atmospheric rivers, andfloods in California - A multimodel analysis of storm frequency and magnitude changes. J. Am. Water Resour. Assoc. 47 (3), 514–523.
Donovan, P.M., Blum, J.D., Yee, D., Gehrke, G.E., Singer, M.B., 2013.An isotopic record of mercury in San Francisco Bay sediment. Chem. Geol. 349–350, 87–98.
Dunne, T., Mertes, L., Meade, R., Richey, J., 1998.Exchanges of sediment between theflood plain and channel of the Amazon River in Brazil. Geol. Soc. Am. Bull. 110 (4), 450–467.
Eagles-Smith, C.A., Ackerman, J.T., De La Cruz, S.E.W., Takekawa, J.Y., 2009.Mercury bioac-cumulation and risk to three waterbird foraging guilds is influenced by foraging ecol-ogy and breeding stage. Environ. Pollut. 157.
Fredlund, D.G., Morgenstern, N.R., Widger, R.A., 1978.Shear-strength of unsaturated soils. Can. Geotech. J. 15, 313–321.
Gehrke, G.E., Blum, J.D., Slotton, D.G., Greenfield, B.K., 2011.Mercury isotopes link mercury in San Francisco Bay foragefish to surface sediments. Environ. Sci. Technol. 45 (4), 1264–1270.
Gibbs, R.J., 1977.Transport phases of transition metals in the Amazon and Yukon Rivers. Geol. Soc. Am. Bull. 88 (6), 829–843.
Ghoshal, S., James, L.A., Singer, M.B., Aalto, R., 2010.Channel andfloodplain change anal-ysis over a 100-year period: Lower Yuba River, California. Remote Sens. 2 (7), 1797–1825.
Greenfield, B.K., Jahn, A., 2010.Mercury in San Francisco Bay foragefish. Environ. Pollut. 158.
Greenfield, B.K., Davis, J.A., Fairey, R., Roberts, C., Crane, D., Ichikaway, G., 2005.Seasonal, interannual, and long-term variation in sportfish contamination, San Francisco Bay. Sci. Total Environ. 336.
Hassan, M.A., Egozi, R., Parker, G., 2006.Experiments on the effect of hydrograph charac-teristics on vertical grain sorting in gravel bed rivers. Water Resour. Res. 42.
Hornberger, M.I., Luoma, S.N., Van Geen, A., Fuller, C., Anima, R., 1999.Historical trends of metals in the sediments of San Francisco Bay, California. Mar. Chem. 64.
Howard, A.D., 1992.Modelling channel migration andflooplain sedimentation in meandering streams. In: Carling, P.A. (Ed.), Lowland Floodplain Rivers: Geomorpho-logical Perspectives. John Wiley and Sons, New York, pp. 1–39.
Humphries, R., Venditti, J.G., Sklar, L.S., Wooster, J.K., 2012.Experimental evidence for the effect of hydrographs on sediment pulse dynamics in gravel-bedded rivers. Water Resour. Res. 48.
Ikeda, S., Parker, G., Sawai, K., 1981.Bend theory of river menaders: 1. Linear develop-ment. J. Fluid Mech. 112, 363–377.
James, L.A., 1989.Sustained storage and transport of hydraulic gold mining sediment in the Bear River, California. Ann. Assoc. Am. Geogr. 79, 570–592.
James, L.A., Singer, M.B., 2008.Development of the Lower Sacramento Valleyfl ood-control system: an historic perspective. Nat. Hazards Rev. 9 (3), 125–135.
Johannesson, H., Parker, G., 1989.Linear theory of river meanders. In: Ikeda, S., Parker, G. (Eds.), River Meandering. American Geophys. Union, Washington D.C., pp. 181–214.
Kilham, N.E., Roberts, D., Singer, M.B., 2012.Remote sensing of suspended sediment con-centration duringflood conditions on the Feather River, California: a modeling ap-proach. Water Resour. Res. 48 (1), W01521.
Knowles, N., Dettinger, M.D., Cayan, D.R., 2006.Trends in snowfall versus rainfall in the Western United States. J. Clim. 19 (18), 4545–4559.
Knighton, D., 1998.Fluvial Forms and Processes: A New Perspective. Hodder Arnold Pub-lication, London, p. 383.
Kondolf, G.M., Wilcock, P.R., 1996.Theflushingflow problem: Defining and evaluating objectives. Water Resour. Res. 32, 2589–2599.
Kondolf, G.M., Wolman, M.G., 1993.The sizes of salmonid spawning gravels. Water Resour. Res. 29 (7), 2275–2285.
Lauer, J.W., Parker, G., 2008.Modeling framework for sediment deposition, storage, and evacuation in thefloodplain of a meandering river: application to the Clark Fork River, Montana. Water Resour. Res. 44.
Luppi, L., Rinaldi, M., Teruggi, L.B., Darby, S.E., Nardi, L., 2009.Monitoring and numerical modelling of riverbank erosion processes: a case study along the Cecina River, Central Italy. Earth Surf. Process. Landf. 34 (4), 530–546.
Mao, L., 2012.The effect of hydrographs on bed load transport and bed sediment spatial arrangement. J. Geophys. Res. Earth Surf. 117.
Michaelides, K., Singer, M.B., 2014.Impact of coarse sediment supply from hillslopes to the channel in runoff-dominated, drylandfluvial systems. J. Geophys. Res. Earth Surf. 119 (6) (2013JF002959).
Nardi, L., Rinaldi, M., Solari, L., 2012.An experimental investigation on mass failures oc-curring in a riverbank composed of sandy gravel. Geomorphology 163–164, 36–69.
Odgaard, A.J., 1987.Streambank erosion along two rivers in Iowa. Water Resour. Res. 23 (7), 1225–1236.
Osman, A.M., Thorne, C.R., 1988.Riverbank stability analysis: 1. Theory. J. Hydraul. Eng. ASCE 114, 134–150.
Parker, G., 1990.Fluvial armor. J. Hydraul. Res. 28 (4), 529–544.
Parker, C., Simon, A., Thorne, C.R., 2008.The effects of variability in bank material proper-ties on riverbank stability: Goodwin Creek, Mississippi. Geomorphology 101.
Parker, G., Shimizu, Y., Wilkerson, G.V., Eke, E.C., Abad, J.D., Lauer, J.W., Paola, C., Dietrich, W.E., Voller, V.R., 2011.A new framework for modeling the migration of meandering rivers. Earth Surf. Process. Landf. 36.
Poff, N.L., Allan, J.D., Bain, M.B., Karr, J.R., Prestegaard, K.L., Richter, B.D., Sparks, R.E., Stromberg, J.C., 1997.The naturalflow regime. Bioscience 47 (11), 769–784.
Rice, S., 1998.Which tributaries disrupt downstreamfining along gravel-bed rivers? Geo-morphology 22, 39–56.
Richter, B.D., Richter, H.E., 2000.Prescribingflood regimes to sustain riparian ecosystems along meander rivers. Conserv. Biol. 14 (5), 1467–1478.
Richter, B.D., Baumgatner, J.V., Powell, J., Braun, D.P., 1996.A method for assessing hydro-logic alteration within ecosystems. Conserv. Biol. 10 (4), 1163–1174.
Rinaldi, M., Casagli, N., 1999.Stability of streambanks formed in partially saturated soils and effects of negative pore water pressures: the Sieve River, Italy. Geomorphology 26, 253–277.
Rinaldi, M., Casagli, N., Dapporto, S., Gagini, A., 2004.Monitoring and modelling of pore water pressure changes and riverbank stability duringflow events. Earth Surf. Pro-cess. Landf. 29, 237–254.
Rinaldi, M., Darby, S.E., 2007.Modelling river-bank erosion processes and mass failure mechanisms: progress towards fully coupled simulations. In: Habersack, H., Piegay, H., Rinaldi, M. (Eds.), Gravel-Bed Rivers VI: from Process Understanding to River Res-toration. Elsevier, Amsterdam, The Netherlands, pp. 213–239.
Rinaldi, M., Mengoni, B., Luppi, L., Darby, S.E., Mosselman, E., 2008.Numerical simulation of hydrodynamics and bank erosion in a river bend. Water Resour. Res. 44 (9).
Selby, M.J., 1993.Hillslope Materials and Processes. Oxford University Press, Oxford, United Kingdom (480 pp.).
Simon, A., Collison, A.J.C., 2001.Pore-water pressure effects on the detachment of cohe-sive streambeds: seepage forces and matric suction. Earth Surf. Process. Landf. 26.
Simon, A., Darby, S.E., 2002.Effectiveness of grade-control structures in reducing erosion along incised river channels: the case of Hotophia Creek, Mississippi. Geomorphology 42 (3–4), 229–254.
Simon, A., Collison, A., Layzell, A., 2003.Incorporating bank-toe erosion by hydraulic shear into the ARS bank-stability model: Missouri River, Eastern Montana. World Water & Environ. Res. Cong, pp. 1–11.
Simon, A., Wolfe, W.J., Molinas, A., 1991.Mass wasting algorithms in alluvial channel model. Proceedings 5th Federal Interagency Sedimentation Conference, Las Vegas 2 (8-22-28-29).
Simon, A., Curini, A., Darby, S.E., Langendoen, E.J., 2000.Bank and near-bank processes in an incised channel. Geomorphology 35, 193–217.
Singer, M.B., Dunne, T., 2006. Modeling the influence of river rehabilitation scenarios on bed material sedimentflux in a large river over decadal timescales. Water Resour. Res. 42 (12), 14.http://dx.doi.org/10.1029/2006wr004894(W12415,).
Singer, M.B., 2007.The influence of major dams on hydrology through the drainage net-work of the Sacramento Valley, California. River Res. Appl. 23, 55–72.
Singer, M.B., Aalto, R., James, L.A., 2008.Status of the lower Sacramento Valleyfl ood-con-trol system within the context of its natural geomorphic setting. Nat. Hazards Rev. 9 (3), 104–115.
Singer, M.B., 2008a.A new sampler for extracting bed material sediment from sand and gravel beds in navigable rivers. Earth Surf. Process. Landf. 33 (14), 2277–2284.
Singer, M.B., 2008b. Downstream patterns of bed-material grain size in a large, lowland alluvial river subject to low sediment supply. Water Resour. Res. 44, W12202.
http://dx.doi.org/10.1029/2008WR007183.
Singer, M.B., 2010. Transient response in longitudinal grain size to reduced gravel supply in a large river. Geophys. Res. Lett. 37 (18)L18403.http://dx.doi.org/10.1029/ 2010GL044381.
Singer, M.B., Aalto, R., 2009.Floodplain development in an engineered setting. Earth Surf. Process. Landf. 34, 291–304.
Singer, M.B., Dunne, T., 2001.Identifying eroding and depositional reaches of valley by analysis of suspended-sediment transport in the Sacramento River, California. Water Resour. Res. 37 (12), 3371–3381.
Singer, M.B., Dunne, T., 2004.Modeling decadal bed material sedimentflux based on sto-chastic hydrology—art. no. W033032. Water Resour. Res. 40, 14.
Singer, M.B., Aalto, R., James, L.A., Kilham, N.E., Higson, J.L., Ghoshal, S., 2013.Enduring leg-acy of a toxic fan via episodic redistribution of California gold mining debris. Proc. Natl. Acad. Sci. 110 (46), 18436–18441.
Singer, M.B., Michaelides, K., 2014.How is topographic simplicity maintained in ephem-eral dryland channels? Geology 42 (12), 1091–1094.
Slater, L.J., Singer, M.B., Kirchner, J.W., 2015.Hydrologic versus geomorphic drivers of trends inflood hazard. Geophys. Res. Lett. 42 (2), 370–376.
Snyder, N.P., Wright, S.A., Alpers, C.N., Flint, L.E., Holmes, C.W., Rubin, D.M., 2006.
Reconstructing depositional processes and history from reservoir stratigraphy: Englebright Lake, Yuba River, northern California. J. Geophys. Res. Earth Surf. 111.
Springborn, M., Singer, M.B., Dunne, T., 2011.Sediment-adsorbed total mercuryflux through Yolo Bypass, the primaryfloodway and wetland in the Sacramento Valley, California. Sci. Total Environ. 412–413, 203–213.
Sun, T., Meakin, P., Jossang, T., Schwarz, K., 1996.A simulation model for meandering riv-ers. Water Resour. Res. 32, 2937–2954.
Terzaghi, K., 1942.Theoretical Soil Mechanics. Wiley, New York 978-0-471-85305-3.
Thorne, C.R., 1982.Processes and mechanisms of river bank erosion. In: Hey, R.D., Bathurst, J.C., Thorne, C.R. (Eds.), Gravel-bed Rivers. J. Wiley & Sons, London, pp. 227–271.
Walling, D.E., Owens, P.N., Leeks, G.J.L., 1999.Fingerprinting suspended sediment sources in the catchment of the River Ouse, Yorkshire, UK. Hydrol. Process. 13, 955–975.
Wilson, G.V., Perketi, R.K., Fox, G.A., Dabney, S.M., Shields, F.D., Cullum, R.F., 2007.Soil properties controlling seepage erosion contributions to streambank failure. Earth Surf. Process. Landf. 32, 447–459.
Wolman, M.G., 1954.Method of sampling coarse river bed material. Trans. AGU 35, 951–956.