doi:10.3168/jds.2007-0621
©American Dairy Science Association, 2008.
Cow, Farm, and Herd Management Factors in the Dry Period
Associated with Raised Somatic Cell Counts in Early Lactation
M. J. Green,*†1A. J. Bradley,‡ G. F. Medley,§ and W. J. Browne‡
*School of Veterinary Medicine and Science, University of Nottingham, Sutton Bonington Campus, Sutton Bonington, LE12 5RD †School of Mathematical Sciences, University of Nottingham, Nottingham, NG7 2RD, UK
‡Department of Clinical Veterinary Science, University of Bristol, Langford House, Langford, Bristol, BS40 5DT, UK §Ecology and Epidemiology Group, Department of Biological Sciences, University of Warwick, Coventry, CV4 7AL, UK
ABSTRACT
This study investigated cow characteristics, farm facilities, and herd management strategies during the dry period to examine their joint influence on somatic cell counts (SCC) in early lactation. Data from 52 com-mercial dairy farms throughout England and Wales were collected over a 2-yr period. For the purpose of analysis, cows were separated into those housed for the dry period (6,419 cow-dry periods) and those at pasture (7,425 cow-dry periods). Bayesian multilevel models were specified with 2 response variables: ln SCC (con-tinuous) and SCC >199,000 cells/mL (binary), both within 30 d of calving. Cow factors associated with an increased SCC after calving were parity, an SCC >199,000 cells/mL in the 60 d before drying off, increas-ing milk yield 0 to 30 d before dryincreas-ing off, and reduced DIM after calving at the time of SCC estimation. Herd management factors associated with an increased SCC after calving included procedures at drying off, aspects of bedding management, stocking density, and method of pasture grazing. Posterior predictions were used for model assessment, and these indicated that model fit was generally good. The research demonstrated that specific dry-period management strategies have an im-portant influence on SCC in early lactation.
Key words: mastitis, somatic cell count, dry period, Bayesian multilevel model
INTRODUCTION
Somatic cell counts in milk are commonly used as indicators of mammary health on the basis that they reflect an immune response and therefore the presence of infection in the mammary gland. An SCC<100,000 cells/mL is reported to be normal in a healthy mammary gland (Sordillo et al., 1997), whereas an SCC>200,000
Received August 17, 2007. Accepted December 19, 2007.
1Corresponding author: martin.green@nottingham.ac.uk
1403
cells/mL is suggestive of bacterial infection (Brolund, 1985; Dohoo and Leslie, 1991; Schepers et al., 1997). Whereas the greatest variation in SCC results from the presence or absence of an infection, a number of other factors influence variability including parity, stage of lactation, time of day, and season of the year (Dohoo and Meek, 1982; Laevens et al., 1997; Schepers et al., 1997; Green et al., 2006). A threshold of 200,000 cells/ mL in composite milk from all 4 quarters provides a useful guideline for the likely presence of an IMI in at least 1 quarter, with a sensitivity and specificity of approximately 70% (McDermott et al., 1982; Dohoo and Leslie, 1991; Schepers et al., 1997).
Changes in SCC across a threshold have been used to estimate the occurrence of new IMI (Cook et al., 2002; Schukken et al., 2003; Bradley and Green, 2005). This concept has been extended to the dry period, and SCC changes from below to above 200,000 cells/mL between the end of one lactation and the start of the next lacta-tion are suggestive of a new dry period IMI (Bradley et al., 2002; Cook et al., 2002; Bradley and Green, 2005). A study on a selection of Wisconsin dairy herds indi-cated that there was large between-herd variation in the proportion of cows that undergo SCC changes across the dry period, and the authors proposed that on-farm factors may be important in explaining these differ-ences (Cook et al., 2002). Similarly, studies of dry period IMI using milk culture have identified differences in patterns of IMI during the dry period between farms and over time (Dingwell et al., 2004; Green et al., 2005). Causes of variability in the risk of infection during the dry period between farms are likely to be an important aspect of mastitis control but to date have been poorly quantified (Huijps and Hogeveen, 2007).
Figure 1.Proportion of cows in a farm-year with SCC>199,000 cell/mL in the first 30 d of lactation, for each of 102 farm years, for cattle housed during the dry period.
aspects of precalving management (De Vliegher et al., 2004b; Svensson et al., 2006). An increased SCC early in the first lactation is of importance because it has been associated with an increased risk of culling, raised SCC, and reduced milk production later in that lacta-tion (De Vliegher et al., 2004a, 2005a,b).
The purpose of this research was to investigate con-currently heifer and dry period management in relation to SCC in early lactation. Specific focus was on the joint influences of cow characteristics, farm facilities, and herd management strategies on SCC within 30 d of calving. A similar approach has recently been used to identify dry period determinants of the rate of clinical mastitis in early lactation in UK dairy herds (Green et al., 2007a).
MATERIALS AND METHODS
The data used for this research have been described in detail previously (Green et al., 2007a), and a brief outline is provided.
Farm Selection
Fifty-two commercial dairy farms located throughout England and Wales were included in the study over a 2-yr period. This cohort was selected following partici-pation in an earlier research project (Green et al., 2007b) and were known to have heterogeneity in the proportion of cows with SCC>199,000 cells/mL in the first monthly recording of lactation (Figures 1 and 2). During the study period, the median herd size was 156 cows (minimum = 55, maximum = 321), and the median milk yield 8,500 kg per cow per year (mean = 8,215
Figure 2.Proportion of cows in a farm year with SCC>199,000
cell/mL in the first 30 d of lactation, for each of 104 farm years, for cattle at pasture during the dry period.
kg, standard deviation = 1,115 kg). The median rolling annual bulk milk somatic cell count was 198,000 cells/ mL. The vast majority of cows were Holstein-Friesian breed; 46 farms were composed entirely of Holstein-Friesians, 3 farms were composed of Holstein-Friesians with fewer than 2% other breeds (Jersey, Guernsey, Shorthorn, Brown Swiss, and cross breeds), and 3 farms were composed of Holstein-Friesians with between 10 and 33% other breeds (Jersey, Guernsey, Shorthorn, Brown Swiss, and cross breeds). There were insufficient numbers of different breeds to make between-breed comparisons. In 100 out of 104 farm-years in the study, dry cow treatments were used for all cows (but not for heifers prior to the first calving), and in the remaining 4 farm-years dry cow treatments were used for most cows (but not for heifers before the first calving) with occasional cows being missed. In 41 farm-years, the dry cow treatments were all antibiotic dry cow therapies, and in 63 farm-years, an internal teat sealant was used for cows with a low cell count before drying off (the SCC threshold being defined by the individual farm) with antibiotic dry cow therapy administered to other cows. No herds used the strategy of purposely omitting dry cow treatments for selected groups of cows, and there-fore the effect of “no dry cow treatment” was not as-sessed. Information on dry cow products and product selection criteria was obtained from farm records and farmer interviews.
Description of the Data
[image:2.612.37.281.77.248.2]Figure 3.Scatter plot of the proportion of cows with SCC>199,000 cell/mL and the arithmetic mean herd SCC, in the first 30 d of lacta-tion, for 102 farm years when cattle were housed during the dry period.
[image:3.612.62.311.509.674.2]on-farm observation, using structured, pretested ques-tionnaires. Information from questionnaires was col-lected in May or June 2004 (for yr 1) and again in May or June 2005 (for yr 2). The information collected was in the following categories: general farm information (e.g., herd size, milk yield), protocols for any vaccina-tions administered (both for mastitis and other dis-eases), staff quantity and work patterns, cow groups and dates of movement between groups (including length of dry period), bedding (types, storage, quantities used, and methods of application and clean out), cow nutrition and water, procedures used for drying off (in-cluding products used, selection criteria for using teat
Figure 4.Scatter plot of the proportion of cows with SCC>199,000
cell/mL and the arithmetic mean herd SCC, in the first 30 d of lacta-tion, for 104 farm years when cattle were at pasture during the dry period.
Figure 5.Scatter plot of the arithmetic mean herd SCC in the
first 30 d of lactation, for cattle housed and at pasture, for 102 farm-years of the study (2 farm-farm-years omitted with no housed dry peri-ods available).
sealants if applicable, and methods of application), de-tails of dry cow housing and pasture management, calv-ing cow houscalv-ing management, management procedures for calving, and recently calved cows and methods of fly control. Because heifers were generally kept separately from older cows, information relating solely to heifers or solely to older cows was included in the analysis but categorized as not applicable when appropriate for different parities. Parity was defined for each cow as the number of parturitions at the time of SCC estimation in the first 30 d of lactation, and thus heifers calving for the first time were defined as parity one cows. If a management policy changed during the year, the date of the change was recorded and the appropriate data used for each cow. Approximately 350 pieces of informa-tion were collected relating to each cow-dry period.
Table 1.Parameter estimates from the multilevel model with log (SCC/1,000) as the response, for cows housed during the dry period (model 1)
n cow 95% credibility interval
dry-periods of change in SCC
Model term or farm-years Change
Intercept = 4.83 (f) Coefficient in SCC1 2.5% 97.5%
Parity>4 1,624 Reference 0
Parity 1 1,512 −0.33 −35,454 −49,972 −19,148
Parity 2 1,351 −0.48 −47,797 −55,076 −39,844
Parity 3 1,058 −0.37 −39,320 −47,790 −29,926
Parity 4 874 −0.27 −29,840 −39,835 −19,063
Milk yield 0 to 30 d before dry off 0 to 10 kg 1,091 Reference 0
Milk yield 0 to 30 d before dry off>10 to 20 kg 2,360 0.13 17,646 4,123 32,539 Milk yield 0 to 30 d before dry off>20 kg 913 0.21 29,317 11,048 49,681 No milk yield available 0 to 30 d before dry off 2,055 0.38 58,256 −47,040 247,322 SCC 0 to 30 d before dry off≤199,000 cells/mL 2,328 Reference 0
SCC 0 to 30 d before dry off>199,000 cells/mL 2,023 0.17 23,129 9,954 37,758 No SCC recorded 0 to 30 d before dry off 2,068 −0.17 −19,360 −71,071 120,137 SCC 31 to 60 d before dry off≤199,000 cells/mL 2,861 Reference 0
SCC 31 to 60 d before dry off>199,000 cells/mL 1,586 0.26 36,377 22,004 51,777 No SCC recorded 31 to 60 d before dry off 1,972 0.16 22,122 3,449 43,589 Cleaning of teat2without use of surgical spirit swab 59f Reference 0
Cleaning of teat includes use of surgical spirit swab 43f −0.18 −21,065 −33,221 −7,741 Cow bedding materials not all stored inside 27f Reference 0
Cow bedding materials all stored inside 75f −0.15 −17,498 −31,827 −692 Straw in early dry period cubicles is: Unchopped 17f Reference
Always chopped 18f −0.39 −40,424 −56,089 −21,242
Sometimes chopped 1f 0.06 7,673 −58,045 132,368
Do not use straw cubicles 66f −0.08 −9,447 −29,063 12,623
Transition yard area<1.25 m2per 1,000 kg of milk production3 41f Reference 0
Transition yard area>1.25 m2per 1,000 kg of milk production 35f −0.12 −13,942 −27,312 −264
Transition cows not in yards 26f −0.04 −5,141 −23,347 15,586
Calving accommodation receives even coverage of bedding 73f Reference 0
Calving accommodation not an even coverage of bedding 22f 0.19 26,359 6,117 50,277 Calving accommodation bedding coverage uncertain 7f 0.02 2,209 −25,339 36,977 Cows first fore-milked≤4 h after calving 7f Reference
Cows first fore-milked>4 h after calving 91f 0.31 44,436 11,119 84,138 Cows first fore-milked at a variety of times 4f 0.13 17,160 −34,112 99,268 SCC recorded<11 d postcalving 1,587 Reference
SCC recorded 11 to 15 d postcalving 1,227 −0.23 −25,769 −34,194 −16,467 SCC recorded 16 to 20 d postcalving 1,402 −0.45 −45,839 −52,078 −38,905 SCC recorded 21 to 25 d postcalving 1,278 −0.58 −55,293 −61,621 −48,516 SCC recorded 26 to 30 d postcalving 925 −0.56 −54,290 −61,442 −46,458
Cow-dry period variance 1.66 1.604 1.720
Farm-year variance 0.01 0.001 0.029
Farm level variance 0.05 0.024 0.087
1Change in SCC = difference to the model mean of 125,462 cells/mL. 2Cleaning of teat = cleaning before administering dry cow treatments. 3Milk production = herd annual mean milk produced per cow.
management factors were applicable and these were considered to be different biological processes. Cows that had a split dry period (partly housed and partly at pasture) were analyzed in different ways. First, they were omitted from the analyses altogether; second, they were included as subjects in both categories; and third, they were included in both categories but with an indi-cator variable “part housed/pasture”. No differences in model interpretation occurred between these methods, and the latter method was chosen to estimate final model parameters. Cows calving for the first time were included in the analysis with precalving milk and SCC data categorized as “not recorded”.
Statistics and Analysis
Cow and farm data were transferred to a database (Microsoft Access 2003, Microsoft Corporation, Red-mond, WA) and fields checked for unlikely or impossible entries. Data fields were coded as categorical or continu-ous as appropriate and data transformations carried out for continuous data to normalize variables when necessary. Cow and farm data were combined such that relevant farm information was related to the correct cow-dry period.
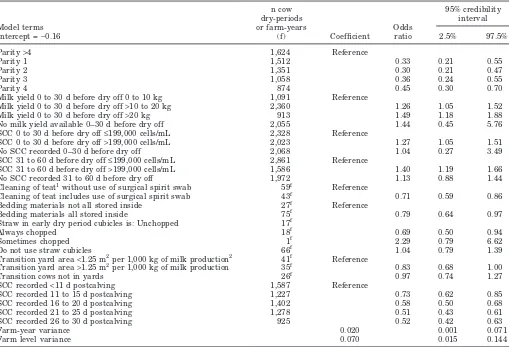
Table 2.Parameter estimates from the multilevel Bernoulli model with SCC>199,000 cells/mL within 30 d of calving as the response, for cows housed during the dry period (model 2)
n cow 95% credibility
dry-periods interval
Model terms or farm-years Odds
Intercept =−0.16 (f) Coefficient ratio 2.5% 97.5%
Parity>4 1,624 Reference
Parity 1 1,512 0.33 0.21 0.55
Parity 2 1,351 0.30 0.21 0.47
Parity 3 1,058 0.36 0.24 0.55
Parity 4 874 0.45 0.30 0.70
Milk yield 0 to 30 d before dry off 0 to 10 kg 1,091 Reference
Milk yield 0 to 30 d before dry off>10 to 20 kg 2,360 1.26 1.05 1.52
Milk yield 0 to 30 d before dry off>20 kg 913 1.49 1.18 1.88
No milk yield available 0–30 d before dry off 2,055 1.44 0.45 5.76
SCC 0 to 30 d before dry off≤199,000 cells/mL 2,328 Reference
SCC 0 to 30 d before dry off>199,000 cells/mL 2,023 1.27 1.05 1.51
No SCC recorded 0–30 d before dry off 2,068 1.04 0.27 3.49
SCC 31 to 60 d before dry off≤199,000 cells/mL 2,861 Reference
SCC 31 to 60 d before dry off>199,000 cells/mL 1,586 1.40 1.19 1.66
No SCC recorded 31 to 60 d before dry off 1,972 1.13 0.88 1.44
Cleaning of teat1without use of surgical spirit swab 59f Reference
Cleaning of teat includes use of surgical spirit swab 43f 0.71 0.59 0.86 Bedding materials not all stored inside 27f Reference
Bedding materials all stored inside 75f 0.79 0.64 0.97
Straw in early dry period cubicles is: Unchopped 17f
Always chopped 18f 0.69 0.50 0.94
Sometimes chopped 1f 2.29 0.79 6.62
Do not use straw cubicles 66f 1.04 0.79 1.39
Transition yard area<1.25 m2per 1,000 kg of milk production2 41f Reference
Transition yard area>1.25 m2per 1,000 kg of milk production 35f 0.83 0.68 1.00
Transition cows not in yards 26f 0.97 0.74 1.27
SCC recorded<11 d postcalving 1,587 Reference
SCC recorded 11 to 15 d postcalving 1,227 0.73 0.62 0.85
SCC recorded 16 to 20 d postcalving 1,402 0.58 0.50 0.68
SCC recorded 21 to 25 d postcalving 1,278 0.51 0.43 0.61
SCC recorded 26 to 30 d postcalving 925 0.52 0.42 0.63
Farm-year variance 0.020 0.001 0.071
Farm level variance 0.070 0.015 0.144
1Cleaning of teat = cleaning before administering dry cow treatments. 2Milk production = herd annual mean milk produced per cow.
whether SCC >199,000 cells/mL or not, for cow SCC within 30 d of calving. The data were hierarchical, con-sisting of an SCC associated with a calving for each cow or heifer (cow-dry period), within a 12-mo period on a farm (farm-year), within a farm. Models were tested with a structure “dry period” within “cow” within “farm”, but this provided a poorer model fit to the data and therefore was not used.
Initial analysis consisted of descriptive statistics and graphical assessments. Multilevel (random effects) models (Goldstein, 1995) were specified so that correla-tions within the data (cow-dry periods within farm-years within farms) were accounted for appropriately. Model specifications were
1. ln(SCCijk/1,000) = α+β1Xijk+β2Xjk+β3Xk
+ vk+ ujk+ eijk, vk∼ N(0,σ2v), ujk [1]
∼N(0,σ2u), eijk∼N(0,σ2e)
2. HighSCCijk∼Bernoulli (probability =πijk)
Logit (πijk) =α+β1Xijk+β2Xjk+β3Xk+ vk [2]
+ ujk, vk∼N(0,σv2), ujk∼N(0,σ2u),
where the subscripts i, j, and k denote the ith cow-dry period, the jth farm-year of study and the kth farm, respectively,αthe regression intercept, Xijkthe vector
of covariates at cow level,β1the coefficients for covari-ates Xijk, Xjkthe vector of farm-year level covariates,β2
the coefficients for covariates Xjk, Xkthe vector of farm
level covariates,β3the coefficients for covariates Xk, vk
the random effect to reflect residual variation between farms, ujkthe random effect to reflect residual variation
between farm-years, and eijkthe random effect to reflect
residual variation between cow-dry periods.
Table 3.Parameter estimates from the multilevel model with log (SCC/1,000) as the response, for cows at pasture during the dry period (model 3)
n cow 95% credibility interval
dry-periods of change in SCC
Model term or farm-years Change
Intercept = 4.72 (f) Coefficient in SCC1 2.5% 97.5%
Parity>5 1,014 Reference
Parity 1 1,966 −0.62 −51,526 −59,506 −42,781
Parity 2 1,637 −0.66 −54,002 −59,899 −47,576
Parity 3 1,224 −0.43 −38,851 −46,488 −30,489
Parity 4 945 −0.33 −31,383 −40,123 −21,401
Parity 5 639 −0.14 −14,965 −26,618 −2,090
SCC 0 to 30 d before dry off≤199,000 cells/mL 2,756 Reference
SCC 0 to 30 d before dry off>199,000 cells/mL 1,991 0.18 22,592 11,983 34,445 No SCC recorded 0 to 30 d before dry off 2,678 −0.03 −2,948 −53,253 155,889 Cleaning of teat2without use of surgical spirit swab 61f Reference
Cleaning of teat includes use of surgical spirit swab 43f −0.20 −19,928 −31,777 −5,247 Dry cows do not have access to housed lying areas while grazing 82f Reference
Dry cows do have access to housed lying areas while grazing 7f 0.34 44,934 10,862 89,737 Dry cows sometimes have access to housed lying areas while grazing 8f 0.03 3,865 −17,564 32,581 Dry cows access to housed lying areas while grazing unknown 7f 0.05 6,207 −19,057 38,337 Cows first fore-milked≤4 h after calving 7f Reference
Cows first fore-milked>4 h after calving 93f 0.10 12,231 2,840 29,714 Cows first fore-milked at a variety of times 4f 0.02 1,992 −39,202 55,167 SCC recorded<11 d postcalving 2,035 Reference
SCC recorded 11 to 15 d postcalving 1,475 −0.26 −25,905 −32,800 −18,187 SCC recorded 16 to 20 d postcalving 1,546 −0.47 −42,119 −47,788 −35,942 SCC recorded 21 to 25 d postcalving 1,313 −0.55 −47,763 −53,247 −41,951 SCC recorded 26 to 30 d postcalving 1,056 −0.45 −40,611 −47,109 −33,511
Cow-dry period variance 1.62 1.566 1.673
Farm-year variance 0.04 0.013 0.069
Farm level variance 0.04 0.008 0.076
1Change in SCC = difference to the model mean of 112,168 cells/mL. 2Cleaning of teat = cleaning before administering dry cow treatments.
350 covariates were examined individually, within the specified model framework, to investigate individual associations with SCC while accounting for the data structure. The covariates SCC at each of the 3 monthly test day readings before drying off were investigated as (logged) continuous fixed effects and also as categorical fixed effects. Exclusive categories, each increasing by 20,000 cells/mL, were examined, and a threshold SCC of>199,000 cells/mL provided the best model fit. There-fore, for model parsimony, the final models used this category only. Initial covariate assessment was carried out using MLwiN with penalized quasi-likelihood for parameter estimation (Rasbash et al., 2005). Final mod-els were selected using Markov chain Monte Carlo
(MCMC) for parameter estimation in WinBUGS
(Spie-gelhalter et al., 2004) to avoid the potential biased esti-mates that can arise from quasi-likelihood methods with binary data (Browne and Draper, 2006). Covari-ates remained in the model when the 95% credibility intervals for the odds ratios did not include 1.00. The deviance information criteria (Spiegelhalter et al., 2002), a method that takes into account improved model fit (reduction in deviance) and the increased model com-plexity (effective number of parameters), was used to inform model selection.
All of the MCMC analyses reported in this paper used a burn-in of at least 2,000 iterations during which time model convergence had occurred. Parameter estimates were based on a minimum further 8,000 iterations. In-vestigation of model fit was made from plots of residuals in the normal response models and from plots of cumu-lated fitted probabilities and residuals in the Bernoulli response models (Langford and Lewis, 1998; Green et al., 2004). Comprehensive details of MCMC modeling (Gilks et al., 1996; Spiegelhalter et al., 2004), methods adopted for this research (Green et al., 2004; Browne and Draper, 2006), and the procedures implemented for model selection (Green et al., 2007a) have been de-scribed in detail previously.
To further assess model fit and value, predictions were made of ln(SCC/1,000) within 30 d of calving, us-ing posterior predictive assessments (Gelman et al., 1996). This method uses the full model posterior pre-dictive distribution, as follows:
PREDICTED SCCijk∼N(mean = Pijk, variance =σ2e)
Pijk=α+β1Xijk+β2Xjk+β3Xk+ vk+ ujk,
where PREDICTED SCCijk is a draw from a Normal
Table 4.Parameter estimates from the multilevel Bernoulli model with SCC>199,000 cells/mL within 30 d of calving as the response, for cows at pasture during the dry period (model 4)
n cow 95% credibility
dry-periods interval
Model terms or farm-years Odds
Intercept =−0.50 (f) Coefficient ratio 2.5% 97.5%
Parity>5 1,014 Reference
Parity 1 1,966 0.29 0.22 0.37
Parity 2 1,637 0.34 0.28 0.42
Parity 3 1,224 0.47 0.39 0.57
Parity 4 945 0.60 0.49 0.74
Parity 5 639 0.71 0.57 0.89
Milk yield 0 to 30 d before dry off 0 to 10 kg 918 Reference
Milk yield 0 to 30 d before dry off>10 to 20 kg 2,625 1.27 1.04 1.54 Milk yield 0 to 30 d before dry off>20 kg 1,220 1.29 1.02 1.63 No milk yield available 0 to 30 d before dry off 2,662 1.42 0.45 4.98 SCC 0 to 30 d before dry off≤199,000 cells/mL 2,756 Reference
SCC 0 to 30 d before dry off>199,000 cells/mL 1,991 1.23 1.05 1.44
No SCC recorded 0 to 30 d before dry off 2,678 1.40 0.40 4.42
Cleaning of teat1without use of surgical spirit swab 61f Reference
Cleaning of teat includes use of surgical spirit swab 43f 0.69 0.58 0.84 Dry cows do not have access to housed lying areas while grazing 82f Reference
Dry cows do have access to housed lying areas while grazing 7f 1.63 1.18 2.23 Dry cows sometimes have access to housed lying areas while grazing 8f 1.07 0.80 1.45 Dry cows access to housed lying areas while grazing unknown 7f 0.88 0.61 1.27 Dry cow grazing is not rotated or remains without cows 85f Reference
for<4 wk during the rotation
Dry cow grazing is rotated and remains without cows 19f 0.64 0.45 0.90 for≥4 wk during the rotation
SCC recorded<11 d postcalving 2,035 Reference
SCC recorded 11 to 15 d postcalving 1,475 0.68 0.58 0.80
SCC recorded 16 to 20 d postcalving 1,546 0.57 0.48 0.68
SCC recorded 21 to 25 d postcalving 1,313 0.51 0.43 0.62
SCC recorded 26 to 30 d postcalving 1,056 0.60 0.50 0.73
Farm-year variance 0.055 0.005 0.133
Farm level variance 0.047 0.002 0.117
1Cleaning of teat = Cleaning before administering dry cow treatments.
is the ln(SCC/1,000) within 30 d of calving, for cow-dry period iin farm year jon farm k, estimated from the model parameters and data. All other parameters are described previously (equation [1]). After model conver-gence, at each iteration of the MCMC process, the
val-ues of PREDICTED SCCijkwere sampled and averaged
across each farm-year, thus providing a posterior pre-diction of the mean ln(SCC/1,000) within 30 d of calving, for individual farm-years. Posterior predictions for ln(SCC/1,000) were also made for cows of different par-ity and different SCC status at the end of the lactation prior to the dry period. Predicted mean ln(SCC/1,000) were then compared with the observed data and dis-played graphically to illustrate model performance. An equivalent approach was taken for the Bernoulli re-sponse model (SCC>199,000 cells/mL), and this method has been described in detail previously (Green et al., 2007a).
The capability of each model to identify farm-years with a high incidence of cows with an SCC >199,000 cells/mL (specified as a rate >0.2 cases per cow), was estimated by calculating the positive and negative
pre-dictive values (Dohoo et al., 2003) of the model for each outcome.
RESULTS
of cow SCC >199,000 cells/mL increased, and this is illustrated for farm-years when cows were housed or at pasture during the dry period (Figures 3 and 4). There was no clear relationship between the proportion of cow SCC >199,000 cells/mL within 30 d of calving, for cows housed and those at pasture (Figure 5).
Models of Somatic Cell Counts
The final models are presented in Tables 1 to 4. Three cow-level covariates were associated with an increased SCC in all models: parity, an SCC >199,000 cells/mL in the last 60 d of the previous lactation, and fewer DIM after calving at the time of the SCC recording. An increased milk yield before drying off was associated with increased SCC after calving in 3 of the 4 models. At farm level, factors associated with changes in SCC could be classified according to the timing of the event: factors at drying off, in the early dry period, in the late (transition) dry period, and in the calving period. An illustration of the main significant risk factors that summarize all models is provided in Figure 6. No sig-nificant effect on SCC in early lactation was identified between different classes of antibiotic dry cow therapy or between antibiotic therapy and internal teat sealants.
Model Predictions
The farm-year posterior predictions for mean ln (SCC/1,000) and proportion of cows with SCC>199,000 cells/mL were good (Figures 7 to 10). These predictions explained over 74% of the variability in the observed farm-year level data in each model. Similarly, posterior predictions for ln (SCC/1,000) for cows of different par-ity and SCC status (Figures 11 and 12) displayed a good fit to the observed data, with the observed mean SCC for each group being well within the 95% credibil-ity interval of the posterior predicted mean SCC.
The positive and negative predictive values for identi-fying farm-years with an incidence rate of cow SCC> 199,000 cells/mL of>0.2 cases per cow, when cows were housed during the dry period, were 81.3 and 90.1%, respectively. The equivalent positive and negative pre-dictive values for farm-years when cows were at pasture were 85.9 and 90.0%.
DISCUSSION
This is the second recent UK study to investigate cow characteristics, farm facilities, and herd management strategies during the dry period in relation to mammary gland health in the next lactation (Green et al., 2007a). There are broad similarities but also some differences
between the previous study of clinical mastitis and the current study of SCC. The general conclusion that both cow and herd factors through the dry period are im-portant in determining mammary gland health early in the next lactation can be drawn from both studies. In both cases, significant factors were identified at dry-ing off, in the early and late dry period, and at calvdry-ing. Previous research focusing on parity-one cows has also identified management factors that influence SCC after calving although these included aspects of feeding, housing, herd prevalence of high SCC cows, and herd milk yield that were different to significant covariates identified in this study (De Vliegher et al., 2004b; Svens-son et al., 2006). This suggests that management strate-gies important for determining SCC after calving may vary between different populations, and it may there-fore be important to undertake this type of research in different countries or environments.
In addition to parity and SCC in the previous lacta-tion, cow characteristics associated with an increased SCC after calving in this study were increased milk yield in the 30 d before drying off and reduced length of time from calving to SCC estimation. These associa-tions have been reported previously (Barkema et al., 1999; Ostera˚s and Edge, 2000; Rajala-Schultz et al., 2005; Whist and Ostera˚s, 2006), although interestingly increased milk yield before drying off was not identified as a significant risk factor when clinical mastitis was investigated in these herds (Green et al., 2007a). Reduc-ing cow milk yield by reducReduc-ing the plane of nutrition in the weeks before drying off currently appears to be a pragmatic recommendation, and in this study a yield below 10 kg was associated with lowest SCC in the subsequent lactation. The reason an SCC >199,000 cells/mL before drying off increased the risk of a raised SCC in the subsequent lactation is likely to be because some existing infections are not cured during the dry period or because a high SCC is a marker for a suscepti-ble cow.
Figure 6.Summary of the major cow, farm and management factors associated with reduced SCC in the first 30 d of lactation.
entry to the mammary gland during application of a treatment.
It is noteworthy that no particular types or regimens of dry cow treatment used in a herd, whether antibiotic therapies or internal teat sealants, were associated
Figure 7.Correlation between model posterior prediction and the observed proportion of cows with SCC>199,000 cells/mL in the first 30 d of lactation, for the 102 farm-years with cattle housed during the dry period (R2= 74.1%).
the first 30 d of lactation was relatively high (>0.2 cases per cow), and this was despite the use of dry cow treat-ments in virtually all cows (of parity greater than 1). This suggests that aspects of management other than the dry cow product are important in determining SCC in the first 30 d of lactation. There were insufficient numbers of cows that received no dry cow treatment for the effect of no treatment to be evaluated.
[image:10.612.113.535.77.239.2]Reduced stocking density during housing and in-creased rest of pasture between grazing periods were associated with reduced SCC after calving. A possible reason for this is reduced bacterial contamination of the environment and thus reduced exposure of cows to pathogens. Stocking density for cows housed in straw
Figure 8.Correlation between model posterior prediction and the
observed herd mean ln (SCC/1,000), in the first 30 d of lactation, for the 102 farm-years when cattle were housed during the dry period (R2= 87.0%).
Figure 9.Correlation between model posterior prediction and the
observed proportion of cows with SCC>199,000 cells/mL in the first 30 d of lactation, for the 104 farm-years with cattle at pasture during the dry period (R2= 75.2%).
yards in the United Kingdom is often recommended to be 6 to 8 m2lying area per cow. Results of this study suggest that increasing this allowance may be benefi-cial for mastitis control with 10 m2per cow (for herds
with a mean annual milk yield per cow of 8,000 kg) or
12.5 m2 per cow (for herds with a mean annual milk
yield per cow of 10,000 kg) being an appropriate space allowance.
Two cow characteristics (parity and SCC in the previ-ous lactation) and 2 herd management factors (rotation of dry cow pasture and the time after calving until cows were first fore-milked) that were found to be significant predictors for raised SCC were also identified as sig-nificant factors for clinical mastitis in the previous
Figure 10.Correlation between model posterior prediction and
[image:10.612.40.550.507.675.2]Figure 11.Model posterior predictions and observed data for mean ln (SCC/1,000), in the first 30 d of lactation, for groups of cows of different parity, which were housed during the dry period. Low SCC refers to cows with no SCC>199,000 cells/mL 0 to 60 d before dry off and high SCC refers to cows with at least one SCC>199,000 cells/ mL 0–60 d before dry off.
study on these herds (Green et al., 2007a). The reason for a reduced time after calving until cows were first fore-milked (milk stripped and checked manually by a herdsperson) being protective is uncertain. A possible explanation could be a flushing effect, pathogens being removed by fore-stripping before an infection estab-lishes. The other specific determinants identified for raised SCC were different to those previously reported for clinical mastitis. For instance, significant predictors
Figure 12.Model posterior predictions and observed data for mean
ln (SCC/1,000), in the first 30 d of lactation, for groups of cows of different parity, which were at pasture during the dry period. Low SCC refers to cows with no SCC>199,000 cells/mL 0 to 60 d before dry off and high SCC refers to cows with at least one SCC>199,000 cells/mL 0 to 60 d before dry off.
of clinical mastitis not found to be associated with raised SCC were the approach to dry cow treatments (individual cow as opposed to whole herd), the use of a Leptosporosis vaccine, and nutrition-related factors such as body condition scores and method of forage provision. Differences in dry period determinants for clinical mastitis and SCC may reflect different causal pathways involved, such as different pathogen involve-ment or a different influence of cow immune status. To optimize mammary gland health, determinants for both clinical mastitis and SCC need to be addressed on an individual unit.
There was considerable variation in the length of dry period among the cows in this study (mean = 65.9 d, median = 59.0 d, interquartile range = 51 to 71 d), but it is of interest that the length of dry period was not found to be associated with changes in SCC after calv-ing [nor previously with the occurrence of clinical masti-tis after calving (Green et al., 2007a)]. There has been recent interest in reducing the length of the dry period (Gumen et al., 2005; Rastani et al., 2005), but this re-search suggests that, in terms of mammary gland health, herd management and cow factors are more important than the length of the dry period.
The residual plots and posterior predictions of SCC made from the final models indicated that model fit was good. Posterior predictions are a useful technique to assessment model fit and validity and are easily imple-mented in a Bayesian framework (Gelman et al., 1996). Residual (unexplained) variation in the Normal re-sponse models was greatest at cow-dry period level and relatively small at farm-year and farm level. Thus, whereas predictions from the models were accurate for the mean SCC of groups of cows (for example across farm-years or for different parities), they were less good for individual cows. This phenomenon has been re-ported previously using similar statistical models of SCC in parity one cows after calving (De Vliegher, 2004b). Predictions on an individual cow basis are nec-essarily complex and would need to incorporate individ-ual cow components such as genetic, environmental, and immune information and these are often unknown or difficult to specify. For example, within a generally poor farm environment, a high proportion of cows may get an IMI, but it is difficult to determine which cows use the environment in a way that may increase their individual risk of infection. However, in this research, the aim was to predict an overall risk for cows within a herd so as to identify aspects of management that could improve prevention.
[image:11.612.61.311.469.656.2]can assess their own areas of risk and make appropriate changes. Herds with a relatively high incidence of clini-cal mastitis or cows with SCC>199,000 cell/mL within 30 d of calving have considerable scope for improvement
through application of appropriate management
practices.
CONCLUSIONS
Combinations of cow characteristics, farm facilities, and herd management strategies during the dry period were associated with an increased SCC in early lacta-tion. The research indicated that dry period manage-ment influences SCC in the next lactation and has high-lighted areas important for mastitis control.
ACKNOWLEDGMENTS
This research was funded by the Wellcome Trust; Martin Green is a Wellcome Trust Intermediate Clini-cal Fellow. We would like to thank the Milk Develop-ment Council for funding the initial research and NMR for providing data. We are also very grateful to Laura Green (Univ. Warwick), James Breen (Univ. Bristol), and Katharine Leach (Univ. Bristol) who were involved with data collection, James Booth (Milk Development Council) for his support, and all the farmers and their veterinary surgeons for their participation and coop-eration.
REFERENCES
Barkema, H. W., H. A. Deluyker, Y. H. Schukken, and T. J. Lam. 1999. Quarter-milk somatic cell count at calving and at the first six milkings after calving. Prev. Vet. Med. 38:1–9.
Barnouin, J., M. Chassagne, S. Bazin, and D. Boichard. 2004. Man-agement practices from questionnaire surveys in herds with very low somatic cell score through a national mastitis program in France. J. Dairy Sci. 87:3989–3999.
Bradley, A. J., and M. J. Green. 2005. Use and interpretation of somatic cell count data in dairy cows. In Pract. 27:310–315. Bradley, A. J., M. J. Green, and J. N. Huxley. 2002. Making better
use of milk samples: Monitoring and investigating herd mastitis. Cattle Pract. 10:105–112.
Brolund, L. 1985. Cell counts in bovine milk. Causes of variation and applicability for diagnosis of subclinical mastitis. Acta Vet. Scand. 80:1–123.
Browne, W. J., and D. Draper. 2006. A comparison of Bayesian and likelihood-based methods for fitting multilevel models. Bayesian Analysis 1:473–514.
Cook, N. B., T. B. Bennett, K. M. Emery, and K. V. Nordlund. 2002. Monitoring nonlactating cow intramammary infection dynamics using DHI somatic cell count data. J. Dairy Sci. 85:1119–1126. De Vliegher, S., H. W. Barkema, G. Opsomer, A. de Kruif, and L.
Duchateau. 2005a. Association between somatic cell count in early lactation and culling of dairy heifers using Cox frailty mod-els. J. Dairy Sci. 88:560–568.
De Vliegher, S., H. W. Barkema, H. Stryhn, G. Opsomer, and A. de Kruif. 2004a. Impact of early lactation somatic cell count in heifers on somatic cell counts over the first lactation. J. Dairy Sci. 87:3672–3682.
De Vliegher, S., H. W. Barkema, H. Stryhn, G. Opsomer, and A. de Kruif. 2005b. Impact of early lactation somatic cell count in heifers on milk yield over the first lactation. J. Dairy Sci. 88:938–947. De Vliegher, S., H. Laevens, H. W. Barkema, I. R. Dohoo, H. Stryhn,
and G. Opsomer. 2004b. Management practices and heifer charac-teristics associated with early lactation somatic cell count of Bel-gian dairy heifers. J. Dairy Sci. 87:937–947.
Dingwell, R. T., K. E. Leslie, Y. H. Schukken, J. M. Sargeant, L. L. Timms, T. F. Duffield, G. P. Keefe, D. F. Kelton, K. D. Lissemore, and J. Conklin. 2004. Association of cow and quarter-level factors at drying-off with new intramammary infections during the dry period. Prev. Vet. Med. 63:75–89.
Dohoo, I. R., and K. E. Leslie. 1991. Evaluation of changes in somatic cell counts as indicators of new intramammary infections. Prev. Vet. Med. 10:225–237.
Dohoo, I. R., W. Martin, and H. Stryhn. 2003. Veterinary Epidemio-logic Research. AVC Inc., Charlottetown, Canada.
Dohoo, I. R., and A. H. Meek. 1982. Somatic cell counts in bovine milk. Can. Vet. J. 23:119–125.
Gelman, A., X. L. Meng, and H. Stern. 1996. Posterior predictive assessment of model fitness via realized discrepancies. Stat. Sin-ica 6:733–807.
Gilks, W. R., S. Richardson, and D. J. Spiegelhalter. 1996. Markov Chain Monte Carlo in Practice. Chapman and Hall, London, UK. Goldstein, H. 1995. Multilevel Statistical Models. 2nd ed. Edward
Arnold, London, UK.
Green, M. J., A. J. Bradley, G. F. Medley, and W. J. Browne. 2007a. Cow, farm and management factors during the dry period that determine the rate of clinical mastitis after calving. J. Dairy Sci. 90:3764–3776.
Green, M. J., A. J. Bradley, H. Newton, and W. J. Browne. 2006. Seasonal variation of bulk milk somatic cell counts in UK dairy herds: Investigations of the summer rise. Prev. Vet. Med. 74:293–308.
Green, M. J., P. R. Burton, L. E. Green, Y. H. Schukken, A. J. Bradley, E. J. Peeler, and G. F. Medley. 2004. The use of Markov chain Monte Carlo for analysis of correlated binary data: Patterns of somatic cells in milk and the risk of clinical mastitis in dairy cows. Prev. Vet. Med. 64:157–174.
Green, M. J., L. E. Green, A. J. Bradley, P. R. Burton, Y. H. Schukken, and G. F. Medley. 2005. Bacterial isolates in the dry bovine mam-mary gland. Prevalence and Associations. Vet. Rec. 156:71–77. Green, M. J., K. A. Leach, J. E. Breen, L. E. Green, and A. J. Bradley.
2007b. A national intervention study of mastitis control on dairy herds in England and Wales. Vet. Rec. 160:287–293.
Gumen, A., R. R. Rastani, R. R. Grummer, and M. C. Wiltbank. 2005. Reduced dry periods and varying prepartum diets alter postpartum ovulation and reproductive measures. J. Dairy Sci. 88:2401–2411.
Huijps, K., and H. Hogeveen. 2007. Stochastic modeling to determine the economic effects of blanket, selective, and no dry cow therapy. J. Dairy Sci. 90:1225–1234.
Laevens, H., H. Deluker, Y. H. Schukken, L. de Meulemeester, R. Vandermeersch, E. de Muelenaere, and A. de Kruif. 1997. Influ-ence of parity and stage of lactation on the somatic cell count in bacteriologically negative dairy cows. J. Dairy Sci. 80:3219–3226. Langford, I. H., and T. Lewis. 1998. Outliers in Multilevel Data. J.
R. Stat. Soc. A 161:121–160.
Lievaart, J. J., H. W. Barkema, W. D. Kremer, J. van den Broek, J. H. Verheijden, and J. A. Heesterbeek. 2007. Effect of herd characteristics, management practices, and season on different categories of the herd somatic cell count. J. Dairy Sci. 90:4137– 4144.
McDermott, M. P., H. N. Erb, and R. P. Natzke. 1982. Predictability by somatic cell counts related to prevalence of intramammary infection within herds. J. Dairy Sci. 65:1535–1539.
Ostera˚s, O., and V. L. Edge. 2000. Factors prior to dry period associ-ated with high and low levels of cow milk somatic cell counts in next lactation. Acta Vet. Scand. 41:63–77.
Rajala-Schultz, P. J., J. S. Hogan, and K. L. Smith. 2005. Association between milk yield at dry-off and probability of intramammary infections at calving. J. Dairy Sci. 88:577–579.
Rasbash, J., W. J. Browne, M. Healy, B. Cameron, and C. Charlton. 2005. MLwiN Version 2.02. Mulilevel Models Project, Institute of Education, London, UK.
Rastani, R. R., R. R. Grummer, S. J. Bertics, A. Gumen, M. C. Wilt-bank, D. G. Mashek, and M. C. Schwab. 2005. Reducing dry period length to simplify feeding transition cows: Milk production, energy balance, and metabolic profiles. J. Dairy Sci. 88:1004– 1014.
Schepers, A. J., T. J. Lam, Y. H. Schukken, J. B. Wilmink, and W. J. Hanekamp. 1997. Estimation of variance components for somatic cell counts to determine thresholds for uninfected quar-ters. J. Dairy Sci. 80:1833–1840.
Schukken, Y. H., D. J. Wilson, F. Welcome, L. Garrison-Tikofsky, and R. N. Gonzalez. 2003. Monitoring udder health and milk quality using somatic cell counts. J. Dairy Sci. 34:579–596.
Sordillo, L. M., K. Shafer-Weaver, and D. DeRosa. 1997. Immunobiol-ogy of the mammary gland. J. Dairy Sci. 80:1851–1865. Spiegelhalter, D. J., N. G. Best, B. P. Carlin, and A. van der Linde.
2002. Bayesian measures of model complexity and fit (with discus-sion). J. R. Stat. Soc. Ser. B Stat. Methodol. 64:583–640. Spiegelhalter, D. J., A. Thomas, and N. Best. 2004. WinBUGS Version
1.4.1. MRC Biostatistics Unit, Cambridge, UK.
Svensson, C., A. K. Nyman, K. Persson Waller, and U. Emanuelson. 2006. Effects of housing, management, and health of dairy heifers on first-lactation udder health in southwest Sweden. J. Dairy Sci. 89:1990–1999.
Wenz, J. R., S. M. Jensen, J. E. Lombard, B. A. Wagner, and R. P. Dinsmore. 2007. Herd management practices and their associa-tion with bulk tank somatic cell count on United States dairy operations. J. Dairy Sci. 90:3652–3659.