Jeeves – A Visual Programming Environment for
Mobile Experience Sampling
Daniel Rough
SACHI Research Group School of Computer Science University of St Andrews, UKAaron Quigley
SACHI Research Group School of Computer Science University of St Andrews, UKAbstract—The Experience Sampling Method (ESM) captures participants’ thoughts and feelings in their everyday environ-ments. Mobile and wearable technologies afford us opportunities to reach people using ESM in varying contexts. However, a lack of programming knowledge often hinders researchers in creating ESM applications. In practice, they rely on specialised tools for app creation. Our initial review of these tools indicates that most are expensive commercial services, and none utilise the full potential of sensors for creating context-aware applications. We present “Jeeves”, a visual language to facilitate ESM application creation. Inspired by successful visual languages in literature, our block-based notation enables researchers to visually construct ESM study specifications. We demonstrate its applicability by replicating existing ESM studies found in medical and psychology literature. Our preliminary study with 20 participants demon-strates that both non-programmers and programmers are able to successfully utilise Jeeves. We discuss future work in extending Jeeves with alternative mobile technologies.
I. INTRODUCTION
The Experience Sampling Method (ESM), also defined as Ecological Momentary Assessment (EMA), has long been used by researchers in the fields of psychology and medicine to collect information on study participants or patients “in the field”, that is, outside the constraints of a laboratory setting [1]. By gathering people’s data as they go about their everyday lives, results have a higher ecological validity and eliminate the bias resulting from unfamiliar environments, as well as the recall issues caused by collecting data in retrospect of an im-portant event or situation. Traditionally, ESM studies have been conducted using an external signalling device (such as a pager or pre-programmed electronic watch) coupled with paper-based forms for participants to fill out when the device emits a signal [2]. This cumbersome and unreliable approach has been greatly improved upon in recent years, where researchers have recognised the potential of mobile applications for conducting these types of studies with participants [3], [4], [5]. Along with this, in the field of Human Computer Interaction (HCI) study applications have been developed which allow both the signalling and data collection to take place on a participant’s personal device. MyExperience [6] and EmotionSense [7] are two pertinent examples, which also collect data from mobile phone sensors to enable context-aware ESM applications.
Despite the potential of tools to assist programmers in creating context-aware ESM applications, a lack of program-ming experience remains a major barrier to researchers in
fields such as psychology and medicine, where these ap-plications would be of greatest use. MyExperience requires researchers to configure applications by providing XML files which may include complex embedded scripts. The researchers behind EmotionSense have provided open-source libraries for facilitating the creation of ESM applications, but utilising these libraries still requires Android programming experience. Instead, non-programmers must invest in commercial software or hardware [3], [4], [5], hire professional developers [8], employ manual methods such as telephoning participants [9] or simply resort to providing paper-based logs [2], [10].
End-user programming is a research area where the focus is on introducing software development into the hands of its prospective users, rather than professional programmers. However, the syntax and semantics of general-purpose, high level programming languages, such as C or Java, can have a steep learning curve. Visual programming is a research topic that addresses this issue, encompassing applications that are implemented through combining graphical components, instead of code. Visual programming environments (VPEs) exist for various end-users and goals, including beginner-level environments for teaching students to program [11], and professional development environments for engineers develop-ing control systems [12]. To our knowledge, no such visual language or environment has been created for researchers who wish to create context-aware mobile applications such as ESM studies. In this paper, we therefore make the following contributions:
1) A survey of the current state-of-the-art in ESM study creation applications and tools.
2) A presentation of Jeeves, a visual language for facil-itating ESM study creation.
3) A feasibility study of Jeeves, conducted with 20 participants, with varying programming experience.
II. BACKGROUNDREVIEW
Tool name UI Inter val
trigger
Sensor trigger
Sensor logging
User tailor
ed
Dynamic update
Branch logic
Free Open
movisensXS Visual
language X X X X
PIEL Text
file X X X
LifeData Forms X X X
mEMA Forms X X X X X
iPromptU Within
app X X
MetricWire Forms X L X X X
Ohmage XML
file
L X X X X
[image:2.612.59.293.56.319.2]PACO Forms X A X X X X
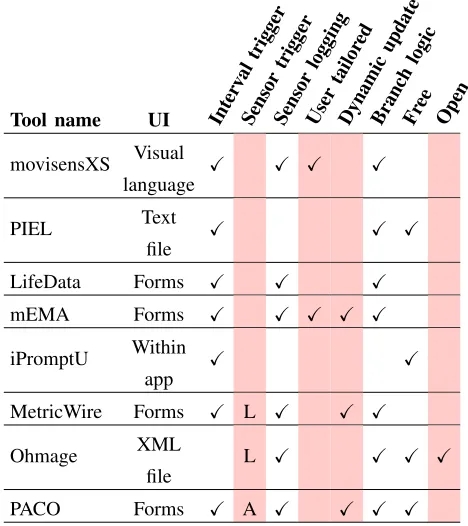
TABLE I: Features of ESM-focused apps currently available on the iTunes App Store or Google Play Store in the UK (L=Location-based trigger, A=Trigger based on app usage)
participants’ mobile devices. We selected systems, which have apps that are currently available on the iTunes UK store or the Google Play store, and are thus considered to be the current state-of-the-art for iOS and Android app development. Additionally, numerous applications exist for creating one-off surveys, with no focus on ESM, and were not considered for this comparison. Applications that run on bespoke or outdated hardware were also not considered. In total, eight tools were surveyed and their key properties and features are summarised in Table I.
MovisensXS [13] has the most advanced specification user interface, with a flowchart-based visual language for cus-tomising study schedules. Four of the reviewed applications, LifeData [14], mEMA [15], MetricWire [16] and Paco [17], allow developers to create both the surveys and the distribution schedules in similar forms-based interfaces, and these surveys are then assigned to one or more schedules. Another alternative interface employed by the PIEL [18] and Ohmage [19] tools, is a configuration file written by the end-user. This file contains the surveys and schedules in a textual representation, corre-sponding to some syntactic rules, similar to the approach used in MyExperience. Finally, iPromptU [20] has the survey and schedule specification interface within the application itself.
While it’s clear from Table I that there are some sophis-ticated tools and applications for researchers, there are also clear deficiencies which we now detail.
1) Lack of free and open software: Applications that offer more sophisticated functionality are commercial software that require considerable financial investment from researchers. This can be an issue if the proposed studies are large or if
the functionality required goes beyond what is provided in cheaper versions of the software.
2) Lack of sensor utilisation: MetricWire and Ohmage offer the possibility of triggering based on location, and Paco can trigger surveys contingent on basic application usage. However, none of these applications are making use of the rich variety of sensors and participant information available through the current generation of mobile devices. Omitting this functionality is sacrificing valuable contextual information.
3) Lack of support for collaboration: Despite claims to support academic research, none of the reviewed applications allow simple sharing of ESM applications between researchers, which would encourage collaboration, enabling simple study replication or improvement on existing studies.
4) Lack of participant customisation: Few tools offer a means to tailor apps based on an individual’s characteristics and preferences. For example, it may be desirable to only begin sending surveys after a participant’s pre-defined wake-up time, which would undoubtedly reduce study attrition. Instead, studies deployed to a group tend to be “one-size-fits-all”, and do not take into account individuals’ characteristics. The importance of survey timing depending on participant characteristics was highlighted in additional work by Lathia et. al [21]. They showed that a response bias caused by simplistic trigger design gives rise tocontextual dissonance. They explain that trigger design will “affect the responses that are collected and indeed paint differing pictures of participants’ moods, locations, and social settings”.
From Table I, it would appear that PACO offers a feature-rich application for no monetary investment. However, it is limited to only allowing one survey and one trigger type within an application. Ohmage’s triggering is very limited, and can only be specified from the client-side application, so remote distribution of trigger-based sampling is not possible. In summary, these four areas of deficiency call for further research into providing functionality for creating customised, sensor-augmented studies, without compromising usability.
III. OUR SOLUTION: JEEVES
A number of factors influenced our initial design, including previous successful visual languages, scientific theories of visual notation, and domain-specific features of the Experience Sampling Method. This section summarises the main influ-ences, as well as the current features of the Jeeves environment.
A. Influences
for creating domain-specific languages for ESM applications, where adding functionality to, for example, send a survey every hour between 9am and 5pm, or when the participant receives an SMS, could be as simple as fitting two blocks together. This would provide an immediate entry point for researchers into creating potentially highly complex applications, and inspired us to create our visual environment with a similar notation.
2) Structure of EmotionSense libraries: The featured com-ponents of our language, namely sensors, triggers and actions were directly influenced by the structure of the EmotionSense libraries (see [24] for a full description). These libraries were designed for the purpose of facilitating creation of social sensing applications, and so their functionality is largely based on requirements drawn from ESM literature. The libraries provide a simple API for configuring the sampling intervals and sampling duration of Android smartphone sensors, which can be dynamically updated by periodically downloading a JSON configuration file from a remote server. The libraries implement time and sensor-initiated “triggers”, which allow actions to be taken at given times of the day, or on given values returned from polled sensors. Further constraint-based logic can be imposed on trigger timings through a stored set of participant preferences.
3) Physics of Notations: Moody defines nine principles for the design of visual notations that are “optimised for human understanding and problem solving”, titled the Physics of No-tations [25]. These were developed in response to a lack of an empirical basis for the evaluation of visual languages. Moody’s principles are based on empirical evidence and theory, and serve as both an evaluation framework for existing languages, as well as clear guidelines for developing new languages. One such example, which has informed our work, is the Principle of Perceptual Discriminability, which states that “Different symbols should be clearly distinguishable from each other”. The other principles are similarly explicit, concise and directly relevant to visual notations such as our environment, which is described in the following section.
B. Features and Implementation of Jeeves
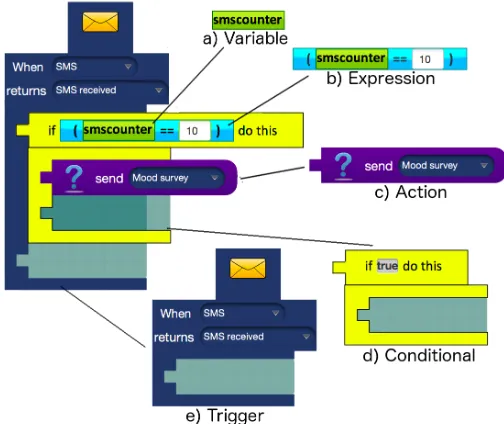
Our VPE is entitled “Jeeves” (JavaEnd-UserEnvironment for Visual Experience Sampling). Components of Jeeves are primarily represented by graphical primitives, which can be dragged from menus in a sidebar onto a “canvas” pane. As in other block-based languages, syntax is automatically dealt with by allowing components to be nested within each other, in combinations that adhere to the visual grammar of the language, as illustrated in Fig. 1. By nesting and combining components, an end-user specifies the behaviour of an ESM application, and these combinations of components can addi-tionally be saved to a library of custom combinations for reuse in other applications. The sidebar containing these components is shown in Fig. 2.
[image:3.612.317.569.56.268.2]1) Triggers: Triggers (Fig. 1e) define the condition under which to execute particular Actions. They are broadly divided into “time-based” and “sensor-based” Triggers, with additional domain-specific Triggers based on a participant’s answer to a survey question, or whether a survey itself was completed or ignored. They contain a receiver pane into which Actions can be dropped.
Fig. 1: An example nesting of all different component types, with the labeled type of each component
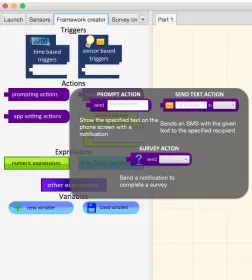
2) Actions: Actions (Fig. 1c) abstract over functions that the application can perform, and are broadly divided into three categories. “Prompting Actions” are those which com-municate with a participant, or the contacts in a participant’s phone/email directory, “App settings Actions” are used to dy-namically change the sensing configuration of the application, and “Phone settings Actions” passively update settings on the participant’s device, such as display brightness. These Actions are nested in the receiving panes of Triggers and are executed as a sequence.
3) Conditionals: Conditionals (Fig. 1d) are visual compo-nents which act like Actions in that they are nested within Triggers, but also contain a receiving pane for nesting ad-ditional Actions. The current three Conad-ditionals in Jeeves are analogous to if-then statements, for loops, and do-while loops found in imperative programming languages, and the Actions within them are executed once, multiple times, or never, depending on whether the component’s condition holds true.
4) Variables and Expressions: Jeeves supports Boolean and numeric data types, which are represented by “Variable” primitives (Fig. 1a), a means of representing permanent and temporal information about a participant that maps conceptu-ally to variables in imperative textual languages. Expressions (Fig. 1b) also have a data type, which have panes for receiving two Variables, and output either a Boolean or numeric result. For example, a numeric “Add” Expression takes two numeric Variables or values, and outputs a numeric value. Expressions can be nested to create more complex Expressions.
Fig. 2: The “Framework creator” sidebar of Jeeves, showing the expanded submenu of the “prompting actions” group
5) Sensors: A mobile sensor is visualised as an information pane containing a representative image, its enabled/disabled status, and its sampling duration and interval where relevant. The sensing configuration of an application can be adjusted directly from these panes as shown in Fig. 3, allowing an end-user to collect all necessary information, while minimising drain on the battery.
Fig. 3: Screenshot of the “Sensors” pane, with the end-user adjusting the Gyroscope sensor configuration
6) Surveys: Surveys are a key feature of ESM studies and can be created in the Jeeves environment. Guided by ESM literature, response types can be open-ended, multiple choice, or along a numeric Likert-like scale. Additionally, basic conditional logic allows a question to be presented if
a previous question was given a particular answer.
C. Architecture/Implementation
We briefly touch on the system architecture to justify the choice of languages and frameworks used.
1) JavaFX: The end-user interface is implemented in Java using the JavaFX API. This provides a number of graphical features to support similar appearance and functionality of other block-based programming languages. Open libraries such as Blockly [26] exist for this purpose, but restrict the potential for graphical customisation. Instead, we opted to implement the Jeeves language from the ground up, to allow flexibility as the language develops.
2) JSON/MongoDB: Each component of the language has a JSON representation. This allows entire applications to be stored as JSON objects, independent of the client-side appli-cation that runs them. All saved appliappli-cations and end-user-defined component combinations are stored in a MongoDB database. MongoDB allows simple, flexible storage of JSON objects, and a key advantage of storing this information in a central repository is that other applications, surveys or complex components can be shared, recycled and augmented by other end-users with similar requirements for their own ESM studies. This idea has been inspired by Scratch’s highly successful online community, in which end-users can share their work with each other.
3) EmotionSense Libraries: The current version of Jeeves includes a front-end client application, which is programmed in Android and makes use of the EmotionSense libraries. The libraries distinguish between “pull” sensors (those that can be sampled at any time) and “push” sensors (those that only return values on events, such as an SMS being received). The Sensor, Trigger and Action configurations of an application are acquired from the JSON application specification created in Jeeves, which is periodically downloaded from our remote server.
IV. USE CASE
To demonstrate the Jeeves language’s utility as a proof-of-concept, we recreated experience sampling applications from both psychology and medical research journals. Kramer et. al [5] describe their ESM study as follows:
PsyMate was programmed to emit a beep 10 times per day at random intervals in each of ten 90-min time blocks between 7.30 and 22.30.
A Jeeves specification for such a study is shown in Fig. 4. The left side of this figure shows the canvas with a “Random Trigger” set to fire a survey within every 90-minute window from 7.30 to 22.30. Also, the right side of the figure shows a snapshot of the Survey creator pane. Kramer et. al explained that their survey assessed various affects of the participant on a Likert scale of 1 to 7. The state of this pane shows how such a question can be specified in Jeeves.
A more complex example is described in a study by Steptoe and Wardle [2]:
[image:4.612.49.301.477.618.2](a) Random survey triggering (b) Likert scale survey question
Fig. 4: Replication of the ESM study from Kramer et. al [5] (left) as a visual specification and an example question in the “Survey creator” pane (right)
Fig. 5: Example specification for the ESM study in Steptoe and Wardle [2]
The specification for this study is shown in Fig. 5. The left Trigger is fired when the screen is activated. The context of whether a participant is meant to be asleep or not is stored in the Boolean Variable “UserWokenUp”. The idea behind this is that a unique participant variable can be set based on a sensor value. In this case, the participant has “woken up” when the smartphone’s screen is interacted with.
V. EVALUATION
In order to evaluate the usability of the Jeeves environment, and the feasibility of developing it further for use by non-programmers, we conducted a preliminary user study. Our aim was to acquire qualitative usability feedback, and to quantitatively test three hypotheses:
• H1: There would be no significant difference in the us-ability scores of programmers and non-programmers.
• H2: Non-programmers would not make significantly more errors than programmers in performing the tasks.
• H3: Non-programmers would not take significantly more time than programmers in completing the tasks.
A. Pilot study
A pilot study was conducted with three HCI researchers in the computer science department, to highlight any flaws in the original study script. This proved valuable as our initial script consisted of three step-by-step guides, and it was pointed out that this script, even if fully completed, only assessed the usability of the environment and not the understandability or readability of the language itself. The script was subsequently adapted and will be described fully in this section.
B. Participants
We recruited 20 student participants from the university by convenience sampling (age range 19-34). 11 had prior expe-rience of programming, with self-assessed confidence varying from beginner to advanced. All programming participants had at least basic experience with imperative languages such as Java, Python and MATLAB. The other nine participants had no prior programming experience. Participants studied a wide range of subjects, including computer science, physics, chem-istry, history, English, management and international relations. The environment was introduced as a tool to create self-monitoring apps. As the ESM was not mentioned, participants’ subject of study has no relevance to real-world usage.
C. Procedure
Participants first completed an introductory questionnaire to obtain demographic information, programming experience and general usage of technology. They were then given an in-troduction booklet explaining the components of the language, and allowed a maximum of 10 minutes to read through this and familiarise themselves with the user interface. They were then issued a script explaining four tasks described in the next section. Participants were given a maximum of 30 minutes to work through this script. Finally, participants completed the System Usability Scale questionnaire, and additional feedback was acquired through the audio recording of informal discus-sion. All participants were then debriefed and compensated with a £5 Amazon voucher for their participation.
D. Tasks
The tasks presented to the participants were as follows:1
Task 1, Step-by-step guide – The purpose of this task was to familiarise participants with the layout of the environ-ment, while isolating issues associated with the control and navigation, thus no issues in language comprehension were highlighted. Instead the task was designed to ensure coverage of all testable features of the environment.
Task 2, Reading and explaining– This task was to assess the readability and comprehensibility of the Jeeves language itself, irrespective of the environment. Being able to read and comprehend a program is necessary to promote collaboration between researchers wishing to replicate or refine studies cre-ated by others, and was a primary motivating factor in choosing a visual language representation. In this task, participants loaded a pre-created application and wrote down what they
[image:5.612.49.301.272.432.2]thought its function was.
Task 3, Modification– This task asked participants to aug-ment the Task 2 application with two additional features from high-level descriptions. This also assessed Jeeves’s feasibility for real-world usage: given that a researcher has specific design goals in mind, how simple is it for them to implement these goals using Jeeves? This task took into account the usability of both the environment and the language.
Task 4, Design – This task asked participants to design and create an application from scratch, based on a paragraph describing a use-case scenario. This task also assessed the ease in which a design goal could be implemented using the language and its environment, but with a more abstract description, and no prior implementation given.
VI. RESULTS
In order to test our hypotheses and the general usability of Jeeves, we performed quantitative and qualitative analysis.
A. Quantitative results
We collected errors made, time taken, and System Usabil-ity Scale scores, to test each of our three hypotheses, per-forming independent t-tests between programming participants and non-programming participants with the SPSS statistical analysis software package. Task 4 (the design task) was not included in the analysis of time taken or errors made, as some participants did not complete this task in the allotted study time.
1) Usability: The System Usability Scale (SUS) is often called a “quick and dirty” means of evaluating a product, and consists of a simple 10-item Likert scale questionnaire, which has been shown to be reliable in hundreds of usability studies [27]. See Table II for the ten questions. In our study, programmers and non-programmers reported numerically sim-ilar scores (M = 71.8, SD= 10.7for programmers, andM = 67.2, SD= 13.9for non-programmers). An independent sam-ples t-test also showed that there was no significant difference in usability between the two groups,t(18) = 0.838, p= 0.413, so we can accept our first hypothesis. Although SUS scores are not normally distributed (in which case the Friedman test would be appropriate), the sample mean of each group, which was tested as the dependent variable, is normally distributed, so the t-test is valid. Given that a previous survey computed the mean SUS score across over 2000 studies to be 69.7 [28], and an acceptable usability score is considered to be 70 or above, this result suggests that the system is of average usability to even those with no programming knowledge. Results are shown in Fig. 6. In calculating the overall score out of 100, each answer is converted to a score from 0-4 as shown in the chart. Converting the values to a score out of 100 allows normalisation of the data. These scores are inverted for negatively-worded questions, so that a higher score indicates greater usability.
Research by Lewis and Sauro [29], has shown that the SUS can also be used to separately evaluate “learnability”. As the steep learning curve of high level programming languages was another motivation for our design, the ease with which researchers can learn to use Jeeves is critical to its adoption. Learnability scores were computed as a score out of 100 based
on answers to Question 4 and Question 10 (see Table II) as was demonstrated in [29]. The mean learnability was 77.3 (SD= 13.5) for programmers and 66.7 (SD= 21.7) for non-programmers, suggesting it is acceptably learnable by users of all experiences.
System Usability Scale (SUS) Questions
Q1. I think that I would like to use this system frequently
Q2.I found the system unnecessarily complex Q3. I thought the system was easy to use
Q4.. I think that I would need the support of a technical person to be able to use this system
Q5. I found the various functions in this system were well integrated
Q6.I thought there was too much inconsistency in this system
Q7. I would imagine that most people would learn to use this system very quickly
Q8.I found the system very cumbersome to use Q9. I felt very confident using the system
[image:6.612.321.566.171.562.2]Q10. I needed to learn a lot of things before I could get going with this system
TABLE II: SUS questions
Fig. 6: SUS score for each question and 95% confidence intervals. The dashed line highlights mean SUS score as calculated in [28]. (Questions with inverted scores are in bold.)
2) Errors made: Errors were divided into three categories.
Presentation errors were all mistakes that were caused by the presentation of information to the participant, including instances where a participant misinterpreted a button’s function or omitted a step in completing a survey. Navigation errors
were all attempts to find a component in the wrong menu, or a navigation to the incorrect sidebar tab. (A sequence of incorrect menu activations was counted as one error.) Control errors
[image:6.612.323.566.381.573.2]components from their nested location.
[image:7.612.80.269.207.383.2]For Tasks 1, 2 and 3, programmers made an average of 8.9, 0.2 and 7.0 errors respectively, giving a mean total of 16.1 errors (SD = 4.3). Non-programmers made an average of 10.2, 1.0 and 7.9 errors respectively, giving a mean total of 19.1 errors(SD= 8.7). An independent samples t-test showed no significant difference between the two groups,t(11.174) = −0.952, p= 0.351. This means that we can accept our second hypothesis. As there is no upper bound on the number of errors a user can make, this data is considered to be continuous, justifying use of a t-test over a Chi-Square test, for example. Results are shown in Fig. 7.
Fig. 7: Mean errors and 95% confidence interval
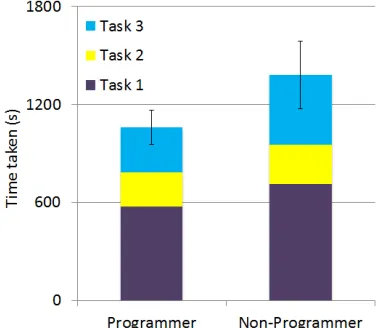
3) Task Time: For Tasks 1, 2 and 3, programmers took an average of 576.2s, 208.1s and 276.3s respectively, for a mean total of 1060.6s (SD = 176.8). Non-programmers took an average of 713.4s, 239.2s and 427.4s respectively, for a mean total of 1380.0s(SD= 315.7s). In this case, the independent samples t-test showed a significant difference in time taken,
t(12.002) = −2.709, p = 0.019, meaning we reject our third hypothesis. As this test involved one dependent variable between two groups, the t-test is a valid measure. Results are shown in Fig. 8.
Fig. 8: Mean time taken and 95% confidence interval
B. Qualitative results and Analysis
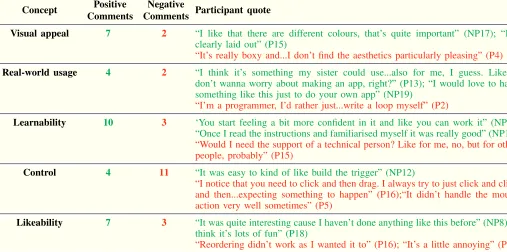
We analysed screen recordings and triangulated our insights with participants’ quantitative results and verbal feedback. We used a basic grounded theory approach, organising partici-pant responses based on common concepts. Five main con-cepts were identified, and representative participant comments, phrased both positively and negatively towards each concept, are presented in Table III. We now list additional insights obtained from these recordings.
1) Task 4 designs: Participants who had enough time to generate a partial solution tended to use a “programming by bricolage” process, building from the ground up and deleting erroneous components as necessary, identical to participants in an analysis of Scratch user habits by Meerbaum-Salant et. al [30]. Notable exceptions were the three participants who considered themselves to be “advanced” programmers. All three appeared to have a pre-conceived design, and constructed their solutions without using any unnecessary components.
2) Copying/Pasting: It was interesting to note that use of the copy/paste feature was exclusive to programmers. 10 of the 11 programmers used copy/paste during their task, but no programmers did so. This may suggest a disinclination for non-programmers to experiment with unfamiliar features. A study by Brandt et. al [31] suggests that programmers endeavour to engage in “rule-based performance” – to look for code that performs that goal, and modify it to their specific needs. Our results suggest that non-programmers may lack this rule, and revert to “knowledge-based performance”, where more conscious thought is required.
3) Hesitation: From the quantitative results, programmers were significantly faster than non-programmers, but with a similar number of errors. We hypothesised that this was due to programmers having a greater recall of required components, so we reviewed the recordings and counted “incorrect nav-igations” – entering a menu then exiting immediately – and divided this by the time taken to give a rate of incorrect clicks. Surprisingly, programmers’ average rate of incorrect clicks was 1.06/min, and non-programmers’ average rate was 0.95/min, with no statistically significant difference. From observation it was notable that non-programmers would often hover over menu buttons, whereas programmers would not hesitate in their search and exploration process.
4) Subject mentality: Our non-programming participants came from both scientific and humanities backgrounds. With the exception of one outlier, the three humanities students took the most time and made the most errors. This may suggest that having a scientific background makes unfamiliar programming concepts more intuitive, in line with a previous study, which showed that student programming performance is correlated with performance in science subjects [32]. Our target demographic are researchers in scientific fields, so this is an encouraging result in terms of Jeeves’s learnability, but may have implications for VPEs intended for non-scientists.
VII. LIMITATIONS
[image:7.612.80.270.541.705.2]Concept Positive Comments
Negative
Comments Participant quote
Visual appeal 7 2 “I like that there are different colours, that’s quite important” (NP17); “It’s clearly laid out” (P15)
“It’s really boxy and...I don’t find the aesthetics particularly pleasing” (P4)
Real-world usage 4 2 “I think it’s something my sister could use...also for me, I guess. Like, I don’t wanna worry about making an app, right?” (P13); “I would love to have something like this just to do your own app” (NP19)
“I’m a programmer, I’d rather just...write a loop myself” (P2)
Learnability 10 3 ‘You start feeling a bit more confident in it and like you can work it” (NP7); “Once I read the instructions and familiarised myself it was really good” (NP11)
“Would I need the support of a technical person? Like for me, no, but for other people, probably” (P15)
Control 4 11 “It was easy to kind of like build the trigger” (NP12)
“I notice that you need to click and then drag. I always try to just click and click and then...expecting something to happen” (P16);“It didn’t handle the mouse action very well sometimes” (P5)
Likeability 7 3 “It was quite interesting cause I haven’t done anything like this before” (NP8);“I think it’s lots of fun” (P18)
[image:8.612.50.557.59.311.2]“Reordering didn’t work as I wanted it to” (P16); “It’s a little annoying” (P6)
TABLE III: Selected comments related to the five main concepts (positive comments in green, negative comments in red, programmer=P(x), non-programmer=NP(x)).
this study. Students were a much more accessible group than external researchers, and given that this was an initial proof-of-concept and usability study, a larger number of participants with diverse subject backgrounds and programming knowledge was considered to be of paramount importance. It allowed us to collect a variety of feedback ranging from those with no programming experience and limited computer use, to HCI students who have studied interface usability as part of their undergraduate or postgraduate work.
It could also be argued that students in general will have little interest in the ESM, misrepresenting Jeeves’s real-world use and rendering the study invalid. To prevent this, we reconsidered how Jeeves could function for non-researchers, and instead introduced it to our participants as an application to create self-reminder and data collection apps. Given that only one participant explicitly stated that they would not use it in their daily lives, four explicitly stated that they would like to use Jeeves in real life, and the average score for Question 1 of the SUS (“I think that I would like to use this system frequently’) was 3.4 out of 5, it is apparent that participants in general could imagine themselves as potential end-users.
VIII. DISCUSSION/FUTUREWORK
Through our experimental method we were able to empir-ically test our three hypotheses, with screen capture analyses and participant comments revealing specific insights and is-sues. Participants, particularly non-programmers, gave positive verbal feedback on the environment, reflecting the ease with which they were able to generate specifications, and the major-ity of issues reported were minor annoyances in the drag-and-drop manipulation, rather than struggles with understanding the Jeeves language itself.
A potential line of future research is to extend this language beyond smartphones into other mobile technologies. There is a growing prevalence of wearable technology through which ESM studies could be administered. The JSON study specifica-tion is agnostic to the client device, and study replicaspecifica-tion could be performed with heterogeneous devices through bespoke client-side apps.
Following a second iteration of the visual language’s de-sign, we will refine the Android front-end to allow robust ESM applications to be run, and to test usability and satisfaction with end-users specific to the fields of psychology and medicine. The application is of sufficient functionality to run basic specifications, but further information is omitted as a future publication will specifically cover this application.
IX. CONCLUSION
We have described Jeeves, a visual language and environ-ment for the specification of Experience Sampling Method applications for Android smartphones. We have also demon-strated its utility by recreating ESM applications from the literature, and conducted a study to determine usability by end-users of varying programming knowledge, in which we show that the language and environment can be feasibly used by participants with no programming experience. In the more general domain of end-user development, this initial evaluation has shown that visual programming is a feasible direction of research for enabling technology-supported studies by end-users from various backgrounds.
ACKNOWLEDGMENT
REFERENCES
[1] M. Csikszentmihalyi and R. Larson, “Validity and reliability of the Experience-Sampling Method.” The Journal of nervous and mental disease, vol. 175, no. 9, pp. 526–36, Sep. 1987.
[2] A. Steptoe and J. Wardle, “Positive affect measured using ecological momentary assessment and survival in older men and women.” Pro-ceedings of the National Academy of Sciences of the United States of America, vol. 108, no. 45, pp. 18 244–8, Nov. 2011.
[3] D. S. Bond, J. G. Thomas, B. A. Ryder, S. Vithiananthan, D. Pohl, and R. R. Wing, “Ecological momentary assessment of the relationship between intention and physical activity behavior in bariatric surgery patients.”International journal of behavioral medicine, vol. 20, no. 1, pp. 82–7, Mar. 2013.
[4] J. E. Spook, T. Paulussen, G. Kok, and P. Van Empelen, “Monitoring dietary intake and physical activity electronically: feasibility, usability, and ecological validity of a mobile-based Ecological Momentary As-sessment tool.”Journal of medical Internet research, vol. 15, no. 9, p. e214, Jan. 2013.
[5] I. Kramer, C. J. P. Simons, J. A. Hartmann, C. Menne-Lothmann, W. Viechtbauer, F. Peeters, K. Schruers, A. L. van Bemmel, I. Myin-Germeys, P. Delespaul, J. van Os, and M. Wichers, “A therapeutic application of the experience sampling method in the treatment of depression: a randomized controlled trial.”World psychiatry : official journal of the World Psychiatric Association (WPA), vol. 13, no. 1, pp. 68–77, Feb. 2014.
[6] J. Froehlich, M. Y. Chen, S. Consolvo, B. Harrison, and J. A. Landay, “MyExperience: a system for in situ tracing and capturing of user feedback on mobile phones,” inProceedings of the 5th international conference on Mobile systems, applications and services. ACM, 2007, pp. 57–70.
[7] K. K. Rachuri, M. Musolesi, C. Mascolo, P. J. Rentfrow, C. Longworth, and A. Aucinas, “EmotionSense,” in Proceedings of the 12th ACM international conference on Ubiquitous computing - Ubicomp ’10. New York, New York, USA: ACM Press, Sep. 2010, p. 281.
[8] M. A. Moreno, L. A. Jelenchick, R. Koff, J. C. Eickhoff, N. Goniu, A. Davis, H. N. Young, E. D. Cox, and D. A. Christakis, “Associations between internet use and fitness among college students: an experience sampling approach,”Journal of Interaction Science, vol. 1, no. 1, p. 4, 2013.
[9] D. L. Rofey, E. E. Hull, J. Phillips, K. Vogt, J. S. Silk, and R. E. Dahl, “Utilizing Ecological Momentary Assessment in pediatric obesity to quantify behavior, emotion, and sleep.”Obesity (Silver Spring, Md.), vol. 18, no. 6, pp. 1270–2, Jun. 2010.
[10] G. A. Floridou and D. M¨ullensiefen, “Environmental and mental conditions predicting the experience of involuntary musical imagery: An experience sampling method study.”Consciousness and cognition, vol. 33, pp. 472–86, May 2015.
[11] M. C. Carlisle, “Raptor: a visual programming environment for teach-ing object-oriented programmteach-ing,”Journal of Computing Sciences in Colleges, vol. 24, no. 4, pp. 275–281, Apr. 2009.
[12] C. Elliott, V. Vijayakumar, W. Zink, and R. Hansen, “National Instru-ments LabVIEW: A Programming Environment for Laboratory Au-tomation and Measurement,”Journal of the Association for Laboratory Automation, vol. 12, no. 1, pp. 17–24, Feb. 2007.
[13] movisens GmbH, “movisensXS - eXperience Sampling for Android!” 2015. [Online]. Available: https://xs.movisens.com/
[14] LifeData, “LifeData,” 2015. [Online]. Available: https://www. lifedatacorp.com/
[15] Mema.ilumivu.com, “Mobile Ecological Momentary Assessment Software,” 2015. [Online]. Available: http://mema.ilumivu.com/ [16] Metricwire.com, “MetricWire: Mobile Data Collection Made Easy,”
2015. [Online]. Available: https://metricwire.com/
[17] Pacoapp.com, “PACO Experiment Dashboard,” 2015. [Online]. Available: https://www.pacoapp.com/
[18] “Profile of the PIEL Survey — Free, easy to use survey app.” [Online]. Available: http://pielsurvey.org/index/ survey-experience-sampling-method/
[19] Ohmage.org, “ohmage,” 2015. [Online]. Available: http://ohmage.org/ [20] Cogtherapy.com, “iPromptU,” 2015. [Online]. Available: http://www.
cogtherapy.com/ipromptu.htm
[21] N. Lathia, K. K. Rachuri, C. Mascolo, and P. J. Rentfrow, “Contextual dissonance,” in Proceedings of the 2013 ACM international joint conference on Pervasive and ubiquitous computing - UbiComp ’13. New York, New York, USA: ACM Press, Sep. 2013, p. 183. [22] J. Maloney, M. Resnick, N. Rusk, B. Silverman, and E. Eastmond, “The
Scratch Programming Language and Environment,”ACM Transactions on Computing Education, vol. 10, no. 4, pp. 1–15, Nov. 2010. [23] D. Wolber, “App inventor and real-world motivation,” inProceedings
of the 42nd ACM technical symposium on Computer science education - SIGCSE ’11. New York, New York, USA: ACM Press, Mar. 2011, p. 601.
[24] N. Lathia, K. Rachuri, C. Mascolo, and G. Roussos, “Open source smartphone libraries for computational social science,” inProceedings of the 2013 ACM conference on Pervasive and ubiquitous computing adjunct publication - UbiComp ’13 Adjunct. New York, New York, USA: ACM Press, Sep. 2013, pp. 911–920.
[25] D. Moody, “The Physics of Notations: Toward a Scientific Basis for Constructing Visual Notations in Software Engineering,” IEEE Transactions on Software Engineering, vol. 35, no. 6, pp. 756–779, Nov. 2009.
[26] N. Fraser and Others, “Blockly: A visual programming editor,” 2013. [Online]. Available: https://developers.google.com/blockly/
[27] J. Brooke, “SUS-A quick and dirty usability scale,”Usability evaluation in industry, vol. 189, no. 194, pp. 4–7, 1996.
[28] A. Bangor, P. T. Kortum, and J. T. Miller, “An Empirical Evaluation of the System Usability Scale,”International Journal of Human-Computer Interaction, vol. 24, no. 6, pp. 574–594, Jul. 2008.
[29] J. R. Lewis and J. Sauro,Human Centered Design, ser. Lecture Notes in Computer Science, M. Kurosu, Ed. Berlin, Heidelberg: Springer Berlin Heidelberg, Jul. 2009, vol. 5619.
[30] O. Meerbaum-Salant, M. Armoni, and M. Ben-Ari, “Habits of program-ming in scratch,” inProceedings of the 16th annual joint conference on Innovation and technology in computer science education - ITiCSE ’11. New York, New York, USA: ACM Press, Jun. 2011, p. 168. [31] J. Brandt, P. J. Guo, J. Lewenstein, and S. R. Klemmer, “Opportunistic
programming,” in Proceedings of the 4th international workshop on End-user software engineering - WEUSE ’08. New York, New York, USA: ACM Press, May 2008, pp. 1–5.
[32] S. Bergin and R. Reilly, “Programming: factors that influence success,”
 as a visual specification and an example question in the“Survey creator” pane (right)](https://thumb-us.123doks.com/thumbv2/123dok_us/8755183.390239/5.612.49.301.272.432/replication-kramer-visual-specication-example-question-survey-creator.webp)
![Fig. 6: SUS score for each question and 95% confidenceintervals. The dashed line highlights mean SUS score ascalculated in [28]](https://thumb-us.123doks.com/thumbv2/123dok_us/8755183.390239/6.612.321.566.171.562/fig-score-question-condenceintervals-dashed-highlights-score-ascalculated.webp)