ISSN Online: 2163-0437 ISSN Print: 2163-0429
DOI: 10.4236/ojf.2020.101008 Jan. 6, 2020 110 Open Journal of Forestry
Detection of Retention Trees on Clearcuts, a
50-Year Perspective
Emma Holmström
1*, Ellen Nordström
1, Delphine Lariviére
1,2, Ida Wallin
31Southern Swedish Forest Centre, Swedish University of Agricultural Science, Alnarp, Sweden 2The Forestry Research Institute of Sweden, Skogforsk, Ekebo, Svalöv, Sweden
3Chair of Forest and Environmental Policy, University of Freiburg, Tennenbacherstr, Freiburg, Germany
Abstract
Changes in clearcut management over time were evaluated using aerial pho-tographs taken between 1960 and 2010. Temporal changes were analysed in two different climatic zones in Sweden: a typical boreal forest zone (the coast of Västerbotten County), and the hemi-boreal zone of southern Sweden (represented by Kronoberg County). The study covers the periods before and after the paradigm shift in Swedish forestry caused by the equalization of the production and nature conservation objectives specified in the first paragraph of the Swedish Forestry Act. Photographs were processed to determine clear-cut size and shape and to register solitary retention trees and groups of reten-tion trees. Small but significant changes in clearcut size were detected over time. The number of retention trees increased over time, a result that was also found in other studies using different methodologies. The results demon-strate that measurable structural changes have occurred in Swedish forests over the 25 years since the paradigm shift. Results from this study also show that digital detection of green tree retention could be a future complement to field inventory and monitoring.
Keywords
Forestry, Clearcut, Aerial Photographs, Swedish Forestry Model, Retention Forestry
1. Introduction
Striking a balance between multiple objectives within sustainable forest man-agement is one of the greatest challenges for forestry. During the last decades, shifting to a management approach which includes multiple ecosystem services How to cite this paper: Holmström, E.,
Nordström, E., Lariviére, D., & Wallin, I. (2020). Detection of Retention Trees on Clearcuts, a 50-Year Perspective. Open Journal of Forestry, 10, 110-123.
https://doi.org/10.4236/ojf.2020.101008
Received: December 3, 2019 Accepted: January 3, 2020 Published: January 6, 2020
Copyright © 2020 by author(s) and Scientific Research Publishing Inc. This work is licensed under the Creative Commons Attribution International License (CC BY 4.0).
DOI: 10.4236/ojf.2020.101008 111 Open Journal of Forestry has been one important step to sustainable development (D’Amato, Jokela, O’Hara, & Long, 2018; Messier et al., 2019;Messier et al., 2015; Puettmann & Ammer, 2007). Highly mechanized and intensive forestry production has in-creased the efficiency and profitability in forestry but has adversely affected bio-diversity (Bremer & Farley, 2010;da Silva et al., 2019;Enander, 2007;Li, Dang, & Ambebe, 2009). Swedish forests have traditionally been managed to provide a multitude of ecosystem services, such as mushroom and berry picking, and re-creational values (Eckerberg, 1995). However, forest operations such as harvest and regeneration efforts have been optimized for wood extraction and clearcut-ting was the dominant forest management system in Sweden during the latter part of the last century (Lisberg Jensen, 2011). In this regime, the forest is di-vided into smaller or larger stands in which all trees are harvested at the same time, creating gaps known as clearcuts that are subsequently filled by a regenera-tion of even-aged trees.
The sizes of forest-stands and clearcuts correlate strongly with forests’ own-ership structures. Since the privatization of crown land two centuries ago (Ny-lund & Ingemarson, 2007), Sweden’s forests have predominantly been owned and managed by Non-Industrial Private Forest (NIPF) owners. In 2017, 319,649 individual NIPF owners held 48% of Sweden’s productive forestland, with an average forest holding of 49 ha productive forestland per owner (SFA, 2018, 2019). The average forest holding for all forest owner types was at this time 100 ha (SFA, 2018). There is considerable variation in ownership structures and sizes of forest holdings between geographical regions. In general, small-scale NIPF owners dominate in southern Sweden, while industrial large-scale owners are more prominent in the North. The average forest holding size for all forest own-er types ranges from 50 ha in the south (Götaland) to 221 ha in the north (Norr-land) (SFA, 2018).
Following the mechanized intensification of forestry and the introduction of the clearcutting regime in the mid-20th century, strong environmental concerns
DOI: 10.4236/ojf.2020.101008 112 Open Journal of Forestry million ha of forests were certified according to the FSC standard and 15.8 mil-lion ha were PEFC certified (FSC, 2018;PEFC, 2017). The 1993 Forestry Act and introduction of certification standards were thus important milestones in Swe-dish forestry. Since the new forest legislation was passed, a very technical debate has erupted about which strategy and forest management systems can best meet the twin goals of high production and nature conservation (Hoogstra-Klein, Brukas, & Wallin, 2017). Improved knowledge of forest ecology, the rising de-mand for environmentally friendly products, and the increasing prioritization of environmental conservation in public opinion (Eriksson, 2012; Messier et al., 2019), continue to stimulate the search for better ways of maintaining biodiver-sity and high productivity (Eriksson & Hammer, 2006). This search is further motivated by the increasing public concern about climate change and the need for mitigation, adaptation, and carbon storage.
The commitment to maintaining biodiversity has prompted far-reaching modifications of the clearcutting regime and forest management systems (Fe-drowitz et al., 2014;Franklin & Johnson, 2012;Gustafsson et al., 2012; Linden-mayer et al., 2012). First, retention tree management measures are now required by both the law and certification schemes. The certification schemes in particu-lar have detailed requirements regarding green tree retention. For example, cur-rent regulations state that foresters must retain 10 larger green trees per hectare after clear-felling. This represents a substantial investment for the forest owners and forestry industry. Various studies have demonstrated significant increases in the prevalence of features linked to conservation, including lone retention trees, groups of trees, or riparian and buffer zones (Kruys, Fridman, Gotmark, Si-monsson, & Gustafsson, 2013). These measures have resulted in forest manage-ment recommendations that include more mixed and structurally complex stands than earlier in cultivated forest (Agestam, Karlsson, & Nilsson, 2005; Fel-ton et al., 2016). Additionally, the directives for performing clearcutting have changed. Both the law and the certification schemes impose requirements relat-ing to the form and size of clearcuts, stipulatrelat-ing that they should follow natural variations in the forest landscape rather than making straight lines.
DOI: 10.4236/ojf.2020.101008 113 Open Journal of Forestry In this work, changes in clearcut management over time were estimated, using aerial photographs taken over a period of 50 years between 1960 and 2013. Temporal changes were studied in two different climatic zones in Sweden; a typ-ical boreal forest zone (the coastal region of Västerbotten County), and a he-mi-boreal region in southern Sweden (Kronoberg County). To assess changes in management practices over time, the size, shape, and abundance of clearcuts were determined. In addition, different types of retention trees in the clearcuts were detected and changes in their abundance over time were analysed.
Three hypotheses were evaluated. The first hypothesis was that the average clearcut size did not change over time or between regions. The second was that number of clearcuts with retention trees did not change over time or between regions, and neither did the number of detectable retention trees. In addition, the proportion of broadleaved or coniferous retention trees was investigated in a similar manner. Finally, the shape of the clearcuts was hypothesized to change over time, as an adjustment to a higher degree of conservation management.
2. Material and Methods
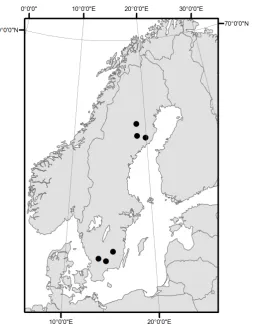
A study was conducted to determine how aerial photographs, delivered by the national cadastrial service (Lantmäteriet, 2017) could be used to monitor and describe retention tree management in clearcuts. This study also evaluated dif-ferences in management practices over time (between 1960 and 2013) and in different regions. Two regions in Sweden were chosen, representing southern and northern parts of the country: the county of Kronoberg (KB) and the coastal parts of Västerbotten (VB) county (Figure 1, Table 1). Three study areas were randomly selected in each region, giving six areas in total. The study areas were circular sample plots delineated in a GIS software package (ArcGIS® software by Esri. ArcGIS® and ArcMapTM), each with an area of 10,000 ha.
[image:4.595.210.540.551.725.2]In the southern study area, Kronoberg County, NIPF owners own 78% of the productive forestland. The average forest holding for all ownership types in this
Table 1. Regional data for Kronoberg and Västerbotten (Johansson & Lidestav, 2011;LST, 2016a, 2016b;SFA, 2019).
County statistics 2016 Kronoberg Västerbotten
Areal (km2) 9426 55,432
Proportion of Sweden 2 13
Citizens 191,000 263,378
Precipitation (mm∙year−1) 500 - 1000 500 - 700
Climatic zone III and IV V, VI and VII
Potential production m3∙year−1∙ha−1 9.1 3.3
Forest estate 11,000 18,746
Number of forest owners 14,000 23,940
DOI: 10.4236/ojf.2020.101008 114 Open Journal of Forestry
Figure 1. Map over Sweden and the northern and southern study areas marked with
black points. Map source Esri., ArcGIS®.
region is 54 ha, for NIPF owners 43 ha (SFA, 2019). In contrast, in the northern study area (Västerbotten County), there is a more even mixture of state (31%) and private industrial (23%) ownership of productive forestland (ibid.). Here, NIPF owners own 40% of the forestland and the average forest holding size for all ownership types is 170 ha, for NIPF owners 70 ha (ibid.). The study area is representative of the transitional forest conditions and typical socio-economic settings of Northern Sweden, encompassing both boreal forest and the Fennos-candia Mountains. The Västerbotten study area is also home to an indigenous Sámi population with the right to conduct traditional reindeer herding in the area.
Aerial photography has been performed periodically and systematically in Sweden since 1945. In the early years, the intervals between repeated flyovers and imaging of individual areas were considerably longer than they have been in the last ten years. The standard altitude for aerial photography is 4600 m above ground level, and the standard pixel resolution is 0.5 m.
DOI: 10.4236/ojf.2020.101008 115 Open Journal of Forestry based on photographs taken between 1955 and 1967 (the 1960 layer), one based on photographs from 1993-2005 (the 1990 layer), and one based on photographs from 2010-2013 (the 2010 layer). The 1960 layer represents the era before reten-tion tree management was introduced in Swedish forestry. The 1990 layer represents the transitional period around the implementation of the new forestry act, and the 2010 layer represents contemporary Swedish retention tree man-agement.
Clearcut management was evaluated by analysing clearcut shape, size and frequency. All clearcuts were registered and recorded as manually edited poly-gons using ArcGIS 10.3. A clearcut was defined as a continuous open harvested area in which bare land was visible between seedlings (Figure 2). Individual continuous clearcut regions were counted as single units, although their owners or other stakeholders might divide them over multiple units or estates. This was done because GIS-analysts cannot identify such internal divisions. The boundary of a clearcut was defined as the edge between the open clearcut and forest, or by the border between the clearcut zone and a different land use category. Breaks in continuity due to small roads, ditches or streams were ignored if there was a co-herent open clearcut area on both sides. Clearcut shape was evaluated by com-puting a shape index that compares the clearcut’s actual perimeter and area to those of a square with the same perimeter (for which the shape index is unity). The Shape index is calculated using the expression:
Perimeter 4 Shape index
Area
= (1)
where the clearcut’s perimeter and area were derived from the created shapefiles. This index was used to approximate the straightness of the clearcut’s borders and to monitor changes in the extent to which clearcut shape was adapted to re-flect the topography of the terrain. The higher the shape index, the less square the clearcut’s shape.
[image:6.595.215.541.568.692.2]Different tree retention treatments were evaluated separately. Solitary tree re-tention was defined as the rere-tention of countable single trees on an open clearcut where the density of trees was below 45 trees ha−1. Clearcuts with higher stem
DOI: 10.4236/ojf.2020.101008 116 Open Journal of Forestry density on clearcuts was regarded as ongoing seed tree management, where the trees may be removed as part of the regeneration method. Broadleaved retention trees were mapped but single trees were not counted in species groups. All counts of single retention trees were registered along with the trees’ coordinates.
Groups of retained trees were registered if more than three trees were retained in a cluster in which the trees were so close together that it was difficult to dis-tinguish the crowns of individual trees. The cluster areas were defined using po-lygonal patches and registered separately from the single tree layers.
Riparian zones were evaluated based on the width of the retention zone be-tween the water’s edge and the edge of the clearcut. Tree retention in buffer zones on one or both sides of small streams and ditches was registered by re-cording the zones’ widths in metres.
The statistical significance of observed differences between time periods and regions was evaluated using Student’s t-test when appropriate, with a confidence threshold of p < 0.05.
3. Results
In Kronoberg, the mean size of clearcuts increased significantly (p < 0.001) be-tween 1960 and 1990, from 1.4 ha to 3.7 ha. Bebe-tween 1990 and 2010, the size of the clearcuts remained unchanged but the number of registered clearcuts in-creased by 53% (Figure 3). In this region, clearcuts accounted for 0.7% of the studied area on average in 1960 and 3% in 2010. The mean size of the clearcuts in Västerbotten decreased from 14.1 ha in 1960 to 12.6 ha in 1990 and 8.3 ha in 2010. Additionally, the total clearcut area in Västerbotten decreased from 5% of the study area in 1960 to 3% in 2010. The shape index increased significantly over time in Kronoberg (p < 0.001) but not in Västerbotten (p = 0.33), with an average increase of 9% and 3% respectively.
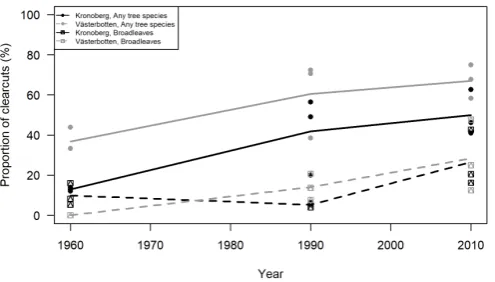
In both counties, the proportion of clearcuts with detectable retention trees increased significantly from 1960 to 2013, from 37% to 67% in Västerbotten and from 13% to 50% in Kronoberg (Figure 4). The proportion of clearcuts with broadleaved retention trees also increased over time: less than 5% of the clear-cuts in the 1960 layer contained detectable broadleaves as retention trees. Con-versely, in the 2010 layer, 20% and 49% of the clearcuts with retention trees con-tained recon-tained broadleaves in Kronoberg and Västerbotten, respectively.
The number of solitary retention trees per ha on the clearcuts also increased significantly (p < 0.001)—by 67% between 1960 and 2010—in Kronoberg. In Västerbotten, the increase over time was not significant (p = 0.86). In addition, the density of solitary retention trees was significantly higher in Kronoberg for all time periods. No correlation was found between the density of solitary reten-tion trees and clearcut size.
DOI: 10.4236/ojf.2020.101008 117 Open Journal of Forestry (a) (b)
Figure 3. The mean and the variance of clearcut size in the studied areas and time pe-riods. Numbers of identified clearcuts (n = …) are given inside the panels. The upper panel shows data from Västerbotten and the lower panel shows data Kronoberg county, respectively. Black dots indicate median, the border of the box indicates the first and third quartile, length of whiskers represents approximately 2 standard deviations of the data, and the unfilled dots indicate outliers of the whiskers.
Figure 4. Percentages of clearcuts with solitary retention trees in the study areas, all trees and broadleaves indicated with separate symbols. Points indicating study area values and lines show mean values of the study areas for the counties and time periods respectively.
the density of clusters of retention trees increased from 0.03 groups ha−1 in 1960
to 0.06 groups ha−1, and in Västerbotten it increased from 0.005 groups ha−1 in
1960 to 0.10 groups ha−1 in 2010.
The proportion of riparian buffer zones around water bodies on the clearcuts increased significantly between 1960 and 2010 in both counties (Kronoberg p < 0.001, Västerbotten p = 0.04) (Figure 5). In 1960, the proportion of retained ri-parian zones was less than 10% whereas in 2010 it was 66% (Appendix: Table A2). In addition, there was a tendency for the average width of the buffer zone (i.e. the distance between the water edge and the clearcut) to increase over time.
4. Discussion
[image:8.595.251.499.300.441.2]DOI: 10.4236/ojf.2020.101008 118 Open Journal of Forestry Figure 5. Percentages of clearcuts with no detected streams/ditches (white), without re-tained buffer zones for detected streams/ditches (grey), and with rere-tained riparian zones (black), in the two counties during the studied time periods.
the total area of clearcuts doubled between 1960 and 2010. This supports the conclusion that clearcut size correlates more strongly with ownership structure than with the introduction of regulatory instruments relating to forest manage-ment. However, the increase in the shape index in Kronoberg over time may in-dicate a higher degree of site adjustment when performing clearcuts. That is to say, forest managers may have compensated for the increased size of clearcuts by creating clearcuts with more flexible boundaries that account for local topogra-phy and incorporate small set-aside areas, etc. Additionally, the proportions of solitary and clustered retention trees (both coniferous and broadleaved) have increased, confirming previous reports suggesting that the policy change and paradigm shift that occurred in the early 1990s have increased the structural di-versity of clearcuts in comparison to previous management. This increases the potential of more structurally diverse production forests in later stages of forest development.
DOI: 10.4236/ojf.2020.101008 119 Open Journal of Forestry is that edge zones were difficult to assess based on the aerial photographs and were therefore excluded from this study.
The identification of retained trees adjacent to streams and ditches by analysis of aerial photographs was also tested but the results obtained should be inter-preted with care for two reasons. First, the boundaries of the clearcuts in such cases may be quite linear because of the linearity of the bodies of water in the landscape. It is quite likely that linear water bodies such as streams will form natural stand boundaries, and thus will also naturally delimit clearcut sites. Consequently, these landscape elements and their handling by forest managers cannot be properly assessed using the current methodology. Second, the ease of detecting water elements depended on the quality of the aerial photographs. This issue could potentially be resolved in future by using modern depth to water maps or digital elevation models based on high resolution LIDAR scans.
Scholars have highlighted the contradiction implicit in the equalized goal of the Forestry Act and argued that the Swedish Forestry Model represents a wish for “more of everything” (Lindahl et al., 2015). Critics emphasize the trade-off between high production of wood-based products and the preservation of bio-diversity. The results presented here show that contemporary forest manage-ment practices produce clearcut structures that differ measurably from those formed by the practices common in the 1960s. This is in line with international trends that discuss forest management aiming for increased complexity (Fahey et al., 2018; Gustafsson et al., 2012; Lindenmayer et al., 2012; Messier et al., 2019). These results cannot by themselves be used to determine whether this is sufficient to maintain biodiversity in accordance with the objectives in the Fore-stry Act, although it demonstrates that today’s clearcuts are more structurally diverse than those 50 years ago. This structural diversity has at least the potential to support comparatively more biodiversity and other studies, with focus on how retention forestry affect species taxa and functional groups, show positive effects on abundance and richness both in short and long term perspective (Franklin, Macdonald, & Nielsen, 2019; Pastur et al., 2019; Savrak, Remm, & Lohmus, 2019;Sterkenburg, Clemmensen, Lindahl, & Dahlberg, 2019). However, assess-ing the extent to which current practices actually supports critical species is out-side the scope of this work. In conclusion, this study demonstrates that moni-toring some structures of retention forestry could be possible using aerial pho-tographs, especially in combination with other digital information sources and as a complement to field-based national inventories.
Acknowledgements
This research did not receive any specific grant from funding agencies in the public, commercial, or not-for-profit sectors.
Conflicts of Interest
DOI: 10.4236/ojf.2020.101008 120 Open Journal of Forestry
References
Agestam, E., Karlsson, M., & Nilsson, U. (2005). Mixed Forests as a Part of Sustainable Forestry in Southern Sweden. Journal of Sustainable Forestry, 21, 101-117.
https://doi.org/10.1300/J091v21n02_07
Bremer, L., & Farley, K. (2010). Does Plantation Forestry Restore Biodiversity or Create Green Deserts? A Synthesis of the Effects of Land-Use Transitions on Plant Species Richness. Biodiversity and Conservation, 19, 3893-3915.
https://doi.org/10.1007/s10531-010-9936-4
D’Amato, A. W., Jokela, E. J., O’Hara, K. L., & Long, J. N. (2018). Silviculture in the United States: An Amazing Period of Change over the Past 30 Years. Journal of Fore-stry, 116, 55-67.https://doi.org/10.5849/JOF-2016-035
da Silva, L. P., Heleno, R. H., Costa, J. M., Valente, M., Mata, V. A., Goncalves, S. C., Ra-mos, J. A. et al. (2019). Natural Woodlands Hold More Diverse, Abundant, and Unique Biota than Novel Anthropogenic Forests: A Multi-Group Assessment. European Jour-nal of Forest Research, 138, 461-472.https://doi.org/10.1007/s10342-019-01183-5
Eckerberg, K. (1995). Multiple-Use Forestry Administration, Legislation and Interest Groups. Vantaa: METLA, Finnish Forest Research Institute, Helsinki Research Centre. Enander, K.-G. (2007). Skogsbruk på samhällets villkor: Skogsskötsel och skogspolitik
under 150 år (9163383276).
Eriksson, L. (2012). Exploring Underpinnings of Forest Conflicts: A Study of Forest Val-ues and Beliefs in the General Public and among Private Forest Owners in Sweden. So-ciety & Natural Resources, 25, 1102-1117.
https://doi.org/10.1080/08941920.2012.657749
Eriksson, S., & Hammer, M. (2006). The Challenge of Combining Timber Production and Biodiversity Conservation for Long-Term Ecosystem Functioning: A Case Study of Swedish Boreal Forestry. Forest Ecology and Management, 237, 208-217.
https://doi.org/10.1016/j.foreco.2006.09.046
Fahey, R. T., Alveshere, B. C., Burton, J. I., D’Amato, A. W., Dickinson, Y. L., Keeton, W. S., Hardiman, B. S. et al. (2018). Shifting Conceptions of Complexity in Forest Man-agement and Silviculture. Forest Ecology and Management, 421, 59-71.
https://doi.org/10.1016/j.foreco.2018.01.011
Fedrowitz, K., Koricheva, J., Baker, S. C., Lindenmayer, D. B., Palik, B., Rosenvald, R., Gustafsson, L. et al. (2014). Can Retention Forestry Help Conserve Biodiversity? A Meta-Analysis. Journal of Applied Ecology, 51, 1669-1679.
https://doi.org/10.1111/1365-2664.12289
Felton, A., Nilsson, U., Sonesson, J., Felton, A., Roberge, J.-M., Ranius, T., Wallertz, K. et al. (2016). Replacing Monocultures with Mixed-Species Stands: Ecosystem Service Im-plications of Two Production Forest Alternatives in Sweden. Ambio, 45, 124-139. https://doi.org/10.1007/s13280-015-0749-2
Franklin, C. M. A., Macdonald, S. E., & Nielsen, S. E. (2019). Can Retention Harvests Help Conserve Wildlife? Evidence for Vertebrates in the Boreal Forest. Ecosphere, 10,
1-21.https://doi.org/10.1002/ecs2.2632
Franklin, J. F., & Johnson, K. N. (2012). A Restoration Framework for Federal Forests in the Pacific Northwest. Journal of Forestry, 110, 429-439.
https://doi.org/10.5849/jof.10-006
FSC (2018). FSC-Certifierad areal och antal certifikatsinnehavare CoC och FM 1998-2017.
DOI: 10.4236/ojf.2020.101008 121 Open Journal of Forestry
Gustafsson, L., Baker, S. C., Bauhus, J., Beese, W. J., Brodie, A., Kouki, J., Franklin, J. F. et al. (2012). Retention Forestry to Maintain Multifunctional Forests: A World Perspec-tive. Bioscience, 62, 633-645.https://doi.org/10.1525/bio.2012.62.7.6
Hoogstra-Klein, M. A., Brukas, V., & Wallin, I. (2017). Multiple-Use Forestry as a Boun-dary Object: From a Shared Ideal to Multiple Realities. Land Use Policy, 69, 247-258. https://doi.org/10.1016/j.landusepol.2017.08.029
Johansson, J., & Lidestav, G. (2011). Can Voluntary Standards Regulate Forestry? Assess-ing the Environmental Impacts of Forest Certification in Sweden. Forest Policy and Economics, 13, 191-198.https://doi.org/10.1016/j.forpol.2010.11.004
Kruys, N., Fridman, J., Gotmark, F., Simonsson, P., & Gustafsson, L. (2013). Retaining Trees for Conservation at Clearcutting Has Increased Structural Diversity in Young Swedish Production Forests. Forest Ecology and Management, 304, 312-321.
https://doi.org/10.1016/j.foreco.2013.05.018
KSLA (2009). The Swedish Forestry Model.
https://www.ksla.se/wp-content/uploads/2010/10/The-Swedish-Forestry-Model.pdf Lantmäteriet, T. S. M. (2017). Cadastral and Land Registration Authority (Cartographer).
https://www.lantmateriet.se
Li, J. L., Dang, Q. L., & Ambebe, T. F. (2009). Post-Fire Natural Regeneration of Young Stands on Clearcut and Partial-Cut and Uncut Sites of Boreal Mixedwoods. Forest Ecology and Management, 258, 256-262.https://doi.org/10.1016/j.foreco.2009.04.012
Lindahl, K. B., Sténs, A., Sandström, C., Johansson, J., Lidskog, R., Ranius, T., & Roberge, J.-M. (2015). The Swedish Forestry Model: More of Everything? Forest Policy and Economics, 77, 44-55.
Lindenmayer, D. B., Franklin, J. F., Lohmus, A., Baker, S. C., Bauhus, J., Beese, W., Gus-tafsson, L. et al. (2012). A Major Shift to the Retention Approach for Forestry Can Help Resolve Some Global Forest Sustainability Issues. Conservation Letters, 5, 421-431. https://doi.org/10.1111/j.1755-263X.2012.00257.x
Lisberg Jensen, E. (2011). Det moderna kalhyggesbruket: Från framgångssaga till förhan-dlingslösning.
LST (2016a). Länsstyrelsen Kronoberg, fakta om Kronobergs län.
https://www.lansstyrelsen.se/kronoberg.html
LST (2016b). Länsstyrelsen Västerbotten, fakta om Västerbottens län.
https://www.lansstyrelsen.se/vasterbotten.html
Messier, C., Bauhus, J., Doyon, F., Maure, F., Sousa-Silva, R., Noler, P., Puettmann, K. et al. (2019). The Functional Complex Network Approach to Foster Forest Resilience to Global Changes. Forest Ecosystems, 6, 21.https://doi.org/10.1186/s40663-019-0166-2
Messier, C., Puettmann, K., Chazdon, R., Andersson, K. P., Angers, V. A., Brotons, L., Levin, S. A. et al. (2015). From Management to Stewardship: Viewing Forests as Com-plex Adaptive Systems in an Uncertain World. Conservation Letters, 8, 368-377. https://doi.org/10.1111/conl.12156
Nylund, J.-E. (2009). Forestry Legislation in Sweden. Uppsala: Dept. of Forest Products, Swedish University of Agricultural Sciences.
Nylund, J.-E. (2010). Swedish Forest Policy since 1990: Reforms and Consequences. Nylund, J.-E., & Ingemarson, F. (2007). Forest Tenure in Sweden: A Historical
Perspec-tive.
Ecolog-DOI: 10.4236/ojf.2020.101008 122 Open Journal of Forestry ical Processes, 8, 24.https://doi.org/10.1186/s13717-019-0177-5
PEFC (2017). Statistiksammanställning 2017-12-31.
https://pefc.se/wp-content/uploads/2018/02/PEFC-Statistik-tom-171231.pdf
Puettmann, K. J., & Ammer, C. (2007). Trends in North American and European Rege-neration Research under the Ecosystem Management Paradigm. European Journal of Forest Research, 126, 1-9.https://doi.org/10.1007/s10342-005-0089-z
Savrak, A. L., Remm, L., & Lohmus, A. (2019). Retention Trees Can Benefit Biodiversity without Significant Long-Term Reduction in Stand Regeneration in Estonian Mixed Forests. European Journal of Forest Research, 138, 513-525.
https://doi.org/10.1007/s10342-019-01187-1
SFA (2018). Statistik om skogsägande 2017.
https://www.skogsstyrelsen.se/globalassets/om-oss/publikationer/2018/rapport-2018-1 2-strukturstatistik-statistik-om-skogsagande-2017.pdf
SFA (2019). Swedish Forest Agency, Statistical Database.
https://www.skogsstyrelsen.se/statistik/sveriges-officiella-statistik
Simonsson, P., Gustafsson, L., & Ostlund, L. (2015). Retention Forestry in Sweden: Driv-ing Forces, Debate and Implementation 1968-2003. Scandinavian Journal of Forest Re-search, 30, 154-173.https://doi.org/10.1080/02827581.2014.968201
Sterkenburg, E., Clemmensen, K. E., Lindahl, B. D., & Dahlberg, A. (2019). The Signific-ance of Retention Trees for Survival of Ectomycorrhizal Fungi in Clear-Cut Scots Pine Forests. Journal of Applied Ecology, 56, 1367-1378.
DOI: 10.4236/ojf.2020.101008 123 Open Journal of Forestry
Appendix
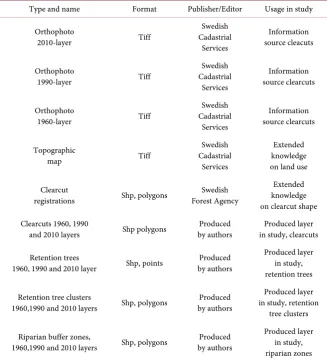
Table A1. GIS rasters and shapefiles used in the study.
Type and name Format Publisher/Editor Usage in study
Orthophoto
2010-layer Tiff
Swedish Cadastrial Services Information source cleacuts Orthophoto
1990-layer Tiff
Swedish Cadastrial Services Information source clearcuts Orthophoto
1960-layer Tiff
Swedish Cadastrial Services Information source clearcuts Topographic
map Tiff
Swedish Cadastrial
Services
Extended knowledge on land use
Clearcut
registrations Shp, polygons Forest Agency Swedish
Extended knowledge on clearcut shape Clearcuts 1960, 1990
and 2010 layers Shp polygons by authors Produced in study, clearcuts Produced layer
Retention trees
1960, 1990 and 2010 layer Shp, points by authors Produced
Produced layer in study, retention trees
Retention tree clusters
1960,1990 and 2010 layers Shp, polygons by authors Produced
Produced layer in study, retention
tree clusters
Riparian buffer zones,
1960,1990 and 2010 layers Shp, polygons by authors Produced
Produced layer in study, riparian zones
Table A2. Riparian buffer zones detected in clearcuts. N. clearcut = total number of clearcuts, N. no = number of clearcuts with detected water streams/ditches without rian zones, N. yes = number of clearcuts with detected water streams/ditches with ripa-rian zones, Mean zone width = measured average buffer zone width (m) perpendicular to the stream/water body.
County Time period N. clearcuts N. no N. yes Mean zone width (m)
Kronoberg 1960 142 26 3 28
1990 154 5 17 13
2010 236 12 23 15
Västerbotten 1960 104 7 6 24
1990 106 10 15 20
[image:14.595.209.539.555.675.2]