Gas around galaxy haloes: methodology comparisons using
hydrodynamical simulations of the intergalactic medium
Avery Meiksin,
1‹James S. Bolton
2and Eric R. Tittley
11SUPA†, Institute for Astronomy, University of Edinburgh, Blackford Hill, Edinburgh EH9 3HJ, UK 2School of Physics and Astronomy, University of Nottingham, University Park, Nottingham NG7 2RD, UK
Accepted 2014 September 16. Received 2014 September 16; in original form 2014 June 29
A B S T R A C T
We perform cosmological simulations of the intergalactic medium (IGM) at redshiftz∼3 using the numerical gravity-hydrodynamics codes GADGET-3 and ENZO for the purpose of modelling the gaseous environments of galaxies. We identify haloes in the simulations using three different algorithms. Different rank orderings of the haloes by mass result, introducing a limiting factor, in identifying haloes with observed galaxies. We also compare the physical properties of the gas between the two codes, focusing primarily on the gas outside the virial radius, motivated by recent HIabsorption measurements of the gas aroundz∼2–3 galaxies. The internal dispersion velocities of the gas in the haloes have converged for a box size of 30 comoving Mpc, but the centre-of-mass peculiar velocities of the haloes have not up to a box size of 60 comoving Mpc. The density and temperature of the gas within the instantaneous turn-around radii of the haloes are adequately captured for box sizes of 30 Mpc on a side, but the results are highly sensitive to the treatment of unresolved, rapidly cooling gas, with the gas mass fraction within the virial radius severely depleted by star formation in theGADGET-3 simulations. Convergence of the gas peculiar velocity field on large scales requires a box size of at least 60 Mpc. Outside the turn-around radius, the physical state of the gas agrees to 30 per cent or better both with box size and between simulation methods. We conclude that generic IGM simulations make accurate predictions for the intergalactic gas properties beyond the halo turn-around radii, but the gas properties on smaller scales are highly dependent on star formation and feedback implementations.
Key words: methods: numerical – galaxies: formation – intergalactic medium – large-scale structure of Universe.
1 I N T R O D U C T I O N
The gaseous environments of forming galaxies are expected to be a maelstrom of activity. Gaseous flows into dark matter haloes feed galaxies with material for creating stars. The resulting supernovae drive outflows that may impede or disrupt the inflow. These outflows may have several consequences on the growth of galaxies and their gaseous environments. They may regulate star formation in the galaxies, open up pathways for the release of ionizing photons that contribute to the metagalactic photoionization background, and possibly distribute metals over intergalactic scales.
Observational evidence for outflows in moderate-redshift (1.5z3) galaxies has been mounting for over a decade. Spec-tral measurements of star-forming galaxies reveal blueshifted metal absorption lines, sometimes accompanied by enhanced blue Balmer
E-mail:[email protected]
†Scottish Universities Physics Alliance.
emission wings or redshifted Lyαemission (e.g. Steidel et al.1996,
2010; Franx et al.1997; Pettini et al.2000, 2001; Weiner et al.
2009; Quider et al.2010; Genzel et al.2011). While mass flow rate estimates are fraught with uncertainties, the absorption and velocity signatures suggest outflow rates comparable to the star formation rates of the galaxies, with a large reservoir of cool gas built up by the outflows in the circumgalactic region (Steidel et al.2010; Genzel et al.2011).
On the other hand, evidence for cold, inflowing gas has been less forthcoming. Inflows may either arise from cosmological accretion on to the haloes, or by returning gas carried outwards earlier by winds. Detection of the inflow patterns around moderate redshift (z=2–3) galaxies has, however, recently been provided by velocity measurements of the Lyαoptical depth of neutral hydrogen in the vicinity of galaxies (Rakic et al.2012; Rudie et al.2012), extending from circumgalactic scales out to several comoving Mpc.
Feedbacks in the form of winds driven by supernovae have long been suspected of regulating the inflow and outflow of gas around galaxy haloes (Mathews & Baker1971; Larson1974). The
gravitational influence of dark matter will favour mass-loss via winds from low-mass haloes over large, and may be responsible for the distinction between dwarf and normal galaxies (Dekel & Silk
1986). The ram pressure of cosmological accretion on to sufficiently massive haloes may even trap a wind within the turn-around radius, where the gas has decoupled from the Hubble expansion and is inflowing, leading to renewed infall and star formation (Fujita et al.
2004).
Given the variety of complex, non-linear physical mechanisms at play in the gaseous environments of galaxy haloes, cosmological hydrodynamical simulations are widely used to model the observa-tional data. However, although many simulations with winds have been performed, the basic driving mechanism of the winds, whether by pressure or by momentum, and basic parameters like the mass loading factor are still unknown (e.g. Mac Low, McCray & Norman
1989; Springel & Hernquist2003; Murray, Quataert & Thompson
2005; Oppenheimer & Dav´e2008; Dalla Vecchia & Schaye2012; Creasey, Theuns & Bower2013). A further complication is that some winds may be driven by active galactic nuclei. As a con-sequence, even when models predict a wind will be present, it is unclear how far the wind will travel, how much mass it carries and even whether it will escape the galaxy into the intergalactic medium (IGM) or fall back on to the galaxy.
In contrast, numerical simulations have been very successful at predicting the properties of the lower density, largely quiescent intergalactic gas probed by the Lyαforest to high accuracy (Meiksin
2009). Despite lacking sub-grid implementations for winds, these models can nevertheless prove useful as a tool for interpreting and calibrating the absorption signatures of the gas around galaxies. To do so, however, it is necessary to establish how accurately the observable properties of the IGM may be predicted in these models, and to determine at which scales commonly used IGM simulation methodologies are no longer sufficient to model complex gaseous halo environments.
The purpose of this paper is to describe in detail the capacity and limitations of simulations specifically designed for modelling the IGM when applied to the extended gaseous environment of galaxies. This work will focus on moderate redshift galaxies in the range 2< z <3 in particular, for which the surrounding gas has been probed by HIabsorption-line studies along lines of sight to background quasars, as in the Very Large Telescope Lyman-break galaxy redshift survey (Crighton et al.2011) and the Keck Baryonic Structure Survey (Rudie et al.2012). The latter authors in particu-lar divide the gaseous environment of galaxies into three zones: a circumgalactic zone within 300 kpc (proper) of the galaxy, which approaches the turn-around radius of the galaxy haloes; an interme-diate zone between 300 kpc and 2 Mpc (proper) and the ambient IGM at larger distances. The most massive haloes may also be useful for modelling the environments of quasar hosts, which show evi-dence for large amounts of cool gas (Hennawi et al.2006; Prochaska, Hennawi & Simcoe2013). In this work, we shall demonstrate that IGM simulations are able to converge on the physical properties of the gas outside the circumgalactic zone, specifically beyond the turn-around radii of the gas accretion on to the haloes, but require a detailed star formation prescription to model accurately the gas within. Any disagreement between the simulation predictions of HI
properties and those measured beyond the turn-around radius would suggest that winds influence gas outside the circumgalactic zone. We are examining this topic in a companion paper.
In order to demonstrate this, the two key factors we investigate in the IGM simulations are the uncertainty in the simulated halo masses associated with the observed galaxies, and the numerical
agreement of the physical properties of the gas as computed by dif-fering simulation methodologies. We use two widely used gravity-hydrodynamics codes for this purpose:GADGET-3, an updated version
of the publicly available codeGADGET-2 (last described by Springel
2005), and ENZO(Bryan et al. 2014). In the first half of this
pa-per, we investigate the selection of dark matter haloes. No single halo-finding algorithm of the many in the literature is overall bet-ter than the rest; at some level, the identification of haloes, and in particular the masses assigned to them, depend on arbitrary choices of technique. The issues involved have received wide attention in the literature for low-redshift haloes (e.g. White2002; Luki´c et al.
2009; Bhattacharya et al.2011; Onions et al.2012; Klypin et al.
2013; Knebe et al.2013; Watson et al.2013; Velliscig et al.2014), but less so for the redshifts of interest here, at 2< z <3 (Reed et al.2007; Tinker et al.2008; Watson et al.2013). We adopt three different methods and assess the differences in the properties of the haloes identified. In the second half of the paper, we compare the properties of the gas surrounding the haloes as computed by
GADGET-3 andENZO.
All results are presented for a flat cold dark matter (CDM) universe with the cosmological parametersm =0.28,
bh2=0.0225 andh=H0/100 km s−1=0.70, representing the
to-tal mass density, baryon density and Hubble constant, respectively. The initial matter power spectrum in the simulations has a spectral indexn=0.96, and is normalized toσ8h−1=0.82, consistent with the 9-yearWilkinson Microwave Anisotropy Probedata (Hinshaw et al.2013).
This paper is organized as follows. In the next section, we describe the cosmological simulations used in this work. The halo catalogues constructed from these results are discussed in Section 3, and the properties of the gaseous environments of the haloes are presented in Section 4. Readers interested primarily in the comparison of the properties of gas around galaxy haloes in the simulations may skip directly to Section 4. Our conclusions are summarized in Section 5. A short appendix contains technical details on the convergence requirements and appropriate parameter choices when identifying dark matter haloes in the simulations.
2 N U M E R I C A L S I M U L AT I O N S
2.1 Cosmological hydrodynamics codes
We use two widely used gravity-hydrodynamics codes in this anal-ysis, one particle based and the other grid based. The particle-based codeGADGET-3, which is an updated version of the publicly
avail-able code GADGET-2 (Springel2005), uses smoothed particle
hy-drodynamics to solve the fluid equations and a particle-based tree algorithm for gravity. By contrast,ENZO(Bryan et al.2014) solves
the fluid equations, including the gravity of the baryons, on a mesh, and the dark matter gravitational forces on the top-level grid using a hybrid particle–mesh (PM) scheme. An extension of the method is to adapt the mesh resolution as necessary using adaptive mesh refinement. Tests show that the success in resolving dark matter haloes below the top grid is sensitive to the means of triggering the refinements (O’Shea et al.2005; Heitmann et al.2008). We consider only unigrid (top-level grid) simulations here, in keeping with the typical approach used for IGM analyses.
The numerical simulations were performed in boxes of size 30 Mpc (comoving) on a side usingGADGET-3 andENZO, v.2.1.1.
As we focus on moderate-redshift haloes, the runs were performed down toz=2 only. TheGADGET-3 simulations were run with 5123
gas particles and 5123CDM particles. The
Table 1. Summary of the simulations performed in this work. The columns, from left to right, list the simulation name, the box size in comoving Mpc, the number of resolution elements in the simulation, the code used for the run, the star formation prescription and whether or not the model includes supernovae-driven winds.
Name Box size Resolution Method Star formation Winds (Mpc) elements
G30qLyα 30 2×5123 GADGET-3 qLyα N
G30sfnw 30 2×5123 GADGET-3 SH03 N
G30sfw 30 2×5123 GADGET-3 SH03 Y
E30_512 30 5123 ENZO-2 None N
E60_1024 60 10243 ENZO-2 None N
run with a top-level-only grid of 5123mesh zones and 5123CDM
particles. The dark matter particle mass in these simulations is
mc=6.4×10⁶M, and the gas particle mass (or mean gas mass
per grid zone) ismg=1.3×10⁶M. These simulation
parame-ters ensure good convergence on the statistics of the Lyαforest at
z∼2–3 (Meiksin & White2004; Bolton et al.2005). As a test of convergence on the properties of the gas surrounding the haloes with box size, we also perform a secondENZOsimulation in a 60 Mpc
box with 10243mesh zones and 10243CDM particles. We note that
the standard initial conditions generation routines differ between
GADGET-3 andENZO. We stress that we have not sought to generate
identical initial conditions for the two codes, but rather to examine differences between the overall code methodologies. In this sense, we are not performing head-to-head code comparisons, but rather seeking the regime of agreement between two different generic IGM simulations using two widely used codes, examining in particular the gaseous environments of galactic mass haloes as computed by the simulations.
Both theENZOandGADGET-3 computations used identical back-ground photoionization histories and atomic rates for the heating and cooling, as discussed in Tittley & Meiksin (2007), except for adopting the HIelectron excitation and collisional cooling rate of
Scholz & Walters (1991). We use the photoionization and photoheat-ing rates of Haardt & Madau (2012), which include contributions from both galaxies and quasars. The HeIIheating rate was modified
to reproduce the IGM temperature evolution of Becker et al. (2011) forγ =1.3. The UV background is switched on atz=15 and is applied in the optically thin limit. The codes were also modified to solve the non-equilibrium ionization rate equations.
Any computation of the IGM also requires a means of avoid-ing the high computational expense incurred by followavoid-ing rapidly cooling gas. Our focus in this study is on gas outside the galaxy haloes, within which the bulk of this cooling occurs. Nevertheless, the treatment of rapidly cooling gas will impact on the baryonic material throughout the vicinity of a halo. We therefore investigate the effects of different means of treating rapidly cooling gas on the simulation results in some detail. This enables us to establish the region around galaxies over which the means of treating unresolved rapidly cooling gas no longer affects predictions for the intergalactic gas, allowing reliable predictions to be made for comparison with observations.
TheENZOsimulations bypass the problem of rapidly cooling gas
by simply not spatially resolving regions that would produce rapid gas cooling. This is possible because the Jeans length of the IGM well exceeds the scales of rapid gas cooling in collapsed haloes. Be-cause of its Lagrangian nature, however,GADGET-3 will inevitably
track regions of high gas density and rapid cooling, so that some means of gas removal is necessary. We implement gas removal
us-ing two methods. The first is a simplified prescription, ‘quick Lyα’ (labelled G30qLyαbelow), which converts all gas particles with an overdensity >1000 and gas temperatureT<105K into
colli-sionless particles (categorized as ‘star’ particles in the code), sig-nificantly speeding up the computation (Viel, Haehnelt & Springel
2004). We emphasize that this prescription is a computational trick and is not meant to represent actual star formation. The second method (G30sfnw) implements the multiphase star formation pre-scription of Springel & Hernquist (2003). Although designed to include winds, we turn off the wind option to compare with the
ENZOresults. Lastly, we also perform a simulation (G30sfw)
us-ing the GADGET-3 supernovae-driven wind model of Springel &
Hernquist (2003), as an exploration of the impact a wind may have on the properties of the gas surrounding the haloes compared with the non-wind case. This model assumes a wind velocity of 484 km s−1, where each galaxy has a mass outflow rate twice its
star formation rate, and the energy of the wind is equal to the en-ergy released by supernovae. The simulations are summarized in Table1.
2.2 Halo finding
Central to any statistical predictions of the properties of galaxies is the selection of simulated haloes meant to represent them. Various statistics are available to match haloes in a simulation volume to observed galaxies. The most straightforward is abundance match-ing. This involves simply matching simulated haloes to observed galaxies according to the rank order of the simulated halo masses and an observed extensive property of a galaxy, such as total lumi-nosity or velocity dispersion. Another method compares the clus-tering strengths of galaxies and simulated dark matter haloes. No method is perfect, however, as the definition of a halo must contain some element of arbitrariness. Allowing for feedback in the form of radiation and galactic winds further complicates any matching procedure. Which definition relates best to observed galaxies is a matter of contention which likely will not be resolved without a more complete theory of galaxy formation. Many aspects of these issues have been explored in the literature (e.g. Frenk et al.1988; Kravtsov et al.2004; Vale & Ostriker2006; Moster et al.2010; Behroozi, Wechsler & Conroy2013; Sawala et al.2014).
In this study, we focus our discussion on dark matter haloes in the mass range 11<log10(M/M)<12, although we shall
con-sider trends outside this range as well. Based on clustering strength and luminosity-limited number counts, Trainor & Steidel (2012) estimate that the galaxies in the sample of Rakic et al. (2012) from the Keck Baryonic Structure Survey occupy haloes with a minimum total mass (dark matter and baryons) of log10(M/M)>11.7±0.1
masses are also consistent with those inferred from the amount of HIabsorption arising from the circumgalactic gas of the galaxies
(Rakic et al.2013).
We use two different particle-based methods to select the haloes in the simulations: Friends-of-Friends (FOF; Press & Davis 1982;
Einasto et al.1984; Davis et al.1985)1and
HOP(Eisenstein & Hut
1998). We also introduce a new method that selects haloes based on the density field interpolated on to a grid. TheFOFalgorithm joins all particles within a given fixed distance of one another, usually set according to the mean distance between particles. A disadvantage of
FOFis that it sometimes links together sets of particles that to the eye
would be regarded as separate haloes joined by a bridge. TheHOP
algorithm is designed to overcome this difficulty, forming groups by jumping to particles in ever denser neighbourhoods until no denser neighbour may be found. The groups tend to be more isolated than found using theFOFalgorithm, although an allowance is made to
join separate clumps if bridged by regions above a given density threshold. TheHOPalgorithm shares withFOFthe advantage of being
scale-free, but relies on more parameters. In practice, however, it is the outer density threshold for inclusion in a group that is the primary parameter that defines the group catalogue. ForFOF,
we adopt the standard linking length of 0.2 the mean interparticle separation. ForHOP, we takeδouter=80, which we find gives good
agreement with theFOFhalo numbers. The remaining parameters are set in accordance with the recommendations in the documentation accompanying theHOPsource code.2
The force softening scale for theGADGET-3 runs is 1.4 kpc
(co-moving). SinceENZOuses the PM method, the force resolution is
limited to two grid zones, or 118 kpc (comoving), adequate for resolving the Jeans length of the photoionized gas. The minimum virialized3halo mass achievable in theENZOcomputation in a single
cell is thus 18π2(m
c+mg)=1.4×10⁹M. Allowing for a
mini-mum of 27 cells to resolve a virialized halo in the gridded density field corresponds to a minimum mass of 3.7×10¹⁰M
. Much lower mass haloes are achievable in theGADGET-3 run (and theENZO
run, if using adaptive mesh refinement) in principle, but not neces-sarily if the haloes are to avoid being underresolved or overrelaxed in IGM simulations. Further details on this point may be found in the appendix.
3 H A L O C ATA L O G U E S
3.1 Baryon mass fraction in haloes
We now turn to describing the properties of the dark matter haloes in our simulations, before going on to discuss the gaseous environ-ments of the haloes in Section 4.
As most of the literature on haloes uses dark matter only simula-tions, the total halo mass (dark matter and baryons) is often scaled from the dark matter component assuming a uniform mass ratio of
1We use a publicly available code athttp://www-hpcc.astro.washington.edu/
tools/fof.html.
2We take Ndens = 64, Nhop = 16, Nmerge = 4 with δ outer = δsaddle/2.5 = δpeak/3, using the quantities defined in Eisenstein & Hut (1998).
[image:4.595.310.550.57.240.2]3Haloes with central dark matter densities exceeding the virialization den-sity will be referred to as ‘virialized’; this is not meant to imply the haloes are necessarily in virial equilibrium. The virial massMVis the mass con-tained within the virial radius, defined here as the radius within which the average dark matter overdensity is 18π2relative to the background dark matter density.
Figure 1. Difference between total halo massMTotand rescaled dark matter halo massMh assuming the cosmic mean mass ratio of baryons to dark matter. Shown atz=2, 3, 4, 5, 8 and 10 for haloes found usingFOFin a GADGET-3 run. The error bars indicate the 1σ spread in differences atz=5 and 10.
baryons to dark matter equal to the mean cosmic value,b/(m−
b). We first test this assumption in Fig.1by applyingFOFto the GADGET-3 simulation G30qLyαfor a range of redshifts. (Note the
results are nearly identical for the G30sfnw simulation, which we do not show here.) The rescaled halo massesMhare scaled from the
dark matter assuming that the cosmic baryon-to-dark-matter-mass ratio, and the actual halo massesMTot, given by the combined mass
of the dark matter, gas and star particles in the model, are found to agree closely over most of the halo mass range.
At the low-mass end, however, discrepancies arise, with the ac-tual mass systematically smaller than the rescaled mass, although with wide scatter. This difference arises primarily from heating by the UV background, increasing the thermal gas pressure and so impeding the inflow of the gas (e.g. Efstathiou1992; Okamoto, Gao & Theuns 2008). The difference is small at z= 10 and 8, but byz=6 the discrepancy exceeds 10 per cent, with the range in discrepant masses systematically increasing with decreasing red-shift. Byz=2, the discrepancy exceeds 10 per cent for haloes less massive than 4×10⁹M
, corresponding to a characteristic tem-perature of T 50 ×103K, comparable to the temperature of
reionized intergalactic gas, including the enhanced heating rate as the UV metagalactic ionization background hardens, adiabatically compressed to virial densities. The effect of this redshift-dependent baryonic physics suggests that the dimensionless mass function shape is not universal to a precision better than 15 per cent at the low halo mass end at these redshifts, even in the absence of super-novae feedback. With this mass discrepancy at the low-mass end in mind, unless stated otherwise, halo masses in the remainder of this paper refer to values rescaled from the dark matter component as-suming a uniform baryon-to-dark-matter ratio at the cosmic mean value. As we focus primarily on halo masses in the mass range 11<log10(M/M)<12, this should be a reasonable
approxima-tion.
3.2 Halo mass function
The halo mass functions obtained by runningFOFandHOPon the
G30qLyαGADGET-3 dark matter particles are shown in Fig.2. We
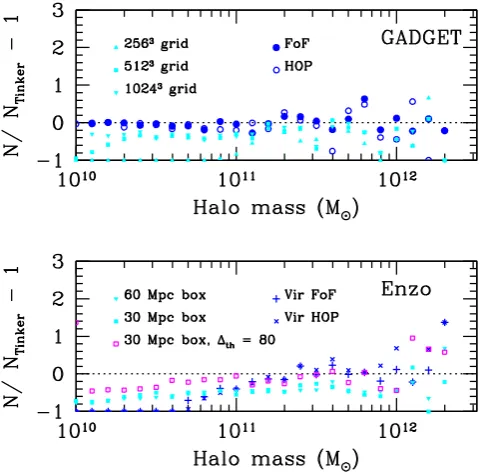
Figure 2. Halo mass distribution function atz =2, 3, 4 and 5, for the G30qLyαGADGET-3 simulation. Upper panel: number of haloes found using FOF(solid; magenta and blue, alternated for clarity) andHOP(dashed; green and cyan, alternated for clarity), along with the expected number using the fit of Tinker et al. (2008, black), with the sets of curves increasing at the high-mass end fromz=5 to 2. The simulation results correspond to the total halo mass scaled from the dark matter component, assuming the cosmic mean mass ratio of baryons to dark matter. Lower panels: the fractional deviation of simulation halo counts from the model of Tinker et al. (2008), for the FOFhaloes (circles) andHOPhaloes (squares). The error bars are Poisson. The dashed lines show the expected counts using the fitting formula of Reed et al. (2007).
Tinker et al. (2008) for overdensity=200 haloes4(solid black
curves in upper panel), allowing for redshift-dependent coefficients. Since this fitting formula was based on spherical overdensity haloes and the redshift dependence was limited to 0< z <2.5, we also compare with the fitting formula of Reed et al. (2007) in the lower panels of the figure. This is based on haloes with masses 105–
1012h−1M
, identified over the redshift interval 0< z <30 using
FOF with a linking length ofb= 0.2. The expected counts were
generated using theGENMFfitting formula code provided by Reed
et al. (2007), adjusted to our cosmological parameters. Since we search for haloes using only the dark matter component, as noted earlier the total mass of the haloes is found by allowing for a baryon component at the cosmic mean ratio of baryons to dark matter. This matches the halo mass definitions of Tinker et al. (2008) and Reed et al. (2007).
4The halo mass is defined as the mass contained within a spherical surface centred on the halo and having an average internal overdensity 200 times the cosmic mean density. The halo masses using this definition well match those usingFOFwithb=0.2 (Cole & Lacey1996; Tinker et al.2008).
Figure 3. As for Fig.2, except now showing the halo mass distribution function for the E30_512ENZOrun. Note that the estimated minimal resolv-able halo mass in this unigrid simulation is 4×10¹⁰M
. In the lower panels, the halo masses for ‘profiled’ virialized haloes are shown by ‘×’s forFOFhaloes, and by ‘+’s forHOPhaloes (see text for further details).
TheFOFhalo mass distribution in Fig.2agrees very closely with
the fitting formula of Tinker et al. (2008), within the scatter, for halo massesM>2×10⁹M
. The scatter sometimes exceeds the Poisson errors, based on the number of haloes found in a mass bin, but excess scatter is expected from large-scale structure, especially for the rarer haloes. Atz=4 and 5, the halo numbers continue to agree well with the Tinker et al. (2008) fitting formula, but deviate from the Reed fitting formula, which differs from the number of haloes we obtain by as much as∼50 per cent at the high-mass end, suggesting the fitting formula coefficients may not extend well to the different cosmological and power spectrum parameters we used, which more closely agree with those of simulations included in the Tinker et al. (2008) analysis.
The halo mass function for theHOPhaloes is remarkably sim-ilar to theFOFhalo mass function, within the scatter. There is an
∼20 per cent excess for 109<M<1010M
atz=2, bringing the numbers more closely in line with the Tinker et al. (2008) halo mass function. None the less, the differences in the counts suggest that the algorithms are not always identifying the halo masses consistently. We return to this point below.
The halo mass functions from the E30_512 ENZO simulation,
shown in Fig.3, also generally agree with the Tinker et al. (2008) mass function for haloes withM>2×10¹⁰M
forz=2 and 3, although with considerable scatter. This mass threshold is compa-rable to the minimum mass for achieving a virialization density in 15 contiguous cells. The agreement extends down to 4×10⁹M
[image:5.595.47.283.55.370.2]
generally agree, but vary at the∼20 per cent level for halo masses below 1010M
. The more conservative halo resolution requirement of 27 contiguous mesh zones requires a minimum virialized halo mass ofM>3.7×10¹⁰M
, and we take this to be representative of the resolvable halo mass in the simulation.
Finally, we also ‘profile’ the haloes in the E30_512ENZO
simu-lation by first constructing spherical density profiles centred on the densest dark matter point in a halo, and then computing the virial mass of the halo by scaling from the dark matter mass to account for the baryonic component. The profiled results for virialized haloes are shown as ‘×’s for theFOFhaloes, and ‘+’s for theHOPhaloes in
the lower panels of Fig.3. The number of virialized haloes falls off abruptly below 1011M
relative to the Tinker et al. (2008) mass function. As for theGADGET-3 haloes, the numbers between theFOF
andHOPhaloes do not precisely match.
3.3 Minimum halo mass consistently identified byFOF AND HOP
The principal source of the discrepancy between the halo mass distributions produced by different halo-finding algorithms for well-resolved haloes is generally not that different haloes are identified (although this may occur in unusually complex regions of massive mergers). Instead, different algorithms will typically assign different masses to the same haloes (e.g. Cohn & White2008). However, provided these algorithms agree on the halo centres about which any subsequent radial density profiles are constructed, rank ordering the haloes by their estimated virial mass should provide a stable basis for comparing with observed galaxies; this approach will be largely independent of the means used for identifying the haloes. In this sub-section, we therefore examine the minimum halo mass for which
FOFandHOP, as applied to theENZOdata, produce identical virial
masses. Note that sinceGADGET-3 resolves halo density profiles to smaller scales thanENZO, the corresponding minimum halo mass of GADGET-3 haloes will be smaller. We therefore confine our discussion
of the minimum consistently identified halo mass to theENZOdata
only.
We first compare the masses of individual haloes identified by bothFOFandHOPby one-to-one matchingHOPandFOFhaloes
identi-fied in the E30_512ENZOsimulation. We achieve this by searching for the nearestHOP halo within the virial radius of an FOF halo.
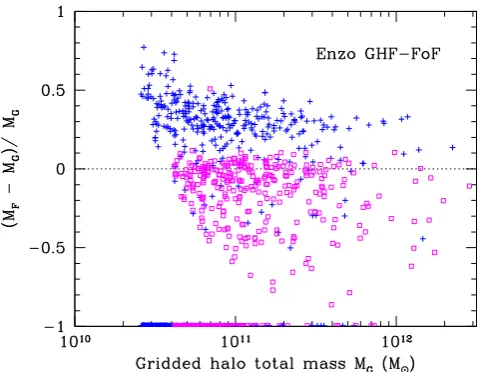
A comparison between the halo masses is shown in Fig.4. The
HOPhalo mass generally agrees well (to within around 20 per cent)
with theFOFhalo mass below 1011M. At higher masses, however,
theHOPhalo masses are increasingly low compared with the
cor-respondingFOFmass, consistent withHOP’s breaking up chains of
particles thatFOFlinks together into the same halo. This shows that,
while the halo finders identify the same peaks, they associate some-what different particles to the resulting haloes. As a consequence, theFOFandHOPhaloes do not maintain the same rank ordering by
mass, with a spread in mass difference of around 20–60 per cent, as shown in the lower panel of Fig.4. In the absence of a more precise definition of halo mass, this partially undermines the use of rank ordering when associating simulated haloes with observed galaxy properties.
[image:6.595.309.549.64.293.2]The virial mass (which we obtain by profiling the haloes in the manner described previously) offers a much better definition for this purpose, since the rank ordering is preserved by the different halo finders above a minimum halo mass. To demonstrate the stability of the virialized halo masses against the choice of halo finder for sufficiently massive haloes, we one-to-one match virialized haloes found byFOFandHOP. Atz=3, nearly one-third of the virialized
Figure 4. The difference between theFOFandHOPhalo masses from the E30_512ENZOrun as a function ofFOFhalo mass. The halo match is based on finding theHOPhalo which lies within the virial radius of a givenFOFhalo with the most similar mass. The comparison is shown atz=2, 3, 4 and 5. Upper panel: mean difference in the halo masses. Lower panel: the standard deviation in the difference between halo masses.
FOF haloes have no matching virialized HOP halo located within
the virial radius of theFOFhalo. Conversely, nearly one-quarter of virializedHOPhaloes have no matching virializedFOFhalo. Almost
all the unmatched haloes have masses below 2×10¹¹M
. For the remaining majority of virialized haloes, the total halo masses within the virial radius computed from the density profiles centred on the density peak found by either halo finder agree almost exactly. Thus, the virial masses of essentially all virialized haloes with masses above 2×10¹¹M
agree, whether identified usingFOF or HOP.
Should future surveys extend measurements of circumgalactic gas to smaller halo masses, a grid code likeENZOwould then require higher spatial resolution than we have used, either using a finer top-grid or an adaptive mesh, going beyond the standard requirements for an IGM simulation.
3.4 Grid-based halo finder
An alternative approach to particle-based halo finders is to identify haloes on the dark matter density grid. For large simulations, this has the advantage of requiring far less data to be saved, particularly for a hydrodynamical grid code. Moreover, since the gravitational force is computed on a grid in mesh codes, haloes found from the gridded density field will more faithfully reflect the resulting mass concentrations.
Motivated by these considerations, we have developed a gridded density field halo finder (GHF) similar to the search for spherical overdensities inN-body data (Warren et al.1992; Lacey & Cole
Figure 5. Differential number counts of haloes atz=3 identified using a GHF based on the dark matter density field with a threshold density set at the virialization density, relative to the Tinker et al. (2008) fitting function. Upper panel: results for the G30qLyαGADGET-3 density field gridded on to meshes with 2563 (cyan triangles), 5123(cyan squares) and 10243 (cyan inverted triangles) cells. For comparison, the counts of haloes found using FOF(blue filled circles) andHOP(blue open circles) finders are also displayed. Lower panel: results for the haloes found from the dark matter density field for twoENZOsimulations of fixed resolution, but with comoving box sizes of 30 Mpc (cyan squares) and 60 Mpc (cyan inverted triangles). Also shown are the results for haloes found above a threshold overdensity of 80 (cf. 18π2) in the 30 Mpc box (magenta open squares). For comparison, the counts of virialized haloes found usingFOF(blue ‘+’s) andHOP(blue ‘×’s) are also shown.
(2) Working down the list from the highest peak, search among the next nearest layer of mesh cells for those with densities above a given threshold overdensityth. (3) If a cell incorporated on the
list appears on the list of density peak cells, remove it from the list of peaks. (It is assumed incorporated into the halo with a higher density peak.) (4) If the fraction of cells more overdense thanth
exceeds a given valuepth, repeat step 2 extending to the next layer;
otherwise, cease growing the halo and go to the next density peak on the list. Choosingth=178 will grow approximately spherical
virialized haloes.
The resulting halo counts are shown in Fig.5for the G30qLyα
GADGET-3 simulation (upper panel) and E30_512 and E60_1024
ENZOsimulations (lower panel). TheGADGET-3 dark matter particles
are gridded on to meshes with 2563, 5123and 10243 cells. The
halo counts lie 30–50 per cent lower than predicted by the Tinker et al. (2008) halo mass function, with the deficit increasing to-wards lower mass haloes. The agreement improves at the low-mass end with increasing mesh resolution, but otherwise the counts are largely insensitive to the regridding resolution. Haloes on a 5123
(2563) grid are recovered to 30–50 per cent down to 2×10¹⁰M
(2×10¹¹M
).
The number counts of haloes found from the gridded dark matter density field in theENZO512330 Mpc volume simulation likewise lie
systematically low compared with Tinker et al. (2008) by about 30– 60 per cent. Using the density field from a secondENZOsimulation
in a 60 Mpc box with the same grid resolution as for the 30 Mpc box simulation, and settingth=178, provides comparable halo
numbers to the 30 Mpc box, as shown in Fig.5. The halo numbers are reasonably well converged, so box size does not account for the differences. The discrepancy may be attributed in part to the difference in the extents of the haloes. Lowering the overdensity threshold fromth =178 to 80 provides much better agreement
with Tinker et al. (2008). As shown in the appendix, lowering this threshold increases individual halo masses, putting them into better agreement with the masses of the matchingFOFhaloes.
3.5 Observational prediction uncertainties due to uncertainty in halo mass assignments
Finally, we note that the sensitivity of halo mass rankings to the halo-finding algorithm introduces uncertainty into the assignment of halo masses to observed galaxies if abundance matching is used as a basis (see e.g. Sawala et al.2014, for several references to the literature on abundance matching). As we have discussed here, one way to approach the problem is to use only haloes well resolved within their virial radii, and then rank them by some fixed criterion like virial mass. Since different halo finders mostly identify the same structures when well resolved, the masses about the halo centres will generally agree. For this reason, we restrict our analysis in the next section to haloes with 11<log10(M/M)<12. How successful
this approach is at matching observed galaxies, however, remains an open question.
There are also a large number of lower mass haloes which do not have well-resolved virial cores in our simulations that may still be useful for statistical analyses. The uncertainty in the masses of these haloes will give rise to an uncertainty in any predicted properties of observed galaxies and their environments. An approximate means of estimating the impact of the uncertainty in halo mass on the dispersion in a predicted property is to average it over a Gaussian distribution, allowing that any given halo-finding algorithm may err in the assignment of halo massMhwith a standard deviation
σ(Mh)=βMh. We have found typical values ofβ=0.2–0.4 in our
analysis above (e.g. Fig.4). For a property that may be approximated as a power law in mass,f(Mh)∼Mhα, it is then straightforward to
show that in the limit|α(α−1)|β1, the mean is only quadrati-cally biased,f/fβ=0−1(1/2)α(α−1)β2, while the relative
standard deviation isσf/f |αβ|. As an example, the estimated
velocity dispersion of a halo,vrms∼(GMh/rV)1/2∼M 1/3 h , will be
biased low by 1 per cent, with a relative spread of 10 per cent, for
β=0.3. Since the actual halo mass probability distribution may have a broad tail, this approach may conservatively be regarded as providing a lower limit on the uncertainty.
4 I G M P R O P E RT I E S A R O U N D H A L O E S
4.1 Halo peculiar velocities
In this section, we now turn to analysing the properties of the gas around galaxy haloes with total masses 11<log10(M/M)<12,
corresponding to the haloes of galaxies with measured HI
absorp-tion in their environments. These haloes also tend to be relatively isolated, permitting clearly delineated radial profiles of the gas prop-erties to be constructed.
Figure 6. Convergence of the halo peculiar velocities (top panel) and in-ternal velocity dispersion of the gas (lower panel) for theENZOsimulations E30 512 (filled squares; blue) and E60 1024 (filled circles; black) atz=3, as a function of halo mass. Also shown are the values for halo masses us-ing a lower overdensity threshold of 80 in E30 512 (open squares; cyan). The results for haloes in theGADGET-3 simulation G30sfnw (open squares; magenta) agree well with the results for the correspondingENZOhaloes. The solid line in the lower panel showsvcirc/21/2, wherevcircis the circular velocity at the virial radius.
we address the radial scale over which the peculiar velocity field of a halo converges.
The convergence of the halo peculiar velocity and internal veloc-ity dispersionvrmsof the gas atz=3 is shown in Fig.6for GHF
haloes withth>178 for the E30 512 and E60 1024ENZOand the
G30sfnwGADGET-3 simulations. TheGADGET-3 data are binned on to
a 5123mesh to match the
ENZOspatial resolution. Doubling the box
size of theENZOsimulation from 30 to 60 Mpc (comoving) nearly doubles the peculiar velocities of the haloes, showing they have not converged. The halo peculiar velocity is independent of halo mass, showing the haloes behave as test particles in large-scale flows. The internal velocity dispersion of theENZOhaloes, in contrast, is well
converged with box size. The values for theGADGET-3 haloes agree
with those for theENZOhaloes for the corresponding mass bin, as
expected if both codes are producing the same structures for a given halo mass. Comparison with the halo circular velocity at the virial radius,vcirc=(GMh/rV)1/2, shows that the gas is dynamically cool,
withvrmsvcirc/21/2.
4.2 Circumgalactic gas properties
The thermal and kinetic properties of the gas within the virial radius of haloes atz=3 are shown in Fig.7. The results are averages over all haloes in mass bins of widthlog10Mh=0.1. The values shown
for theENZOruns (blue and black symbols) test the convergence of
the halo internal gas properties with box size for 30 and 60 Mpc (comoving) boxes. Results for the correspondingGADGET-3 runs
with star formation both without a wind (cyan squares) and with a wind (cyan crosses) in the 30 Mpc box, gridded on to a 5123mesh
[image:8.595.310.550.59.252.2]to match theENZO30 Mpc box, are shown for comparison.
Figure 7. Thermal and kinetic properties of the gas within the virial radius of haloes atz=3. Results shown for theENZOsimulations E30 512 (blue filled squares) and E60 1024 (black filled inverted triangles). Also shown are results for theGADGET-3 simulation G30sfnw with the gas interpolated on to a 5123cell grid (cyan open squares) and theGADGET-3 wind simulation G30sfw (cyan crosses). Clockwise from the top left, the panels show the gas mass fraction (the dotted line displays the cosmic mean), the mean mass-weighted temperature, the ratioβkin of the gas kinetic to thermal energies and the gas mass fraction with a temperature less than half the halo equipartition temperature. The solid line in the upper right panel is the predicted post-shock temperature as a function of halo mass.
The gas mass fraction for theENZOhaloes is well converged with
box size. ForMh>1012M, the gas mass fraction lies just above
the cosmic mean value (b/m0.164), increasing towards lower
masses, until 50 per cent overabundant forMh=1011Mhaloes.
By contrast, star formation in theGADGET-3 simulation G30sfnw
leaves behind only a small fraction of the baryons within the virial radius in the form of gas, the remainder having been converted into stars. Adding wind feedback in the G30sfw simulation balances the gas density at somewhat higher values.
The mean mass-weighted temperature of the gas is defined by (3/2)kTm/μmH=Eth/Mgas, whereEthis the total thermal energy
of the gas massMgaswithin the virial radius,μis the mean
molecu-lar weight for a fully ionized hydrogen and helium gas andmHis the
mass of a proton. The temperature is well converged for theENZO
simulations, as shown in Fig.7, although the convergence worsens for the lower mass haloes. The temperature of the more rarefied gas in theGADGET-3 simulations is considerably higher. For an adiabatic
shock, the post-shock temperature of a halo of massMhcollapsing
at redshiftzisTshock72.1(1+z)(Mh/106M)2/3(Meiksin2011).
The temperature in theGADGET-3 non-wind simulation G30sfnw lies
at about one-third this limit, suggesting that radiative losses have been moderately effective in cooling the post-shock gas. Allow-ing for a wind in simulation G30sfw produces somewhat higher temperatures. By contrast, the gas in theENZOsimulations shows
considerable cooling, but does not lead to runaway cooling on the resolution scale of the grid.
Almost all the gas in the ENZO haloes is colder than half the halo equipartition temperature Teq, defined by
(3/2)k/μmHTeq=GMh/rV. Nearly the same amounts are found
for theGADGET-3 haloes in simulation G30sfnw with halo masses
exceeding 4 ×10¹¹M
efficient, with only half the gas cooler than half the equipartition temperature. In the wind simulation G30sfw, the more massive haloes have a much smaller proportion of cool gas, with only one-third to one-half cooler than half the equipartition temperature.
The gas internal kinetic energy of a halo is defined byEK=
(1/2) dV ρg(vpec−vh)2, whereρgis the gas density,vpecis the
gas peculiar velocity andvhis the centre-of-mass peculiar velocity
of the gas in the halo. The ratioβkin=EK/Ethindicates the balance
between the kinetic and thermal energies of the gas. ForENZOhaloes
withMh>1012M, the energies are nearly in equipartition, with
the kinetic energy slightly larger. The ratio increases to factors of several towards the lower mass haloes. Comparison between the 30 and 60 Mpc boxes suggests thatβkinis not yet well converged,
with the value decreasing with increasing box size. For theGADGET-3
haloes, 0.5< βkin1, suggesting that the gas too rarefied to rapidly
cool and make stars reaches equipartition between the kinetic and thermal energies.
The large differences between theENZOand GADGET-3
circum-galactic gas properties demonstrate that the behaviour of the gas may not be reliably computed out with a specific star formation model, even before feedback effects are included. If the star for-mation efficiency moreover depends on the internal gas kinematic properties, then accurate predictions for the properties of circum-galactic gas pose a severe computational challenge, requiring both high spatial resolution to follow rapidly cooling gas as well as a large simulation volume to produce accurate gas flow fields.
4.3 Radial profiles
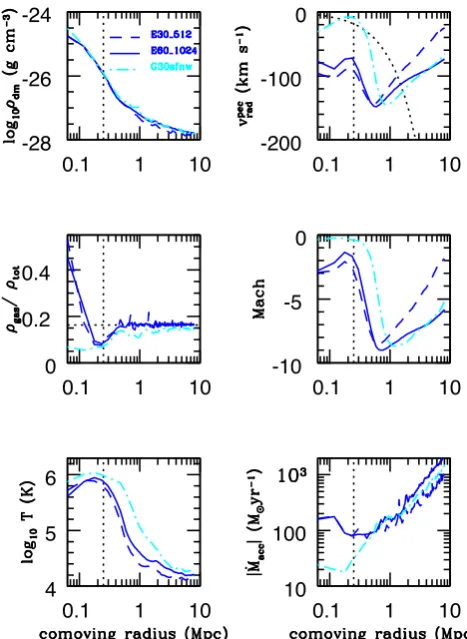
Radial profiles of the dark matter density and gas properties for a representative halo mass of 4.5×10¹¹M
are shown in Fig.8, for both theGADGET-3 andENZOhaloes in 30 Mpc boxes, as well asENZO
haloes in the 60 Mpc box. The profiles are averaged over all haloes within a mass bin of widthlog10M=0.1.
A detailed comparison between E30 512 and E60 1024 shows agreement in the dark matter profiles (upper-left panel) within twice the virial radius to 10 per cent, and at 30 per cent beyond in the sec-ondary infall region. The difference may be partly due to low num-bers since there are only 11 haloes in the mass bin. The dark matter profiles of haloes with somewhat lower masses (not shown) agree to 15 per cent between the two box sizes. TheGADGET-3 mean dark
matter profile agrees better with the larger boxENZOsimulation. The agreement demonstrates that bothGADGET-3 andENZOare
reproduc-ing similar dark matter structures as identified by halo mass, and that these structures are reasonably well converged with respect to simulation box size.
TheENZOsimulations have well converged on the physical state of
the intergalactic gas outside the turn-around radii of the haloes. For radial distancesr>2 Mpc (comoving), the gas density profiles agree to within 10 per cent and the temperatures to better than 30 per cent (middle- and lower-left panels). The peculiar inflow velocity and Mach number agree less well (upper- and middle-right panels), although we note somewhat smaller mass haloes show agreement over 2<r<4 Mpc to within∼30 per cent, but deviate at larger radii. The mass accretion rate (lower-right panel), defined in terms of the radial peculiar velocityvradpecas ˙Macc=4πr2ρgasv
pec
rad, is noisier, and
[image:9.595.306.540.55.375.2]shows agreement only at the 50 per cent level over 2<r<4 Mpc. At larger radii, the mean inflow velocity departs substantially between the two box sizes, showing poor convergence. This reflects the non-convergence of the large-scale peculiar velocity field noted in Section 4.1. We note that the instantaneous turn-around radius of the gas, where the gas breaks away from the Hubble expansion and
Figure 8. Mean radial profiles of halo properties atz=3 with total mass of 4.5×10¹¹M
, forGADGET-3 simulation G30sfnw (dot–dashed lines; cyan), andENZOsimulations E30 512 (dashed lines; blue) and E60 1024 (solid lines; blue). Clockwise from the upper left, the panels display the dark matter density, the gas peculiar velocity, the Mach number, the mass accretion rate, the gas temperature and the gas density. The vertical dotted lines in each panel show the virial radius of the haloes. The curved dotted line in the upper-right panel shows the Hubble expansion (as negative velocity): the intersection with the peculiar velocity curve indicates the instantaneous turn-around radius of the gas in the haloes, located atrt.a.6rV.
begins flowing inwards, is located atrt.a. 6rV as shown in the
top-right panel of Fig.8. This is close to the value∼4rVfor the
self-similar secondary infall of an adiabaticγ=5/3 collisional gas on to a collapsed dark matter halo in an Einstein–de Sitter universe (as inferred from table 8 of Bertschinger1985).
While the dark matter profiles agree between theGADGET-3 and ENZOhaloes, the gas profiles within the circumgalactic region show large differences. The Springel & Hernquist (2003) star formation prescription in theGADGET-3 simulation has removed most of the
baryons within the virial radius from the gas phase. A wide region of hot gas develops in theGADGET-3 haloes extending over∼3 virial
radii, as illustrated in Fig.9. By contrast, in theENZOhaloes, the
hot gas region is more compact, with the hot gas component is confined to the inner 1–2 virial radii. A consequence is a lower Mach number for the accreting gas within theGADGET-3 haloes, and
a more quiescent velocity field within and around the haloes. Dense pockets of cooling gas develop in theENZOhaloes, as illustrated in
Figure 9. The effects of the prescription for the treatment of unresolved, rapidly cooling gas on the gaseous environment of haloes, illustrated for representative haloes atz=3 with masses∼5×10¹¹MfromGADGET-3 andENZO. The boxes are 4 comoving Mpc on a side and centred on the haloes. Shown are slices of the gas temperature field and peculiar velocity flow relative to the halo centres of mass. The colour bars show log10T. An arrow of one axis tic unit in length corresponds to a velocity magnitude of 1000 km s−1. The black circles indicate the virial radii of the haloes. The panels show haloes in simulations, clockwise from the top left, G30sfnw, E30 512, G30qLyαand G30sfw. A broad region of hot rarefied and kinematically quiescent gas develops around the GADGET-3 haloes as a result of efficient removal of rapidly cooling gas, with enhanced energy input from a wind in simulation G30sfw. In theENZOsimulation, gas removal is suppressed by the limited spatial resolution, resulting in a more compact and kinematically active halo of multiphase gas.
Outside the turn-around radius, the GADGET-3 andENZOresults
agree well. The baryon fraction in theGADGET-3 haloes is found not to converge to the cosmic mean value to better than 10 per cent by a radial distance of 8 Mpc, as shown in Fig.8, suggesting that gas removal has been efficient in the surrounding smaller mass haloes. TheGADGET-3 temperature agrees best with the larger box ENZOsimulation, to within 30 per cent beyondr>3 Mpc. This may
partly be an effect of the gas removal in theGADGET-3 simulation,
leaving behind lower density but higher temperature gas. Achieving better agreement betweenENZOandGADGET-3 simulations appears
to require a specific model of star formation: the means of dealing with unresolved rapidly cooling gas has become a limiting factor in the predictive capacity of the simulations for intergalactic gas near the haloes.
A comparison of the radial profiles of the dark matter density and gas properties for 4.5×10¹¹M
haloes from the threeGADGET-3
simulations is shown in Fig.10. This directly compares the effect of different star formation prescriptions on the gas properties. The
dark matter density profiles are essentially unaffected by the mode of gas removal or the presence of a wind within the virial radius, but changes of a few tens of per cent appear in the secondary infall region beyond the virial radius. The gas density of the simulations without a wind lies below the cosmic value out to 8 Mpc, with the quick Lyαsimulation removing gas most efficiently. Invoking a wind slows the infall velocity of the gas, but has not produced outflow5in terms of the peculiar velocity. The position of the outer
turn-around radius of the gas remains unchanged. Less gas is re-moved from the central regions. A moderate amount of gas com-pression occurs beyond the virial radius, with the gas returning to
Figure 10. Mean radial profiles of halo properties for GADGET-3 haloes atz=3 with total masses of 4.5×10¹¹M
, for simulations G30sfnw (solid lines; blue), G30qLyα(dashed lines; cyan) and G30sfw (dot–dashed lines; magenta). Clockwise from the upper left, the panels display the dark matter density, the gas peculiar velocity, the gas temperature and the gas density. The vertical dotted lines in each panel show the virial radius of the haloes. The curved dotted line in the upper-right panel shows the Hubble expansion (as negative velocity): the intersection with the peculiar velocity curve indicates the instantaneous turn-around radius of the gas in the haloes, located atrt.a.6rV.
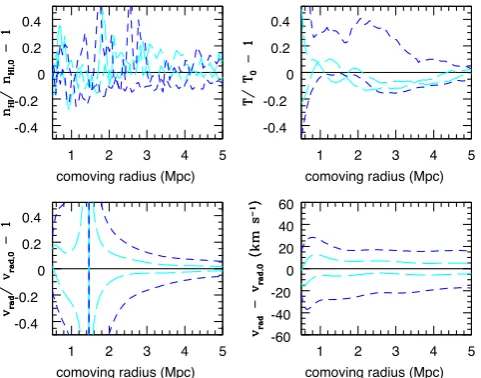
Figure 11. Percentage differences of halo mean radial profiles from 1011.55M
ENZO haloes in 60 Mpc box, for haloes with mass offsets log10Mh=log10Mh−11.55= ±0.1 (cyan long-dashed lines) and±0.3 (blue short-dashed lines). Anticlockwise from top right, the panels display relative differences in the gas temperature, the neutral hydrogen fraction and the radial velocity. The absolute velocity difference is shown in the lower-right panel. The divergence in the relative velocity error corresponds to the instantaneous turn-around radius at1.4 Mpc.
the cosmic mean baryon density (shown by the horizontal dotted line) beyond the turn-around radius.
Lastly, we note that uncertainty in the simulated halo masses assigned to galaxies will introduce further uncertainty into the predicted properties of the intergalactic gas near the haloes. The magnitude of the uncertainty is illustrated in Fig.11 for a GHF
ENZOhalo mass of 1011.55M, showing the consequences of
as-signing gas properties corresponding to haloes with mass offsets of
log10Mh= ±0.1 and±0.3. A halo offset of±0.1 is representative
of the differences in mass assigned to haloes by the different halo-finding algorithms we used. The resulting neutral hydrogen density
nHIand temperatureTdifferences are 10–20 per cent atr>1.5 Mpc.
A mass offset of±0.3 produces differences of 20–40 per cent. Com-parable relative differences are found for the total radial velocity except near the turn-around radius. The absolute radial velocity off-sets range up to 20–30 km s−1. The relatively modest differences in
the physical properties of the intergalactic gas near haloes (at scales above the turn-around radius) for a range of halo masses suggest good tolerance of the predictions to the larger uncertainties in the halo masses. The converse is that the local circumgalactic gas prop-erties can provide only a crude estimate of the masses of the central haloes.
5 S U M M A RY A N D C O N C L U S I O N S
We investigate how well simulations designed to study the IGM reproduce the physical properties of the gas surrounding galaxy haloes, motivated by recent observations of the gaseous environ-ments of redshift z∼ 2–3 galaxies through HI absorption-line
measurements (Steidel et al. 2010; Crighton et al. 2011; Rudie et al.2012; Prochaska et al.2013). To do so, we perform compar-isons of the dark matter and gaseous properties of moderate redshift haloes, with 2< z <5, using two different numerical simulation codes,GADGET-3 andENZO. We have examined two separate issues,
agreement in the halo masses and abundances, necessary for reli-ably selecting simulated haloes to represent observed galaxies, and agreement in the physical properties of the gas around the haloes. We summarize our results on these topics separately.
Our main results concerning halo selection are as follows.
(1) For halo masses exceeding 1010M
, rescaling the dark mat-ter halo mass by the mean cosmic baryon to dark matmat-ter density ratio reproduces the total halo mass (comprised of dark matter and baryons) to a few per cent accuracy. We find, however, that the rescaling overestimates the true combined dark matter and baryon mass of haloes with masses below 1010M
by as much as 15 per cent, with the discrepancy increasing at decreasing red-shifts. This difference is due to the partial loss of gas in the smaller mass haloes as a result of photoionization heating (e.g. Okamoto et al.2008).
(2) Reasonable agreement is obtained between the numbers of
FOFandHOPhaloes found in theGADGET-3 simulation and the
corre-spondingENZOsimulation. The halo mass functions agree with that
of Tinker et al. (2008) to about 10–30 per cent accuracy over the total halo mass range 109<M
h<1011Mfor theGADGET-3 haloes
and over 1010<M
h<1011Mfor theENZOhaloes, although the
halo abundances evolve somewhat more slowly with redshift for
z >2 (beyond the redshift range considered by Tinker et al.2008). There is substantial scatter, 30–50 per cent differences from the fit-ting formula, at higher masses due to the low numbers of haloes and cosmic variance in our 30 Mpc (comoving) simulation boxes.
(3) A one-to-one matching of FOFand HOPhaloes in theENZO
30 Mpc box simulation shows that theHOPhalo masses are typically
20 per cent smaller than theFOFhalo masses below 1011M
, nearly independent of redshift. The discrepancy increases to as much as 80 per cent low for 1012M
FOF haloes. Restricting the analysis
[image:11.595.44.285.367.556.2]masses within the virial radii are identical. To assign simulated halo masses to observed galaxies based on abundance matching, we thus recommend using only simulated haloes resolved within their virial radii, preferably by at least 5000 particles to ensure both high resolution and negligible dynamical overrelaxation, and ranking the haloes by their virial masses.
(4) Haloes with masses below 2×10¹¹M
were often not well resolved within their virial radii by our simulations. TheFOFand
HOPhalo masses were offset by∼20 per cent, and the dispersion in
the mass differences wasσ(Mh)=βMhwithβ∼0.2–0.4.FOFand HOPdo not preserve the rank ordering of haloes by mass at this level,
undermining the prediction of galaxy properties to much better than this level of accuracy when halo masses are assigned to galaxies by abundance matching. In this case, we suggest that a lower limit to the error in a predicted galaxy property may be estimated by averaging the property and its variance over a Gaussian distribution in halo mass withβ=0.2–0.4. A halo property varying asf(Mh)∼Mhα
will then have a relative uncertainty of at leastσf/f |αβ|.
(5) We introduce a new method for identifying haloes based on a gridded dark matter density field, similar to the spherical overden-sity method forN-body particles. Haloes are found on the gridded density field by identifying contiguous regions with overdensity above a given threshold levelth. A practical benefit of the method
is that it does not require the particle data to be saved from a simula-tion to find haloes, a particular advantage for massive simulasimula-tions. Forth=178, the halo masses are about 30 per cent lower than the FOFmasses for the same identified haloes, but the masses come into
good agreement if the density threshold is lowered toth =80.
Similarly, forth = 178, theGADGET-3 halo counts are offset by
∼30 per cent below the halo mass function of Tinker et al. (2008), and by∼50 per cent for theENZOhaloes. Using insteadth =80
brings the counts into good agreement with Tinker et al. (2008).
Our main results concerning the gas properties are as follows.
(1)GADGET-3 and ENZO identify similar halo structures for a
given halo mass for haloes with well-resolved virial cores. For our simulations, these correspond to haloes with masses exceeding 2×10¹¹M
. The dark matter density profiles averaged over the haloes agree typically to 10–30 per cent over radiirV<r<8 Mpc
(comoving) from the halo centres of mass. The mode of gas removal, however, affects the dark matter density profile in the secondary in-fall region beyond the virial radius by a few tens of per cent. The internal velocity dispersion of the gas in the haloes is found to agree closely between theGADGET-3 andENZOhaloes. The peculiar
veloci-ties of the haloes themselves are poorly converged with box size, as expected since the velocity power spectrum has significant power on scales in excess of 100 Mpc, driving large-scale flows.
(2) There are pronounced differences in the circumgalactic gas properties between theGADGET-3 andENZOhaloes as a consequence of the differences in the treatment of unresolved rapidly cooling gas. TheGADGET-3 simulation converts most of the gas into collisionless
particles inside the haloes. The mass-weighted temperature of the remaining gas within the virial radius is substantially higher than that of the gas in the correspondingENZOhaloes. A broad
high-temperature region extending over 2–3 virial radii develops around theGADGET-3 haloes. TheENZOsimulations suppress the rapid
cool-ing of gas because of their restricted spatial resolution. The hot regions of the haloes are more compact than in theGADGET-3 haloes, and develop a multiphase medium including cooling gas within the virial cores. We conclude that any predictions of the physical properties of the circumgalactic gas may be made only within the context of a specific gas removal prescription.
(3) Outside the turn-around radii, the gas density and temper-ature agree to 30 per cent between comoving box sizes of 30 and 60 Mpc, and to 40 per cent between theGADGET-3 andENZO
simula-tions, without reaching better than 10 per cent agreement until as far out as several turn-around radii. The physical properties of the gas at these distances may be reliably computed, although the treatment of rapidly cooling gas is still a limiting factor in the accuracy of the predictions out to several turn-around radii.
(4) The wind model we implemented in aGADGET-3 simulation
affects the circumgalactic gas, slowing the accretion but not pro-ducing outflow in terms of the peculiar velocity. It increases the extent of the hot haloes, doubling the gas temperature compared with the windless model beyond the turn-around radius, while the gas density converges to the cosmic mean value.
(5) A halo mass offset of±0.1 dex compared with a population of observed galaxies will introduce errors in the predicted neutral hy-drogen density, gas temperature and gas velocities of 10–20 per cent outside the turn-around radii of the haloes. An offset of±0.3 dex increases the errors to 20–40 per cent. The high tolerance of the properties of the intergalactic gas near the haloes to the uncer-tain halo mass should permit predictions of the HIabsorption-line
properties of the gaseous environment of galaxies to good accuracy. Large discrepancies with observations would suggest the influence of a wind.
We conclude that galactic mass haloes with essentially the same dark matter properties are reproduced at 2 < z <5 byGADGET -3 and ENZOIGM simulations in 30 Mpc comoving volumes and
a spatially resolved Jeans length. Although the masses assigned to haloes are sensitive to the finding algorithm, the different halo-finding algorithms we consider identify largely the same systems for halo masses exceeding∼4×10¹⁰M
, and essentially identical systems for masses exceeding∼2×10¹¹M
. The physical prop-erties of the intergalactic gas surrounding theGADGET-3 andENZO
haloes with masses exceeding∼2×10¹¹M
are found to agree to 30–40 per cent beyond the turn-around radii. At smaller radii, theGADGET-3 andENZOhaloes show substantial differences in the
gas density and temperature as a consequence of the differences in the treatment of rapidly cooling gas on spatially unresolved scales. We thus conclude that generic IGM simulations are able to make accurate predictions for the intergalactic gas properties of observed moderate-redshift galaxies beyond the halo turn-around radii, but the properties of circumgalactic gas are highly dependent on the choices of star formation and feedback implementation.
AC K N OW L E D G E M E N T S
This work used the DiRAC Data Analytic system at the University of Cambridge, operated by the University of Cambridge High Per-formance Computing Service on behalf of the STFC DiRAC HPC Facility (www.dirac.ac.uk). This equipment was funded by BIS Na-tional E-infrastructure capital grant (ST/K001590/1), STFC capi-tal grants ST/H008861/1 and ST/H00887X/1, and STFC DiRAC Operations grant ST/K00333X/1. DiRAC is part of the National E-Infrastructure. Additional computations were performed on fa-cilities funded by an STFC Rolling-Grant and consolidated grant. AM thanks B. Smith for information regarding details of the oper-ations ofYT(http://yt-project.org), used for analysing some of the
ENZOsimulations, and J. Cohn and M. White for helpful