10.1101/gr.126417.111
Access the most recent version at doi:
2012 22: 467-477 originally published online November 21, 2011
Genome Res.
Colm E. Nestor, Raffaele Ottaviano, James Reddington, et al.
content of human genes
Tissue type is a major modifier of the 5-hydroxymethylcytosine
Material
Supplemental
http://genome.cshlp.org/content/suppl/2011/11/21/gr.126417.111.DC1.html
References
http://genome.cshlp.org/content/22/3/467.full.html#ref-list-1
This article cites 49 articles, 14 of which can be accessed free at:
Open Access
Open Access option.
Genome Research
Freely available online through the
License
Commons
Creative
http://creativecommons.org/licenses/by-nc/3.0/.
described at
a Creative Commons License (Attribution-NonCommercial 3.0 Unported License), as
). After six months, it is available under
http://genome.cshlp.org/site/misc/terms.xhtml
first six months after the full-issue publication date (see
This article is distributed exclusively by Cold Spring Harbor Laboratory Press for the
Service
Email Alerting
click here.
top right corner of the article or
Receive free email alerts when new articles cite this article - sign up in the box at the
Tissue type is a major modifier of the
5-hydroxymethylcytosine content of human genes
Colm E. Nestor,
1,2Raffaele Ottaviano,
1,2James Reddington,
2Duncan Sproul,
1,2Diana Reinhardt,
2Donncha Dunican,
2Elad Katz,
1J. Michael Dixon,
1David J. Harrison,
1and Richard R. Meehan
1,2,31
Breakthrough Breast Cancer Research Unit and Division of Pathology, University of Edinburgh, Western General Hospital, Edinburgh
EH4 2XU, United Kingdom;
2MRC Human Genetics Unit, Institute of Genetics and Molecular Medicine, Western General Hospital,
Edinburgh EH4 2XU, United Kingdom
The discovery of substantial amounts of 5-hydroxymethylcytosine (5hmC), formed by the oxidation of 5-methylcytosine
(5mC), in various mouse tissues and human embryonic stem (ES) cells has necessitated a reevaluation of our knowledge of
5mC/5hmC patterns and functions in mammalian cells. Here, we investigate the tissue specificity of both the global levels
and locus-specific distribution of 5hmC in several human tissues and cell lines. We find that global 5hmC content of
normal human tissues is highly variable, does not correlate with global 5mC content, and decreases rapidly as cells from
normal tissue adapt to cell culture. Using tiling microarrays to map 5hmC levels in DNA from normal human tissues, we
find that 5hmC patterns are tissue specific; unsupervised hierarchical clustering based solely on 5hmC patterns groups
independent biological samples by tissue type. Moreover, in agreement with previous studies, we find 5hmC associated
primarily, but not exclusively, with the body of transcribed genes, and that within these genes 5hmC levels are positively
correlated with transcription levels. However, using quantitative 5hmC-qPCR, we find that the absolute levels of 5hmC for
any given gene are primarily determined by tissue type, gene expression having a secondary influence on 5hmC levels.
That is, a gene transcribed at a similar level in several different tissues may have vastly different levels of 5hmC (
>
20-fold)
dependent on tissue type. Our findings highlight tissue type as a major modifier of 5hmC levels in expressed genes and
emphasize the importance of using quantitative analyses in the study of 5hmC levels.
[Supplemental material is available for this article.]
Typically, mammalian DNA methylation involves the covalent attachment of a methyl group to the 5-position of cytosine in a CpG dinucleotide by a member of the DNA methyltransferase (DNMT) family of enzymes. DNA methylation patterns are estab-lished in early development by the de novo methyltransferases, DNMT3A/B, and maintained after subsequent cell divisions by the maintenance methyltransferase, DNMT1 (Bird 2002; Wu and Zhang 2010). The ability to establish and maintain DNA methyl-ation patterns is essential for normal development in mammals (Li et al. 1992). Specifically, DNA methylation is involved in the maintenance of genome integrity by silencing transposable ele-ments (Walsh et al. 1998), the process of X-inactivation in females (Lock et al. 1987; Sado et al. 2000), regulation of allele-specific expression at imprinted loci (Plass and Soloway 2002), and may be involved in the regulation of single-copy gene expression (Borgel et al. 2010). The genomic distribution of CpG methylation in the human genome is highly non-random; whereas the majority of CpGs are methylated, regions of high CpG density, termed CpG islands, which often colocalize with gene promoters, are typically unmethylated. How this dichotomous pattern of CpG methyla-tion is maintained is unclear.
In a groundbreaking study, the DNA of mouse Purkinje neu-rons and embryonic stem (ES) cells were found to contain
signifi-cant levels of the modified base 5-hydroxymethylcytosine (5hmC) (Kriaucionis and Heintz 2009). A complementary study identified the ten-eleven translocation (TET) protein, TET1, as an iron- and
a-ketoglutarate (a-KG)-dependent dioxygenase responsible for catalyzing the hydroxylation of 5mC to 5hmC (Tahiliani et al. 2009). Subsequent studies have reported significant levels of 5hmC in many other mouse and human tissues (Globisch et al. 2010; Szwagierczak et al. 2010; Jin et al. 2011) and confirmed TET2 and TET3 as possessing enzymatic properties similar to that of TET1 (Ito et al. 2010; Koh et al. 2011). Interestingly, the genesTET1
andTET2were first identified as common targets of mutation in Acute Myeloid Leukaemia (AML). Recently, Figueroa et al. (2010) showed that mutation of the isocitrate dehydrogenase genesIDH1
andIDH2led to the aberrant production of 2-hydroxyglutarate (2-HG), a metabolite that inhibits TET2 enzymatic activity, resulting in a hypermethylated promoter phenotype in AML tu-mors carryingIDH1/2mutations. This hypermethylated promoter phenotype overlapped with AML tumors carrying aTET2 muta-tion only, highlighting a potential role for the TET family of pro-teins in the epigenetic dysregulation observed in many cancers (Figueroa et al. 2010). In addition,Tet1knockdown in mouse ES cells resulted in de novo methylation of the transcription start site (TSS) of more than 100 genes, although the gain in 5mC was modest (Williams et al. 2011).
Many of the techniques commonly used to assay 5mC, in-cluding conventional methyl-sensitive restriction digest and the widely used technique of bisulfite sequencing, are incapable of distinguishing between 5mC and 5hmC (Huang et al. 2010; Jin et al. 2010; Nestor et al. 2010). As such, the discovery of 5hmC
3Corresponding author.
E-mail richard.meehan@hgu.mrc.ac.uk.
necessitates not only its characterization in mammalian cells, but also reevaluation of previously published 5mC data (Dahl et al. 2011). The recent development of 5hmC-specific antibodies and 5hmC-sensitive restriction digest-PCR (5hmC-qPCR) assays has allowed for determination of genome-wide patterns and locus-specific amounts of 5hmC levels, respectively (Davis and Vaisvila 2011; Jin et al. 2011).
The biological function of 5hmC is unknown. However, several very recent studies of the genome-wide distribution of both 5hmC and TET1-binding in mouse ES cells have begun to illumi-nate potential roles of both the mark and the proteins, which in some cases may not only be separate, but conflicting. A role for 5hmC as an intermediate in DNA demethylation has been widely postulated (Tahiliani et al. 2009; Wu and Zhang 2010). As 5hmC is poorly recognized by DNMT1 (Valinluck and Sowers 2007), methylation can be lost passively through successive cell divisions. However, the rapid loss of 5mC from the paternal pro-nucleus in the zygote and in primordial germ cells has long hinted at a process of active demethylation in mammals (Mayer et al. 2000; Oswald et al. 2000; Hajkova et al. 2002). It is hypothesized that conversion of 5mC to 5hmC may serve as the first step in such a pathway by providing a substrate for downstream repair pathways such as mismatch (MMR) or base-excision repair (BER), which ultimately replace 5hmC with cytosine (C) (Wu and Zhang 2010). In support of this hypothesis, two recent reports have shown that the rapid loss of 5mC from mouse paternal pro-nuclei is accompanied by an accumulation of genome-wide 5hmC (Iqbal et al. 2011; Wossidlo et al. 2011). However, the failure to find many of the predicted intermediates of an active oxidative demethylation pathway by mass-spectrometry analysis of normal mouse brain tissues chal-lenges the existence of such a mechanism (Globisch et al. 2010). The observations that 5hmC is enriched in the gene body of active genes in mouse cerebellum (Song et al. 2010) and cannot be bound by transcriptionally repressive methyl-CpG binding domain (MBD) proteins in vitro (Valinluck et al. 2004; Jin et al. 2010) strongly suggested a role for 5hmC in the regulation of transcrip-tion. Gene-body 5hmC levels may regulate the transcription rate by modifying the accessibility of genic chromatin to transcrip-tional machinery or by inhibiting binding of repressive methyl-CpG binding proteins (MBDs). However, work on mouse ES cells suggests that the relationship between 5hmC and/or TET1 with transcription is far more complex (Pastor et al. 2011; Williams et al. 2011; Wu et al. 2011a,b). TET1 enrichment was often observed at the transcription start site (TSS) of genes with high CpG density (HCP) promoters marked by the bivalent histone signature of histone 3 lysine 27 trimethylation (H3K27me3) and histone 3 ly-sine 4 trimethylation (H3K4me3). This gene set is enriched for transcriptionally repressed developmental genes. Moreover, the repressive activity of TET1 may be independent of its catalytic role, because several genes up-regulated uponTet1knockdown in WT ES cells were also up-regulated in ES cells lacking DNA methylation (Dnmt1/3a/3b / ) (Williams et al. 2011). Consistent with these observations, Wu and colleagues found 5hmC to be enriched in the bodies of highly expressed genes and at the TSS of transcrip-tionally inactive genes (Wu et al. 2011a). However, two simulta-neous studies failed to report a significant association between genic 5hmC and transcription levels or RNA polymerase II activity (Pastor et al. 2011; Williams et al. 2011).
The majority of recent genome-wide studies of 5hmC and TET1 have used the same model system, mouse ES cells. Thus, the nature of locus-specific patterns of 5hmC within and between normal tissues remains unknown. Here, we use tiling microarrays
and 5hmC-qPCR to investigate both global 5hmC content and locus-specific patterns of 5hmC in several normal human tissues. We find that unlike 5mC, global 5hmC content varies markedly between tissues and does not correlate with global 5mC content. Furthermore, the global 5hmC content of cell lines is markedly reduced compared with levels in the corresponding normal tissues. Significantly, we note thatTET1/2/3gene expression and conse-quently 5hmC content is rapidly and significantly reduced upon adaptation of cells from normal human tissue to cell culture. Using an 5hmC-specific antibody and tiling microarrays to profile locus-specific patterns of 5hmC, we found that 5hmC patterns are tissue-specific; allowing clustering of similar tissues based on 5hmC profiles alone. In addition, using RNA-seq data for normal human tissues, 5hmC was found to be enriched in the gene bodies of active genes, and the level of enrichment was positively correlated with gene expression levels. Significantly, however, we also find that for any given expressed gene, tissue type, not transcription level, is the major modifier of absolute levels of 5hmC.
Results
Global 5hmC content of human tissues is variable and does
not correlate with total mC content or
TET
gene expression
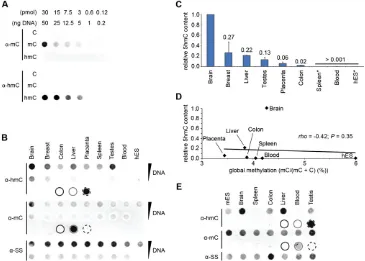
PCR products of the mouseTex19.1promoter in which each cy-tosine was either unmethylated (C), methylated (5mC), or hydroxymethylated (5hmC) were used to test the sensitivity and specificity of both thea-5mC anda-5hmC antibodies in immuno dot-blot assays. Both antibodies exhibited specificity to their re-spective marks and no cross-reactivity was observed, even at higher concentrations of DNA (Fig. 1A). The dynamic range of detection of 5hmC implies that this assay can be usefully employed to de-termine differences in the 5hmC content of different genomic DNA samples.of all threeTETgenes in 20 human tissues and human ES cells (Supplemental Fig. S2A). Each tissue cDNA sample was generated from RNAs pooled from at least three different individuals. The relative expression ofTET2andTET3between tissues was highly similar to that reported in mouse (Ito et al. 2010). Human ES cells are distinguished by their relative lack ofTET2andTET3 expres-sion, suggesting thatTET1may be the primary dioxygenase re-sponsible for generation of 5hmC in these cells. However, human
TET1expression was just twofold higher in ES cells compared with average expression in somatic tissues. This is markedly lower than the 10-fold difference inTet1expression observed between ES cells and somatic tissues in mouse (Ito et al. 2010). Our observation of
TET1expression in human tissues is consistent with a previous analysis ofTET1/2/3 gene expression in 24 human tissues that reportedTET1expression in half (12/24) of the tissues assayed (Lorsbach et al. 2003). Interestingly,TET1/2/3gene expression did not correlate with relative global 5hmC content (Supplemental Fig. S2B).
Cell culture results in a dramatic reduction of global
5hmC levels
Epigenetic dysregulation, including promoter hypermethylation and genome-wide hypomethylation, is a hallmark of many cancers
(Esteller 2007). Moreover, several recent studies have reported a direct link between TET inhibition and aberrant promoter hypermethylation in AML (Figueroa et al. 2010; Xu et al. 2011). Thus, we determined if global 5hmC levels in cell culture models of several human cancers differed from that observed in their corre-sponding non-cancerous tissues of origin.
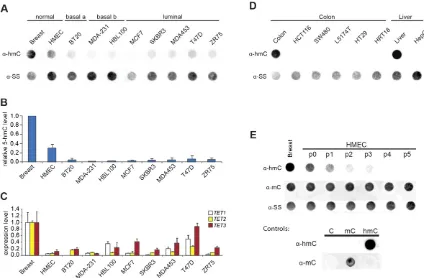
[image:4.612.125.490.72.333.2]We observed much lower global 5hmC in eight breast can-cer cell lines and one primary human mammary epithelial cell (HMEC) line relative to normal breast tissue (Fig. 2A,B). This re-duction of global 5hmC in human breast cell lines was mirrored by significantly reduced levels of transcripts for all threeTETgenes relative to levels in normal breast tissue (Fig. 2C). A similar re-duction in global 5hmC levels was observed in both colon and liver cancer cell lines relative to levels in the corresponding non-can-cerous tissues (Fig. 2D). Interestingly, DNA obtained from a pri-mary HMEC line 1 wk after establishment from normal breast tissue also showed a dramatic reduction in both global 5hmC content andTETgene expression, suggesting that conversion to cell culture may be sufficient to effect a global reduction in 5hmC levels (Fig. 2A–C). This marked reduction inTET1/2/3gene ex-pression in culture was not observed between normal breast tissue and breast tumors in three previously published independent microarray studies, suggesting that the observedTETgene down-regulation in culture may not be a cancer-associated process
Figure 1. Marked inter-tissue differences in global 5hmC levels. (A) Dot-blots of decreasing amounts of a PCR product of the mouseTex19promoter sequence in which all cytosines are either unmodified (C), methylated (5mC), or hydroxymethylated (5hmC), were probed witha-5hmC anda-5mC antibodies. Thea-5hmC anda-5mC antibodies are specific for their respective marks. (B) Duplicate dot-blots of DNA from human tissues and ES cells probed with antibodies specific to 5hmC or 5mC show that global 5hmC levels vary markedly between normal human tissues. Ana-ssDNA antibody was used to control for loading; 500 ng and 100 ng were loaded in theupperandlowerlanes, respectively. Ten nanograms of amplified mouseTex19.1
(Supplemental Fig. S3) (Richardson et al. 2006; Turashvili et al. 2007; Chen et al. 2010). To further investigate this hypothesis, we cultured cells from normal human breast tissue and analyzed the changes in both global 5mC and 5hmC levels over time. Rapid loss of 5hmC was apparent after 1 wk in culture (1 passage;7 d), and global 5hmC levels continued to decrease with each passage of the cells. In stark contrast, global 5mC levels remained unchanged, suggesting that the loss of 5hmC was not solely due to a concom-itant loss of 5mC (Fig. 2E).
Locus-specific mapping of 5hmC in DNA from normal
human tissues
The marked difference in global 5hmC levels observed between normal human tissues could reflect differences in locus-specific pat-terns of 5hmC. A recent study of genome-wide 5hmC in mouse ES cell DNA found that 5hmC immuno-precipitation combined with genome-wide tiling microarrays could consistently and robustly identify peaks of 5hmC in the mouse genome (Wu et al. 2011a). Here we used a combination of tiling microarrays and 5hmC-sensitive restriction digest-qPCR (hmC-qPCR) to determine locus-specific 5hmC patterns in several normal human tissues. As recent studies
have revealed that both intra- and intergenic regions of the mouse genome can contain high levels of 5hmC, we used tiling microarrays covering the ENCODE regions selected for their biological signifi-cance, including theHOXAcluster,HBB,CFTFR, andAPOcluster. The features represented on each array are listed in Supplemental Table S3. Using a candidate approach, we identified the promoter of
TEX14and a differentially methylated region (DMR) of theH19
gene as enriched for 5hmC, whereas LINE-1 elements and the promoter ofGAPDHwere relatively depleted. qPCR of these loci were used to validate all hydroxymethylated DNA immuno-pre-cipitation (5hmC-IP) assays (Supplemental Fig. S4A).
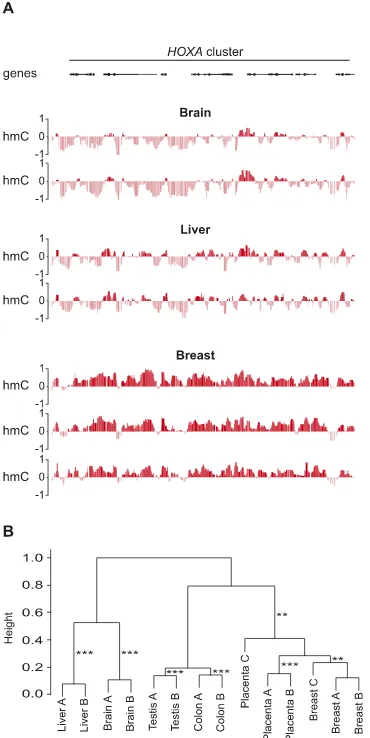
Unsupervised hierarchical clustering of 5hmC enrichment values [log2(input/IP)] for all 72,000 probes on each array clustered
samples by tissue type, confirming that patterns of 5hmC are tis-sue-specific and that inter-tissue variation in 5hmC patterns is greater than inter-individual variation (Fig. 3A,B).
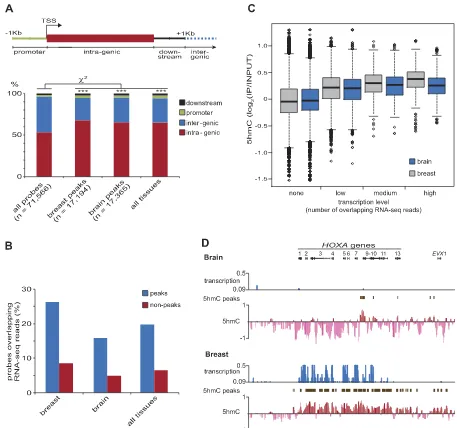
[image:5.612.89.513.71.349.2]Peaks of 5hmC enrichment were defined as any five consec-utive probes in which a minimum of four probes had an enrich-ment score above the 75th percentile, yielding a false discovery rate (FDR)<0.05. We term probes assigned to 5hmC peaks ‘‘peak-probes.’’ Subsequently, using gene models from the RefSeq data-base, each probe was classified according to its genic location—
promoter, intragenic, downstream, or intergenic, as illustrated in Figure 4A (upper panel). Note that because repetitive sequences are typically not represented on tiling microarrays, only the non-re-petitive portion of each genic location is assessed here. Consistent with previous studies in mouse ES cells, the genic distribution of peak probes differed significantly from that expected by chance (x2-test;P<0.001) being enriched in intragenic regions and pro-moters (Fig. 4A, lower panel). However, it is interesting to note that
;25% of 5hmC peaks are not located within annotated genes and their proximal flanking sequences. To further investigate the ob-served association of 5hmC enrichment and gene bodies, we an-alyzed the overlap between 5hmC peak-probes and previously published total RNA-sequencing reads for normal human brain, breast, colon, liver, and testis (Ramskold et al. 2009). We find that peak-probes preferentially colocalize with RNA-seq reads in all tissues (Fig. 4B) and that the 5hmC level of probes is positively correlated with transcription, as measured by the number of overlapping RNA-seq reads (Fig. 4C). Interestingly, although the
association of 5hmC levels with gene transcription within tissues is striking at some loci (Fig. 4D; Supplemental Fig. S5), it does not explain the patterns of 5hmC observed at many other loci (Sup-plemental Fig. S6). Indeed, although significantly correlated, transcription (number of overlapping reads) explained<1% (i.e., brain;r2=0.0025,P=0) in the variation in 5hmC values in each
tissues assayed
As tiling microarrays are limited in their ability to represent non-unique sequences, we determined the 5hmC enrichment of several repetitive elements by 5hmC-IP followed by qPCR. SINE elements (Alu), LINE-1 elements, and satellite sequences (Sat2 and Sata) were all relatively depleted of 5hmC in both normal tissues and cancer cell lines (Supplemental Fig. S7A). Thus, whereas much of the total 5mC content of a normal human genome is found in the repetitive fraction, 5hmC appears largely occluded from repeat sequences. As ‘‘repeats’’ may comprise>50% of the human genome and are usually methylated in normal somatic tissue, the relative lack of global 5hmC compared with global 5mC in reports for most normal mouse tissues may simply reflect a restriction of 5hmC to unique, transcribed sequences (Weisenberger et al. 2005; Kriaucionis and Heintz 2009; Globisch et al. 2010).
Tissue type, not transcription level, is the major modifier
of 5hmC levels in genes
Whereas antibody-based enrichment of 5hmC-containing DNA fragments allows for characterization of genome-wide 5hmC pat-terns, it is difficult to relate the enrichment values obtained to absolute levels of 5hmC, which can also be compromised by the effects of DNA sequence composition on antibody affinity. We used 5hmC-sensitive restriction digest-qPCR (hmC-qPCR) to de-termine absolute 5hmC levels at 12 loci across (1) the HOXA
[image:6.612.88.273.71.440.2]cluster, which shows marked differences in 5hmC profiles between tissues, and (2) theH19locus, which is among the most enriched regions assayed in all tissues (Supplemental Figs. S5, S6). An outline of the assay and sample calculations are presented in Supplemental Figure S1. We tested the accuracy of the assay by spiking each ge-nomic sample with synthetic 100-bp DNA templates containing a single MspI site in which the internal cytosine was either un-modified (C), methylated (5mC), or hydroxymethylated (5hmC). Different ratios of each template type were added to different re-actions. The expected %5hmC and experimentally determined %5hmC levels were highly significantly correlated (Pearson’s cor-relation;r=0.96,P>0.0001) over 10 independent experiments (Supplemental Fig. S8A). In addition, technical and biological replicates of both liver and brain samples were highly significantly correlated over seven loci tested, showing that the results obtained are highly reproducible (Supplemental Fig. S8B,C).
Marked variation in locus-specific 5hmC content was ob-served between tissues; whereas the 5hmC content of loci in the gene body ofH19varied between 37% and 70% in brain DNA, values of just 0.9%–4.3% were observed in blood (Table 1). In agreement with values obtained from tiling microarrays, each tis-sue had consistently higher levels of 5hmC at loci in theH19/IGF2
region than those in theHOXAcluster, and genic loci in both re-gions showed higher levels of 5hmC than non-genic loci (Sup-plemental Fig. S9A,B). However, no significant correlation between 5hmC enrichment values determined on the microarray and those determined by 5hmC-qPCR was observed over the 12 loci tested. The absence of significant correlation is not entirely unexpected given that 5hmC enrichment values on the microarrays were de-termined by immuno-precipitation of large DNA fragments (200–
Figure 3. Genomic patterns of 5hmC enrichment are tissue-specific. (A) Shown are the patterns of 5hmC enrichment [log2(input/IP)] across the
HOXAcluster for multiple replicates of multiple tissues. (B) A dendrogram derived from unsupervised hierarchical consensus clustering of 14 human DNA samples based on 5hmC enrichment levels for all 72,000 probes on each tiling microarray. Samples cluster by tissue type. AU (approximately unbiased)P-value of robustness of each cluster; (**)P>0.01; (***)P>
1000 bp) potentially containing numerous CpG dinucleotides, whereas 5hmC-qPCR evaluates a single MspI locus within that fragment, the 5hmC content of which may differ markedly from that of the fragment as a whole. As only 12 loci were tested and considerable variation between the microarray and 5hmC-qPCR was expected, we hypothesized that assaying additional loci would result in significant association between the two techniques. Ten additional loci were assayed by 5hmC-qPCR in the brain and liver samples. The values from the microarray and 5hmC-qPCR were now significantly correlated for liver (Pearson’s correlation co-efficient;r=0.53,P=0.01) and approaching significance for brain
(Pearson’s correlation coefficient; r = 0.42, P= 0.051) samples (Supplemental Fig. S8D).
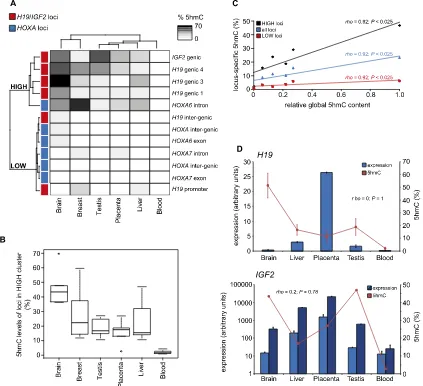
Unsupervised hierarchical clustering of 5hmC levels at 12 loci in six tissues resulted in grouping the samples into two clusters corresponding to loci with high levels of 5hmC (the ‘‘HIGH’’ cluster; median 5hmC content=17.2%) and those with lower levels of 5hmC (the ‘‘LOW’’ cluster; median 5hmC content =
[image:7.612.74.531.68.496.2]2.2%). Consistent with the results obtained from the microarrays, the HIGH cluster consisted entirely of genic MspI sites, primarily from theH19/IGF2locus, whereas the LOW cluster consisted of MspI sites from theHOXAcluster and non-genic MspI sites from
theH19/IGF2cluster (Fig. 5A). Moreover, a heat map of the clus-tered samples revealed a striking difference in absolute levels of 5hmC at the same loci between tissues (Fig. 5A). The inter-tissue variation in 5hmC levels was particularly evident at loci with higher 5hmC content, the HIGH cluster, with large, highly sig-nificant (Mann-WhitneyU-test,P<0.01) differences between tis-sues (Fig. 5B). Indeed, average 5hmC values in brain were more than 20-fold higher than those observed in blood.
As the pattern of inter-tissue differences in absolute 5hmC content appeared similar to those previously determined for global 5hmC levels (Fig. 1C), we investigated the relationship between global 5hmC levels and those determined by locus-specific 5hmC-qPCR. We found that global 5hmC levels correlated significantly with 5hmC levels determined for the HIGH cluster loci, LOW cluster loci, and all loci combined (Fig. 5C). Thus, although we found a small, but significant correlation between transcript levels and 5hmC levels within tissues, transcript levels alone could ex-plain<1% of the variation in 5hmC levels as determined by tiling microarray (i.e., brain;r2=0.0025), whereas relative global 5hmC
levels determined by dot-bot (Fig. 1C) could explain>85% of the observed inter-tissue variation in 5hmC levels determined by 5hmC-qPCR at all loci (r2=0.85) (Fig. 5C).
As the observed inter-tissue differences in absolute 5hmC content could be explained by large inter-tissue variation in gene expression, we tested the association of inter-tissue expression and %5hmC for theH19andIGF2loci and found no significant asso-ciation (Fig. 5D). A similar absence of assoasso-ciation was found for
HOXA6(Spearman’srho=0.5,P=0.45) andHOXA7(Spearman’s
rho=0.1,P=0.95). In a recent study, eight CpGs in the gene bodies of theEGFRandVANGL1genes were assayed by 5hmC-qPCR in four human tissues (brain, heart, spleen, and liver) and HeLa cells (Kinney et al. 2011). We determined the relative expression of
EGFRandVANGL1in these tissues by quantitative RT-PCR and, again, found no correlation between expression and 5hmC con-tent of the gene body of either theEGFR(Spearman’srho= 0.1,P=
0.95) orVANGL1(Spearman’srho= 0.3,P=0.68) gene (Supple-mental Fig. S8E). Again, brain contained the highest levels of 5hmC and HeLa cells the least. Thus, these independently de-termined 5hmC data are completely consistent with our observa-tion that tissue type is a major modifier of 5hmC content of genes in humans and that inter-tissue 5hmC levels show no clear asso-ciation with gene transcription.
Discussion
The discovery of 5-hydroxymethylation of cytosine as an abundant epigenetic mark in mammalian genomes has begun to redefine the field of DNA methylation and our interpretation of DNA methyla-tion data past and present, most of which does not distinguish between canonical 5mC and 5hmC (Nestor et al. 2010). Us-ing immuno-precipitation of DNA with a 5hmC-specific antibody, a plethora of recent studies have begun to describe the genomic location of 5hmC and the po-tential function of both the mark and the TET enzymes that catalyze its generation from 5mC (Ficz et al. 2011; Pastor et al. 2011; Williams et al. 2011; Wu et al. 2011a,b). All have reported the preferen-tial genic localization of both TET1 and 5hmC in mouse ES cells; however, any correlation between 5hmC and transcription levels is less clear. Unexpectedly, a small set of genes were up-regulated in knockdowns of TET1 in both wild-type mouse ES cells and mES cells lacking DNA methylation, suggesting a role for TET1 in transcriptional repression, which is independent of its catalytic activity. However, most recent genome-wide studies have performed very similar experiments, and all in the same model system, namely, mouse ES cells. A single study of human brain frontal lobe tissue similarly reported an association of 5hmC with genic regions and a positive correlation between gene-body 5hmC enrichment and transcription level (Jin et al. 2011). How-ever, because this study examined only one tissue type and was restricted to promoter regions of genes, our knowledge of 5hmC patterns within and between normal mammalian tissues remains basic.
Here, we present the first systematic study of both global and locus-specific patterns of 5hmC in normal human tissues and both cancer- and non-cancer-derived cell lines. Importantly, in addition to immuno-precipitation-based assays of 5hmC content, we use sensitive 5hmC-qPCR to quantify absolute levels of 5hmC at sev-eral loci in numerous tissues. We report large differences in global 5hmC in normal human tissues, consistent with reports of global 5hmC in mouse tissues (Kriaucionis and Heintz 2009). The inter-tissue difference in global 5hmC is striking, brain DNA containing>20 times the 5hmC of blood DNA. Indeed, although we show that transcription level correlates weakly with 5hmC levels within tis-sues, tissue type, and thus global 5hmC content is a far more powerful predictor of the 5hmC content in genes (Fig. 5C). Our failure to find significant correlation between gene expression and 5hmC content between tissues is surprising (Fig. 5D) and suggests that factors other than transcription are the major modifiers of genic 5hmC content. In addition, because the observed reduction in 5hmC across all tissues was broadly conserved at all loci tested, inter-tissue differences in global 5hmC are most likely due to a largely equal reduction in 5hmC content across the genome, as opposed to disproportionate loss at certain genomic elements (i.e., repeats).
[image:8.612.60.399.89.222.2]5hmC is widely presumed to be an intermediate in a process of DNA demethylation, either active or passive. Assuming a model of passive demethylation, 5hmC loss resulting from failure to maintain the mark after DNA replication, one would predict that tissues with a relatively low proliferation rate (i.e., brain) would
Table 1. 5hmC content (%) at 12 loci in six normal human tissues determined by 5hmC-qPCR (EpiMark, NEB)
Locus Brain A Breast A Liver A Placenta A Testis B Blood A
H19genic 3 69.7 22.3 24.7 2.8 14.1 1.3
H19genic 4 47.8 37.4 10.6 18.7 32.0 4.3
IGF2genic 1 43.5 14.4 16.8 27.0 47.1 2.7
H19genic 1 36.7 11.8 14.8 13.0 10.6 0.9
HOXA6intron 36.2 59.6 27.2 17.5 15.4 1.7
H19intergenic 13.4 1.2 4.4 1.7 0.9 0.42
HOXAintergenic 10.6 3.7 1.72 0.22 0.5 0.0
HOXA6exon 9.1 3.9 4.3 7.4 1.4 1.42
H19promoter 6.8 16.5 12.2 0.3 4.5 1.4
HOXA7intron 2.6 8.8 3.7 10.1 4.5 –
HOXAintergenic 0.8 4.2 1.1 2.9 0.5 2.2
HOXA7exon 2.8a 2.9 0.1 0.4 1.9 0.3
All values are single measurements determined by 5hmC-qPCR (EpiMark, NEB). See Supplemental Figure S1 for experimental outline.
have the highest levels of 5hmC and highly proliferative tissues and cell lines would contain the least, as is broadly observed (Fig. 1C). Indeed, adaptation of normal breast cells to culture conditions did result in a decrease in 5hmC levels over time, consistent with an increase in passive loss of 5hmC due to an increased pro-liferation rate in culture (Fig. 2E). However, a simultaneous down-regulation of TET1/2/3gene expression was also observed, sug-gesting that the reduction in 5hmC was due to both passive loss and reduced production of 5hmC (Fig. 2C,E). Irrespective of the mechanism of TET repression and 5hmC loss in culture, this finding highlights the marked difference in 5hmC biology be-tween cell lines and their tissues of origin. Further study of the loss of 5hmC upon transformation of tissues to cell culture may offer a useful tool in dissecting 5hmC biology in mammals.
We also report a dramatic reduction of global 5hmC levels and
TET1/2/3gene expression in breast cancer cell lines compared with
normal breast tissue (Fig. 2A–D). This observation is particularly interesting, given that breast cancer cell lines possess extensive aberrant promoter hypermethylation, and these promoters are enriched for CpG Island promoters marked simultaneously by H3K4me3 and H3K27me3 (bivalent promoters) in ES cells, the same class of genes identified as being marked by TET1 occupancy in mouse ES cells (Ohm et al. 2007; Sproul et al. 2011; Williams et al. 2011).
[image:9.612.94.517.72.458.2]In summary, our results reveal that tissue type is a major modifier of both global and locus-specific 5hmC at genes in nor-mal human tissues, suggesting that the functional importance of 5hmC varies between tissues. We also show that cell culture is re-fractory to bothTET1/2/3gene expression and maintenance of global 5hmC content. Our study emphasizes the importance of the model system (tissue or cell line) used to study 5hmC and the pressing need for more practicable quantitative assays of 5hmC.
Figure 5. Tissue type is a major modifier of 5hmC levels in genes. (A) Unsupervised hierarchical clustering of 12 loci by absolute 5hmC levels results in two groups containing high (HIGH) and low (LOW) levels of 5hmC, respectively, for each indicated tissue. (Red boxes)H19/IGF2loci; (blue boxes)HOXA
loci. (B) Box-plot of 5hmC (%) levels of all five loci in the HIGH cluster for each tissue shows that the range of 5hmC levels at HIGH loci varies markedly between tissues. (C) The relative global 5hmC content (Fig. 1C) correlates with average 5hmC (%) content of each tissue as determined by 5hmC-qPCR. (D) Inter-tissue differences in 5hmC levels do not correlate with inter-tissue expression levels. Average 5hmC (%) content of genic loci ofH19(upperpanel)
andIGF2(lowerpanel) in each indicated tissue is plotted against expression of probes (H19=1 probe;IGF2=2 probes) for each gene obtained from the
Methods
Ethics statement
The use of human breast materials from the Edinburgh Breast Unit at the Western General Hospital was approved by the Lothian Research Ethics Committee (08/S1101/41).
DNA, RNA, and tissue samples
Normal human tissue DNA samples were purchased from AMS Biotechnology Ltd. unless stated otherwise. Normal human tissue RNA samples were purchased from Applied Biosystems. SHEF-6 human embryonic stem cell DNA and RNA was a kind gift from Dr. David Hay (Center for Regenerative Medicine, Edinburgh, UK) (Aflatoonian et al. 2010). Clinical specimens of normal human breast tissue were obtained through the Edinburgh Experimental Cancer Medicine Center. Sample details are given in Supplemental Table S1. DNA and RNA were isolated from cell lines using the QIAGEN AllPrep DNA/RNA/Protein Mini Kit.
Cell culture
All human breast cancer cell lines were cultured as per Neve et al. (2006). HepG2, HCT116, and SW480 cells were cultured in DMEM, McCoys 5A and Leibovitz’s L-15 medium, respectively, supple-mented with 10% fetal calf serum (FCS). Human mammary epi-thelial cell (HMEC) lines were established from normal human breast tissue as previously described (Holliday et al. 2009). Sub-sequently, HMECs were maintained in CnT22 medium (CellnTEC) supplemented with 10% FCS.
DNA dot-blotting
DNA samples were added to denaturation buffer (0.4 mM NaOH, 10 mM EDTA) and denatured for 10 min at 100°C. Samples were rapidly chilled for 5 min on wet ice and then applied to a positively charged nylon membrane under vacuum using a 96-well Dot Blot Hybridisation Manifold (Harvard Apparatus Limited). The mem-brane was washed twice in 23SSC buffer, UV-cross-linked, and dried for 1 h at 70°C. Duplicate membranes were probed with antibodies specific to 5mC (Eurogenentec; dilution factor 1:2000) and 5hmC (Active Motif; dilution factor 1:8000). To control for loading, duplicate membranes were probed with a rabbit poly-clonal antibody raised against single-stranded DNA (Demeditec Diagnostics). Subsequently, membranes were probed with either a rabbit (a-5hmC and a-ssDNA membranes) or mouse (a-5mC membranes) IgG antibody conjugated to horseradish peroxidase (HRP). Following treatment with enhanced chemiluminescence (ECL) substrate, membranes were scanned on an ImageQuant LAS 4000 (GE Healthcare) imaging station. Spot intensity was quanti-fied using ImageJ image processing and analysis software (NIH).
Immunoprecipitation and genomic mapping
5mC- and 5hmC- containing DNA fragments
Genomic DNA (5hmC-IP; 2.5mg in 450mL of TE), sonicated to yield a fragment distribution of;300–1000 bp, was denatured by incubation for 10 min at 100°C. Samples were rapidly chilled on wet ice. At this point, 45mL (10%) of denatured sample was re-moved and saved as input, and 45mL of 103IP buffer (100 mM Na-Phosphate at pH 7.0 [mono and dibasic], 1.4 M NaCl, 0.5% Triton X-100) and 1mg ofa-5hmC (ActiveMotif; #39769) antibody were added to the remaining sample. Samples were incubated overnight at 4°C with gentle agitation. Then, 40 mL of magnetic beads (Dynabeads Protein G; Invitrogen) in 13IP buffer was added to
each sample to allow magnetic separation of the antibody from the unbound DNA using a magnetic tube rack. Samples were in-cubated for 1 h at 4°C with gentle agitation. Beads were collected with a magnetic rack and washed with 1000mL of 13IP buffer for 10 min at room temperature with gentle agitation; washing was repeated three times. Beads were collected with a magnetic rack and resuspended in 250mL of digestion buffer (50 mM Tris at pH 8.0, 10 mM EDTA, 0.5% SDS) followed by addition of 10mL of proteinase K (20 mg/mL; Roche Applied Science) and incubation for 1.5 h at 52°C with constant shaking ($800 rpm). Finally, beads were removed using a magnetic rack, and DNA was purified from the remaining sample using a QIAquick PCR Purification Kit (QIAGEN), eluting in a final volume of 40mL of dH2O. Inputs were
also purified using a QIAquick PCR Purification Kit and eluted in 40mL of dH2O.
Subsequently, 10 ng of input and IP DNA was subjected to whole genome amplification (WGA) using the GenomePlex Complete Whole Genome Amplification Kit (Sigma-Aldrich) as per the manufacturer’s instructions. Amplified DNA was run on a 1.2% agarose gel to confirm consistency of fragment size between sam-ples. Subsequently, amplified DNA samples were Cy5- (IP) or Cy3-(Input) labeled by random priming using the Dual-Color DNA Labeling Kit (NimbleGen). Labeled samples were applied to a Hu-man DNA Methylation 4x72K ENCODE HG17 Targeted Tiling Array, which tiles the biologically significant ENCODE regions (EN001–EN014), and hybridized overnight at 42°C. Slides were washed and scanned as per the NimbleGen protocol.
Analysis of microarray data
All analysis of NimbleGen microarray data was performed using custom-written scripts implemented in the statistical program-ming language R. Due to differences in the saturation kinetics of the dyes used to label the input and IP samples, the absolute en-richment values of a probe (M) often show a dependency on the average intensity of the probe across the input and IP (A). To cor-rect for this bias, each array was subjected to locally weighted scatterplot smoothing (Loess normalization) (Cleveland 1979). Subsequently, scale normalization was used to normalize values of M between arrays of replicate samples. Finally, the data were smoothed using a running median in a sliding window of 13 probes. A peak of 5hmC was defined as any region of five con-secutive probes in which at least four probes had an enrichment value greater than the 75th percentile. This definition of a peak resulted in a false discovery rate of 0.017. All R-scripts are available upon request. Although the microarrays were designed against the hg17 version of the human genome assembly, all coordinates were mapped to version hg18 to allow comparison with RNA-sequenc-ing data. Conversion of genomic coordinates between genome assemblies was performed using the ‘‘liftOver’’ tool downloaded from the UCSC Genome Browser.
Previously published RNA-sequencing data for normal hu-man breast, brain, colon, liver, and testis were downloaded from the UCSC Genome Browser (Ramskold et al. 2009). RNA-seq data were used in their normalized form expressed as reads per million (RPM). Probes were designated as in a transcribed region if they overlapped a sequencing read by one or more base pairs. Where the density of reads overlapping a probe varied across the length of the probe, the average density was used.
Absolute quantification of 5-hmC and 5-mC levels at specific
CpG dinulceotides
(#E3317S; New England BioLabs) followed by quantitative PCR (qPCR). An outline of the assay and sample calculations are pre-sented in Supplemental Figure S1. Briefly, DNA is treated with T4
b-glucosyltransferase (T4-BGT), which specifically glucosylates 5-hydroxymethylcytosine to yieldb-glucosyl-5hmC (5ghmC). Whereas MspI is capable of cleaving its recognition sequence containing either 5mC (C5mCGG) or 5hmC (C5hmCGG), cleav-age is blocked by 5ghmC (C5ghmCGG). qPCR is used to determine the amount of DNA template cut by MspI before and after treat-ment with T4-BGT, allowing estimation of the absolute 5hmC levels at the MspI site. The oligonucleotide primer sequences used are listed in Supplemental Table S2A.
RNA extraction, cDNA synthesis, and quantitative reverse
transcriptase PCR
RNA was extracted from cell lines using TRIzol reagent (Invitrogen) or an RNeasy Mini kit (QIAGEN) according to the manufacturers’ instructions. A Superscript II Reverse transcriptase kit (Invitrogen) was used to make complementary DNA from 500 ng of total RNA. All qRT-PCRs were carried out at an annealing temperature 58°C in a LightCycler 480 Real-Time PCR System (Roche Applied Science). Primer sequences are given in Supplemental Table S2B.
Data access
All microarray data have been submitted to the NCBI Gene Ex-pression Omnibus (GEO) (http://www.ncbi.nlm.nih.gov/geo/) under accession number GSE33219.
Acknowledgments
We thank Tobias Straub and Johannes Soding for R-scripts and advice concerning the analysis of NimbleGen tiling array data. Thanks to Dr. James Hackett for help with development of the 5hmC-IP technique and advice and Dr. John Thomson for helpful discussions. Thanks to Lorna Renshaw (Edinburgh Breast Unit) for assistance with obtaining breast materials. We acknowledge the support of Cancer Research UK for the Edinburgh Cancer Research Centre. This work was funded by the Breakthrough Breast Cancer and the Medical Research Council.
References
Aflatoonian B, Ruban L, Shamsuddin S, Baker D, Andrews P, Moore H. 2010. Generation of Sheffield (Shef) human embryonic stem cell lines using a microdrop culture system.In Vitro Cell Dev Biol Anim46:236–241. Bird A. 2002. DNA methylation patterns and epigenetic memory.Genes Dev
16:6–21.
Borgel J, Guibert S, Li Y, Chiba H, Schubeler D, Sasaki H, Forne T, Weber M. 2010. Targets and dynamics of promoter DNA methylation during early mouse development.Nat Genet42:1093–1100.
Chen DT, Nasir A, Culhane A, Venkataramu C, Fulp W, Rubio R, Wang T, Agrawal D, McCarthy SM, Gruidl M, et al. 2010. Proliferative genes dominate malignancy-risk gene signature in histologically-normal breast tissue.Breast Cancer Res Treat119:335–346.
Cleveland W. 1979. Robust locally weighted regression and smoothing scatterplots.J Am Stat Assoc74:829–836.
Dahl C, Gronbaek K, Guldberg P. 2011. Advances in DNA methylation: 5-hydroxymethylcytosine revisited.Clin Chim Acta412:831–836. Davis T, Vaisvila R. 2011. High sensitivity 5-hydroxymethylcytosine
detection in Balb/C brain tissue.J Vis Expe2661. doi: 10.3791/2661. Ehrlich M, Gama-Sosa MA, Huang LH, Midgett RM, Kuo KC, McCune RA,
Gehrke C. 1982. Amount and distribution of 5-methylcytosine in human DNA from different types of tissues of cells.Nucleic Acids Res10: 2709–2721.
Esteller M. 2007. Cancer epigenomics: DNA methylomes and histone-modification maps.Nat Rev Genet8:286–298.
Ficz G, Branco MR, Seisenberger S, Santos F, Krueger F, Hore TA, Marques CJ, Andrews S, Reik W. 2011. Dynamic regulation of 5-hydroxymethylcytosine in mouse ES cells and during differentiation.Nature473:398–402. Figueroa ME, Abdel-Wahab O, Lu C, Ward PS, Patel J, Shih A, Li Y, Bhagwat
N, Vasanthakumar A, Fernandez HF, et al. 2010. Leukemic IDH1 and IDH2 mutations result in a hypermethylation phenotype, disrupt TET2 function, and impair hematopoietic differentiation.Cancer Cell18: 553–567.
Globisch D, Munzel M, Muller M, Michalakis S, Wagner M, Koch S, Bruckl T, Biel M, Carell T. 2010. Tissue distribution of 5-hydroxymethylcytosine and search for active demethylation intermediates.PLoS ONE5:e15367. doi: 10.1371/journal.pone.0015367.
Hajkova P, Erhardt S, Lane N, Haaf T, El-Maarri O, Reik W, Walter J, Surani MA. 2002. Epigenetic reprogramming in mouse primordial germ cells. Mech Dev117:15–23.
Holliday DL, Brouilette KT, Markert A, Gordon LA, Jones JL. 2009. Novel multicellular organotypic models of normal and malignant breast: tools for dissecting the role of the microenvironment in breast cancer progression.Breast Cancer Res11:R3. doi: 10.1186/bcr2218. Huang Y, Pastor WA, Shen Y, Tahiliani M, Liu DR, Rao A. 2010. The
behaviour of 5-hydroxymethylcytosine in bisulfite sequencing.PLoS ONE5:e8888. doi: 10.1371/journal.pone.0008888.
Iqbal K, Jin SG, Pfeifer GP, Szabo PE. 2011. Reprogramming of the paternal genome upon fertilization involves genome-wide oxidation of 5-methylcytosine.Proc Natl Acad Sci108:3642–3647.
Ito S, D’Alessio AC, Taranova OV, Hong K, Sowers LC, Zhang Y. 2010. Role of Tet proteins in 5mC to 5hmC conversion, ES-cell self-renewal and inner cell mass specification.Nature466:1129–1133.
Jin SG, Kadam S, Pfeifer GP. 2010. Examination of the specificity of DNA methylation profiling techniques towards 5-methylcytosine and 5-hydroxymethylcytosine.Nucleic Acids Res38:e125. doi: 10.1093/nar/ gkq223.
Jin SG, Wu X, Li AX, Pfeifer GP. 2011. Genomic mapping of 5-hydroxymethylcytosine in the human brain.Nucleic Acids Res 39:5015–5024.
Kinney SM, Chin HG, Vaisvila R, Bitinaite J, Zheng Y, Esteve PO, Feng S, Stroud H, Jacobsen SE, Pradhan S. 2011. Tissue-specific distribution and dynamic changes of 5-hydroxymethylcytosine in mammalian genomes.J Biol Chem286:24685–24693.
Koh KP, Yabuuchi A, Rao S, Huang Y, Cunniff K, Nardone J, Laiho A, Tahiliani M, Sommer CA, Mostoslavsky G, et al. 2011. Tet1 and Tet2 regulate 5-hydroxymethylcytosine production and cell lineage specification in mouse embryonic stem cells.Cell Stem Cell8:200–213. Kriaucionis S, Heintz N. 2009. The nuclear DNA base 5-hydroxymethylcytosine
is present in Purkinje neurons and the brain.Science324:929–930. Li E, Bestor TH, Jaenisch R. 1992. Targeted mutation of the DNA
methyltransferase gene results in embryonic lethality.Cell69:915–926. Lock LF, Takagi N, Martin GR. 1987. Methylation of the Hprt gene on the
inactive X occurs after chromosome inactivation.Cell48:39–46. Lorsbach RB, Moore J, Mathew S, Raimondi SC, Mukatira ST, Downing JR.
2003. TET1, a member of a novel protein family, is fused to MLL in acute myeloid leukemia containing the t(10;11)(q22;q23).Leukemia17:637– 641.
Mayer W, Niveleau A, Walter J, Fundele R, Haaf T. 2000. Demethylation of the zygotic paternal genome.Nature403:501–502.
Nestor C, Ruzov A, Meehan R, Dunican D. 2010. Enzymatic approaches and bisulfite sequencing cannot distinguish between 5-methylcytosine and 5-hydroxymethylcytosine in DNA.Biotechniques48:317–319. Neve RM, Chin K, Fridlyand J, Yeh J, Baehner FL, Fevr T, Clark L, Bayani N,
Coppe JP, Tong F, et al. 2006. A collection of breast cancer cell lines for the study of functionally distinct cancer subtypes.Cancer Cell10:515– 527.
Ohm JE, McGarvey KM, Yu X, Cheng L, Schuebel KE, Cope L, Mohammad HP, Chen W, Daniel VC, Yu W, et al. 2007. A stem cell-like chromatin pattern may predispose tumor suppressor genes to DNA
hypermethylation and heritable silencing.Nat Genet39:237–242. Oswald J, Engemann S, Lane N, Mayer W, Olek A, Fundele R, Dean W, Reik
W, Walter J. 2000. Active demethylation of the paternal genome in the mouse zygote.Curr Biol10:475–478.
Pastor WA, Pape UJ, Huang Y, Henderson HR, Lister R, Ko M, McLoughlin EM, Brudno Y, Mahapatra S, Kapranov P, et al. 2011. Genome-wide mapping of 5-hydroxymethylcytosine in embryonic stem cells.Nature 473:394–397.
Plass C, Soloway PD. 2002. DNA methylation, imprinting and cancer.Eur J Hum Genet10:6–16.
Ramskold D, Wang ET, Burge CB, Sandberg R. 2009. An abundance of ubiquitously expressed genes revealed by tissue transcriptome sequence data.PLoS Comput Biol5:e1000598. doi: 10.1371/journal.pcbi.1000598. Richardson AL, Wang ZC, De Nicolo A, Lu X, Brown M, Miron A, Liao X,
Sado T, Fenner MH, Tan SS, Tam P, Shioda T, Li E. 2000. X inactivation in the mouse embryo deficient for Dnmt1: Distinct effect of hypomethylation on imprinted and random X inactivation.Dev Biol225:294–303. Song CX, Szulwach KE, Fu Y, Dai Q , Yi C, Li X, Li Y, Chen CH, Zhang W, Jian
X, et al. 2010. Selective chemical labeling reveals the genome-wide distribution of 5-hydroxymethylcytosine.Nat Biotechnol29:68–72. Sproul D, Nestor C, Culley J, Dickson JH, Dixon JM, Harrison DJ, Meehan
RR, Sims AH, Ramsahoye BH. 2011. Transcriptionally repressed genes become aberrantly methylated and distinguish tumors of different lineages in breast cancer.Proc Natl Acad Sci108:4364–4369. Szwagierczak A, Bultmann S, Schmidt CS, Spada F, Leonhardt H. 2010.
Sensitive enzymatic quantification of 5-hydroxymethylcytosine in genomic DNA.Nucleic Acids Res38:e181. doi: 10.1093/nar/gkq684. Tahiliani M, Koh KP, Shen Y, Pastor WA, Bandukwala H, Brudno Y, Agarwal S,
Iyer LM, Liu DR, Aravind L, et al. 2009. Conversion of 5-methylcytosine to 5-hydroxymethylcytosine in mammalian DNA by MLL partner TET1. Science324:930–935.
Turashvili G, Bouchal J, Baumforth K, Wei W, Dziechciarkova M, Ehrmann J, Klein J, Fridman E, Skarda J, Srovnal J, et al. 2007. Novel markers for differentiation of lobular and ductal invasive breast carcinomas by laser microdissection and microarray analysis.BMC Cancer7:55. doi: 10.1186/1471-2407-7-55.
Valinluck V, Sowers LC. 2007. Endogenous cytosine damage products alter the site selectivity of human DNA maintenance methyltransferase DNMT1.Cancer Res67:946–950.
Valinluck V, Tsai HH, Rogstad DK, Burdzy A, Bird A, Sowers LC. 2004. Oxidative damage to methyl-CpG sequences inhibits the binding of the methyl-CpG binding domain (MBD) of methyl-CpG binding protein 2 (MeCP2).Nucleic Acids Res32:4100–4108.
Walsh CP, Chaillet JR, Bestor TH. 1998. Transcription of IAP endogenous retroviruses is constrained by cytosine methylation.Nat Genet20:116– 117.
Weisenberger DJ, Campan M, Long TI, Kim M, Woods C, Fiala E, Ehrlich M, Laird PW. 2005. Analysis of repetitive element DNA methylation by MethyLight.Nucleic Acids Res33:6823–6836.
Williams K, Christensen J, Pedersen MT, Johansen JV, Cloos PA, Rappsilber J, Helin K. 2011. TET1 and hydroxymethylcytosine in transcription and DNA methylation fidelity.Nature473:343–348.
Wossidlo M, Nakamura T, Lepikhov K, Marques CJ, Zakhartchenko V, Boiani M, Arand J, Nakano T, Reik W, Walter J. 2011. 5-Hydroxymethylcytosine in the mammalian zygote is linked with epigenetic reprogramming.Nat Commun2:241. doi: 10.1038/ncomms1240.
Wu SC, Zhang Y. 2010. Active DNA demethylation: Many roads lead to Rome.Nat Rev Mol Cell Biol11:607–620.
Wu H, D’Alessio AC, Ito S, Wang Z, Cui K, Zhao K, Sun YE, Zhang Y. 2011a. Genome-wide analysis of 5-hydroxymethylcytosine distribution reveals its dual function in transcriptional regulation in mouse embryonic stem cells.Genes Dev25:679–684.
Wu H, D’Alessio AC, Ito S, Xia K, Wang Z, Cui K, Zhao K, Sun YE, Zhang Y. 2011b. Dual functions of Tet1 in transcriptional regulation in mouse embryonic stem cells.Nature473:389–393.
Xu W, Yang H, Liu Y, Yang Y, Wang P, Kim SH, Ito S, Yang C, Xiao MT, Liu LX, et al. 2011. Oncometabolite 2-hydroxyglutarate is a competitive inhibitor ofa-ketoglutarate-dependent dioxygenases.Cancer Cell19:17–30.