Understanding Strategic
Road Network users’
experiences and needs
Wave 1
November 2013
Ben Toombs, Daniel Clay, Marita
Kenrick (TNS BMRB) and
Graham Parkhurst and Glenn Lyons
(Centre for Transport and Society,
University of the West of England)
TNS BMRB
Contents
1. Summary of key findings 1
2. Introduction 3
3. Research Findings 9
Disclaimer
1.
Summary of key findings
In 2011, the Government called for an independent review to assess whether they were taking the right approach to managing, operating and enhancing the
Strategic Road Network (SRN), which resulted in the Cook Report ‘A Fresh Start for the Strategic Road Network’. Since then, there has been further need to inform the development of policy in this area. This qualitative research, commissioned by the Department for Transport and conducted by TNS BMRB and the Centre for Transport & Society at UWE Bristol, responds to this need by exploring individuals’ and businesses’ use, experience, perceptions, expectations and understanding of the SRN. This report arises from the first wave of research.
Drivers’ immediate associations with roads and driving are largely negative and
relate to physical, practical and functional elements of the driving experience. However, once prompted many positive attributes of driving and roads are
recognised, typically related to emotional and aspirational aspects of driving, and these override the negative associations – drivers will still drive regardless of the issues they face on the road.
Individuals see clear differences between major, main and minor roads. Motorways and dual carriageways are easily identified as major roads; however more
confusion existed around whether ‘A roads’ are major or main, or both. There was limited understanding of ‘trunk’ roads.
Preference between road types for particular journeys is dependent on a mix of practical, emotional and cognitive factors. Major roads tend to be used as a
preference among businesses because they are in good condition, easy to navigate and efficient to use. Among individuals, major roads are used regularly as part of both local and national travel because they offer the most time effective and obvious routes, and for longer and more unfamiliar trips minimise the cognitive burden of driving. Main roads, though often more problematic than major roads in terms of congestion and condition, are sometimes preferred by individuals because they are more flexible and pleasant to drive on.
There is a relatively clear distinction made between ‘investment in roads’ (what
money is available for spending on immediate or future road improvements) and ‘management of roads’ (how money is used to fund activities that maintain or optimise the current status of roads). Users have limited awareness of who manages roads in England, though some assume that a central body like the Highways Agency manages the motorways and county councils manage the remaining roads.
The ‘Strategic Road Network’ is itself an unfamiliar and not entirely
self-explanatory term for most individuals and businesses, however for the majority the concept of a network of strategic roads is intuitively understood. SRN roads are expected to be free flowing, well maintained and safe, not least because they are
‘strategic’. However, experience of some SRN roads suggests that they are included in the network because of where they go, and that they are not of a ‘strategic standard’; this creates some uncertainty about the management, purpose and design of the network, and about whether or not users would know when they were on it.
Experience of the SRN and rational consideration of the importance of the SRN for
the UK leads some users to assume that the level of investment in the SRN, especially in comparison to other roads, is adequate and that the network is well managed. Few participants in the research – either individual SRN users or businesses – had a strong pre-existing view that the SRN requires additional investment.
Most individuals find it hard to view the performance of the SRN beyond a personal
context, such as the impact that it has on their own journey times and driving experience. Few spontaneously link the performances of the SRN and the
economy; general awareness and knowledge of the economy, and of the factors which help support the economy, is low among individuals and businesses. Through discussion, an appreciation of a link between the SRN and economic growth is often developed, most quickly among those already thinking in a
business context, who move more easily into that mindset. The link is often not a direct one however: instead the SRN (and transport infrastructure generally) is perceived more as a ‘driver of drivers’ than a direct driver of the economy.
Individuals and businesses recognise that congestion on the SRN is an issue: for individuals it has an impact on their journey times and ‘driving experience’; for businesses it has an impact on business costs. Business costs are seen to fall into four broad areas: (1) Productivity; (2) Efficiency; (3) Opportunity; and (4) Business relationships. Most businesses seek to absorb productivity and efficiency costs wherever possible and to avoid opportunity and relationship costs altogether.
However, for numerous reasons – such as incremental increases, predictability,
coping mechanisms and post rationalisation – most do not see congestion on the SRN as a problem that requires immediate action. Moreover, they do not see obvious ways to address congestion through additional investment (e.g. building new roads was often not seen to be a long-term solution) as opposed to more effective management, given their understanding of and assumptions about both terms.
Efforts to build a publicly acceptable case for greater investment in the SRN are
therefore likely to have to recognise the fact that the SRN’s current level of performance, in the absence of a clear comparator or vision of what it could be like, is itself broadly acceptable to many individuals and businesses.
2.
Introduction
2.1 Research background
The motorways and major trunk roads which make up the Strategic Road Network (SRN) form a core part of England’s transport infrastructure in providing the critical connections between cities, communities and major ports, airports and rail terminals. In the context of increasing passenger and freight movement and economic growth in its early days, the SRN developed into a high capacity highway network, and its expansion has changed and been changed by the country’s spatial development, industry and, in many aspects, society itself. The SRN today carries a third of all national road traffic, as well as two thirds of freight traffic.
As road infrastructure developed and stabilised, SRN policy shifted away from capacity expansion to capacity management, with the view that networks were complete and returns on further infrastructure provision would be relatively low (Eddington, 2006) and due to environmental concerns about local effects of road construction and the global consequences of road transport dependence (e.g. Stern, 2006). More recently this has been compounded by budgetary pressures leading to investment plans for the SRN focussing on resolving pressing issues rather than looking ahead to future needs. There are, however, a number of challenges looking ahead, and early indicators of their effects. With population growth, and economic recovery, congestion is predicted to increase. Already, since 2001 traffic in England has increased seven times faster on motorways than on other roads. Future traffic trends and road user behaviour are hard to predict and are complicated in light of future fuel costs, technological
advancements such as in-vehicle technologies and emerging trends such as peer to peer lift-sharing and sharing of traffic information. Furthermore, with many major highway structures due for major maintenance or renewal, there is growing
awareness that the network needs to become more resilient to the effects of climate change and new techniques will be needed for these.
This growing uncertainty about the volume of traffic and travel behaviour and increasing pressure on England’s major roads has been noted as a significant challenge by the Government. This has prompted a need for reforms to existing structures to allow for more efficient management of the SRN and greater funding certainty. Alongside this, there is a need to understand road users’ attitudes and experiences of the SRN.
In 2011, the Government called for an independent review, to assess whether they were taking the right approach to managing, operating and enhancing the SRN, which resulted in the Cook Report ‘A Fresh Start for the Strategic Road Network’. Since then, there has been further need to inform the development of policy in this area. This qualitative research, commissioned by the Department for Transport and conducted by TNS BMRB and the Centre for Transport & Society at UWE Bristol, responds to this need. This report arises from the first wave of research. Since its
completion, the Government has published more concrete plans in ‘Action for Roads: A Network for the 21st Century’1 , a Command Paper highlighting the challenges faced on England’s roads, reiterating the need for investment and setting out detailed plans to improve management of the network. Whilst this first wave was completed prior to the publication of this report, early interim findings informed its development. Wave one findings will underpin the Roads Reform Social Research Programme as it goes forward.
2.2 Objectives and aims
The objectives of the Wave 1 research for both individual and business users of the SRN were to explore:
current usage of the SRN
current perceptions and expectations of the SRN in general and in comparison to
other roads
user needs when travelling on the SRN
aspects of the SRN that are felt to require improvement and priorities for
improvement
understanding of terminology used to describe issues faced on the SRN attitudes towards investment in roads and in the SRN
perceived relationship (if any) between investment in the SRN and economic growth
what is understood by the term “economic growth‟
which aspects of the rationale provided for why greater levels of investment in the SRN are needed resonate most and least
2.3 Research approach
Fourteen two-hour group discussions were conducted with individual SRN users and 32 one-hour interviews were conducted with people who held responsibility for decisions about procurement and management of business travel within their company (referred to here as ‘business representatives’).
Fieldwork was conducted between 20 May and 14 June 2013.
The research sample, location selection, recruitment approach, discussion coverage and analysis approach are detailed as follows.
2.3.1 Sample
To ensure diversity of coverage across key variables of interest, purposive sampling was undertaken. The aim of this approach is not to create a statistically representative sample but to ensure representation of a range of potential variables of interest.
1https://www.gov.uk/government/publications/action-for-roads-a-network-for-the-21st-century
Working in conjunction with DfT, key variables were selected, a sampling grid was created and individuals recruited to reflect combinations of the key variables (e.g., SRN usage, age and socio-economic group). The specifics of both samples are detailed below.
Individual SRN users
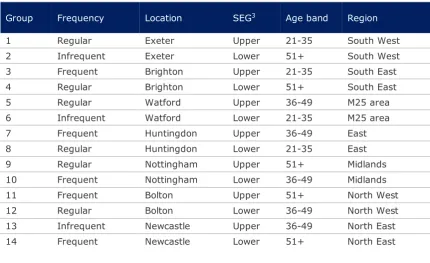
Focus groups were conducted with individual SRN users in Exeter, Brighton, Watford, Huntingdon, Nottingham, Bolton and Newcastle. These locations are illustrated on the map to the right (in red) and represent each of the 7 Highways Agency regions - South West, South East, East, M25 area, Midlands, North West and North East. All participants were drivers and had single or joint decision making responsibility for a car. They were recruited to provide a mix of age groups, frequency of SRN usage, mileage and socio-economic group (as detailed in Table 1).
[image:8.595.51.482.423.686.2]The sample also ensured that participants included a mix of gender, ethnicity, mobility and Vehicle Excise Duty band. The six DfT car owner segments were also identified for all participants during recruitment2.
Table 1. Focus groups with individual SRN users
Group Frequency Location SEG3 Age band Region
1 Regular Exeter Upper 21-35 South West
2 Infrequent Exeter Lower 51+ South West
3 Frequent Brighton Upper 21-35 South East
4 Regular Brighton Lower 51+ South East
5 Regular Watford Upper 36-49 M25 area
6 Infrequent Watford Lower 21-35 M25 area 7 Frequent Huntingdon Upper 36-49 East 8 Regular Huntingdon Lower 21-35 East 9 Regular Nottingham Upper 51+ Midlands 10 Frequent Nottingham Lower 36-49 Midlands
11 Frequent Bolton Upper 51+ North West
12 Regular Bolton Lower 36-49 North West 13 Infrequent Newcastle Upper 36-49 North East 14 Frequent Newcastle Lower 51+ North East
2Further details of the segmentation groups can be found at:
https://www.gov.uk/government/uploads/system/uploads/attachment_data/file/11922/climate-change-transport-choices-summary.pdf
3 Upper SEG classified as ABC1; Lower SEG classified as C2DE
Businesses
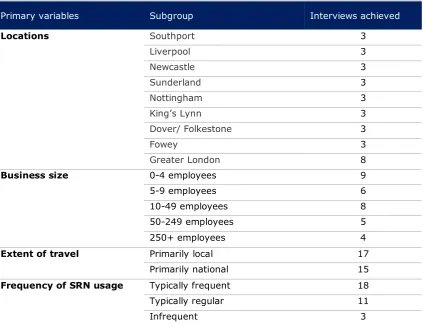
Thirty-two depth interviews were conducted with representatives of private-sector businesses – that is, people within these companies who have responsibility for decisions about procurement and management of business travel.
As illustrated in the map above (in orange), and detailed in Table 2, these interviews were conducted in 9 locations. In order to achieve a good spread of interviews across this diverse group, quotas on business size, type of use, extent of travel and
[image:9.595.56.480.264.591.2]frequency of SRN use were in place. Table 2 outlines the sample coverage across these key variables. The sample also ensured a good spread of industry type, turnover, dependence on transport, number of business sites and time in business. Table 2. Business interviews achieved by location, business size, extent of travel and
frequency of SRN use.
Primary variables Subgroup Interviews achieved
Locations Southport 3
Liverpool 3
Newcastle 3
Sunderland 3
Nottingham 3
King’s Lynn 3
Dover/ Folkestone 3
Fowey 3
Greater London 8
Business size 0-4 employees 9
5-9 employees 6
10-49 employees 8
50-249 employees 5
250+ employees 4
Extent of travel Primarily local 17
Primarily national 15
Frequency of SRN usage Typically frequent 18
Typically regular 11
Infrequent 3
2.3.2 Recruitment
Recruitment was managed by TNS BMRB's in-house team of qualitative recruitment specialists. Recruiters for the individual SRN users sample used a combination of free-find (e.g., door knocking, on-street recruitment) and ‘snowballing’, whereby
respondents were asked if they knew anyone who might be eligible for the difficult-to-recruit groups.
To recruit businesses TNS BMRB utilised a combination of database recruitment and free-find. Database recruitment was undertaken from recruiter databases and sample
purchased from D & B Sales and Marketing Solutions (drawn by location, length of time in business, staff levels, turnover and industry type).
Eligibility for participation was determined via a short screening questionnaire and quotas were set to ensure the sample was distributed across key variables. Screening questionnaires were approved by DfT prior to use.
Individual users were offered a £35 incentive and businesses a £50 incentive to facilitate recruitment and as a ‘thank you’ for their contributions.
2.3.3 Discussion coverage
Semi-structured discussion guides were developed to ensure consistency of topic coverage. The use of semi-structured guides allows participants to dictate the flow of discussions with guidance from the moderator, rather than the questions being administered in the question/response format. Guides were used flexibly and responsively by experienced research moderators.
Separate guides were prepared for individual SRN users and businesses. These are included in Appendix 2.
2.3.4 Analysis Approach
TNS BMRB's qualitative analytical approach is inductive – building upwards from the views of respondents – and drawing on researcher observation, in-session notes, audio recordings of research sessions, and interview transcripts. Interviewers initially reviewed transcripts for key themes and patterns. Ideas and hypotheses were then tabled and debated by the qualitative project team at an internal analysis workshop. The data was then synthesised into a series of thematic charts before content analysis using a framework approach which allows researchers to map the data and draw out key themes and patterns.
2.3.5 Model for building public acceptability The research programme and analysis has been structured according to a model for describing how public acceptability of the need for
investment might develop, based on an
acceptability model developed previously by the Centre for Transport and Society at the University of the West of England (UWE Bristol) and
referenced in the internal DfT report ‘The Strategic Road Network: User Behaviour and Attitudes’.
The model (shown right) is comprised of four elements:
A. Defining the problem: questions whether a problem is perceived to exist, and how it is
D
C
B
A
Overall solution Detailed solutionNeed for Action
Defining the problem
defined
B. Need for Action: creates demand for action to solve the problem
C. Overall Solution: presents details of broad solution that will meet the demand D. Detailed solution: presents details of the specific scheme proposed as a solution
3.
Research Findings
Defining the Problem
Within this chapter we explore individual and business users’ attitudes and experiences towards the following:
Roads and driving
Management, funding and investment Traffic and congestion on major roads
The Strategic Road Network
The SRN and the economy
The extent to which individuals and businesses perceive that there are problems with the SRN that need immediate solutions
3.1 Roads and Driving
Individual SRN drivers’ top-of mind associations with roads and driving4 – those they express most immediately – are largely negative. These negatives tend to be physical, practical and functional, and to relate to the road itself and/or other road users. They include such things as: pot holes; traffic and congestion; other vehicles and their drivers (e.g., lorries, tractors, bicycles, motorbikes); road works; the cost of driving (e.g., fuel, insurance, car maintenance); speed humps and restrictions; and parking restrictions.
“Road works in the city at the moment” (Individual, Frequent, Lower SEG, 36-49, Nottingham)
“It is just too many cars, all the time and no parking” (Individual, Infrequent, Lower SEG, 21-35, Watford)
“Lorry drivers...cutting you off and just pulling out, no indication… and they want to flash their lights to make you go faster” (Individual, Infrequent, Lower SEG, 51+, Exeter)
“The worst thing about driving is just the other drivers. I hate being tooted at or shouted at by someone right at up your back end to get you to move out of the way” (Individual, Infrequent, Upper SEG, 36-49, Newcastle)
“I just think the roads are in a disgusting state after the winter....the potholes” (Individual, Frequent, Upper SEG, 21-35, Brighton)
4Top of mind associations with roads and driving were only explored amongst individual SRN users.
However, once prompted and on consideration many participants articulated positive attributes of driving and roads as well. These positives tended to be personal/
emotional, and include: freedom; independence, control and autonomy; convenience; pleasure when unpressured, off the main roads, non-time constrained or for leisure; relaxing (e.g. listening to radio, having some personal space); speed; and a lower cost compared to public transport.
“I find driving really enjoyable… I find it relaxing, you know when you’ve got the radio on and you’re just there with your thoughts? I quite like that.”
(Individual, Frequent, Upper SEG, 51+, Bolton)
“You can jump in and jump out at your destination can’t you? Unlike having to change trains and stuff like that.” (Individual, Frequent, Upper SEG, 51+, Bolton)
“If you get on a new road, you just seem to arrive at Milton Keynes without even being on it, because it’s so fast.” (Individual, Regular, Lower SEG, 21-35, Huntingdon)
Associations were largely consistent across all types of individual users. Cycle lanes were viewed particularly negatively in the Bolton and Brighton areas, where they are viewed as taking up road space that should be utilised by drivers and cars and
emblematic of drivers being de-prioritised on the road. Infrequent SRN users and drivers with young families tended to focus more strongly on danger, safety, fear and stress; and those living in towns and cities were more likely to articulate negatives in strong terms and more likely to need prompting to express positives.
Whatever their complaints, however, driving is clearly an integral part of most people’s lives. Indeed, the physical negatives may be most salient because they inhibit (but do not negate) the full experience of the inherent positives that are expressed. Compared to the top of mind negatives, the positives took longer to emerge, but were stronger in the end – drivers still drive, despite the negatives.
“The negatives are realistic things, you know, tax, potholes, parking traffic, but the positives are what you bring from driving...the feelings and emotions.”
(Individual, Regular, Lower SEG, 51+, Brighton)
3.1.1 Road types
Individuals were asked to group a pre-prepared list of road types into ‘major roads’, ‘main roads’ and an undefined third category. This third category was consistently labelled by participants as ‘minor roads’ (a response perhaps primed by the given ‘major roads’ label).
Individuals saw clear differences between major, main and minor roads, albeit with some cross-over in specific cases. Table 3 details the groupings.
Table 3. Road types classified by major, main and minor roads
Major Main Minor
Motorways A roads C roads
Dual carriageway B roads Side roads
A roads Country roads
(Trunk roads)
Drivers easily classified motorways and dual carriageways as major roads. A roads were also described as major roads, although there was uncertainty about whether these are major or main roads, and whether dual carriageways are A roads, or something else.
“Major roads are dual carriageways... and A roads, sort of... it depends on the area doesn’t it?” (Individual, Frequent, Upper SEG, 51+, Bolton)
Trunk roads were also assumed to be major roads, but very few participants knew what they are. The term was familiar to some older drivers, who tended to view it as an ‘old-fashioned’ label5. It was virtually unknown amongst younger age groups – ‘trunk roads were assumed to be important (not least because they have a title), but there was very little awareness of what they actually are.
“Trunk road… doesn’t fit in logically with A, B and C roads. That’s fairly logical. But trunk roads...” (Individual, Regular, Lower SEG, 21-35, Huntingdon)
“Haven’t heard for years.” (Individual, Frequent, Upper SEG, 51+, Bolton)
“Trunk road is a new thing to me. I didn’t know what a trunk road was until now”. (Business, Regular, LGV, Local, Folkestone)
Main roads were consistently seen to include B roads and, for some, A roads. Agreement that B roads should be classified as main roads was common across individual SRN users as they provide a ‘main’ level of service to drivers. As noted above, the classification of A roads was a challenge and involved much discussion and the eventual agreement that they probably sit in both categories – major and main – given that in practice they vary significantly in quality and a range of characteristics. The minor roads group included C roads, side roads and country roads. However, most drivers were unsure what C roads referred to – ‘white roads’ on the map?’ – and they may have been classified intuitively given in all likelihood they should be one level down from B roads and 2 down from A roads. Country roads were quite loosely defined with the importance of proximity and access putting some country roads in the ‘main’ category for those living out of town.
“You see A roads and B roads on a map, and then anything else just seems to be a side street or a country lane.” (Individual, Frequent, Upper SEG, 51+, Bolton)
These groupings were consistent across the majority of drivers, with frequent SRN users typically quickest to classify and understand road groupings. Many drivers aged
5 Public usage originates with the 1936 Trunk Roads Act.
36-49 and/or those who were regular or frequent SRN users indicated main roads and dual carriageways are the most important roads to them because of their role in commuting or business driving.
“It gets me to my place of work. It is quick, it is easy and it enables me to earn a living.” (Individual, Frequent, Lower SEG, 36-49, Nottingham)
3.1.2 Journey length
Individuals were also asked to assign distance or time attributes to short, medium and long car journeys. These journeys were mostly characterised in terms of time, then distance, followed by region:
Short journeys were generally seen as under half an hour, or 30 miles, and tended
to be thought of as primarily ‘local’ travel.
Medium journeys were between half an hour and two hours, or 30-100 miles, and
thought of as travelling within the ‘region’ (although the term was not consistently used).
Long journeys were commonly viewed as over two hours, or 100 miles and
primarily for travel outside the ‘region’.
These classifications were broadly consistent across all drivers, although commuters tended to have longer ‘short’ journeys – 45-60 minutes depending on length of commute, while infrequent drivers tended to have shorter ‘short’ journeys overall.
“Two miles at the most. I think that’s a short trip.” (Individual, Infrequent, Upper SEG, 36-49, Newcastle)
3.1.3 Choosing roads – Individual SRN users
The choice of which road to use on a journey depends on a mix of practical, emotional and cognitive factors. These are described briefly below, followed by discussion of how major and main roads were perceived and experienced in light of these factors, and a description of circumstances in which these types of road will be chosen and the types of trips they will be chosen for.
Practical factors include where the road goes, the condition of the road, journey
time from A to B and the cost of driving on the road;
Emotional factors include how pleasant the road is to drive on, ease of stopping off en route, and the stress of driving on the road; and
Cognitive factors include ease of choosing route in advance, ease of navigating
route and number of decisions to take en route. Major roads
Drivers tend to choose and use major roads because they are in good condition and easy to navigate, but these roads were felt to be less pleasant and flexible to use than main roads.
In a practical sense drivers choose and use major roads because they: allow for fast travel; have fewer obstacles6; are in good condition; and allow for fuel-efficient driving – less stop/start driving and more consistent speeds. However, major roads can of course only be chosen if they take people in the direction they wish to travel.
“I’d rather just hit the motorway, straight down, I don’t want to look around, I am driving, I want to be looking at the road.” (Individual, Infrequent, Lower SEG, 21-35, Watford)
“We’ve built such a network of motorway roads around the area, it’s the quickest way to get to most places, in this part of the world.” (Individual, Regular, Lower SEG, 36-49, Bolton)
Major roads minimise cognitive burden for drivers. They are generally agreed to be the easiest to navigate because they provide the most obvious routes, clear signage and information, and have fewer junctions which minimises the number of decisions to take en route.
“I think you get reassurance on big roads, because you’ll get an update of how many miles before you get where you’re looking for.” (Individual, Regular, Lower SEG, 21-35, Huntingdon)
However, major roads tend to have less positive emotional attributes. They are seen as being dull to drive on, and simply a means of getting from A to B. They are also seen as inconvenient if there is a need to stop off en route, and some older drivers, less frequent drivers and drivers with young families find the experience of driving on major roads stressful.
“They are what they are – to get people from A to B in the fastest possible time without going through towns traffic, but they’re the most boring journeys you can do, aren’t they?” (Individual, Regular, Lower SEG, 36-49, Bolton) Major roads are, therefore, chosen if:
they go in the right direction (even for part of the journey), and getting from A to B
quickly is more important than taking an interesting or pleasant route;
they are not found to be stressful or inconvenient; and
the driver is driving alone, a route is planned using sat nav or an online route
planner, and/or they are driving to an unfamiliar destination.
Given that major roads maximise practical positives and minimise cognitive burden, many drivers use them wherever they are available – even if this is only as a small part of a local journey, with main and minor roads making up the rest of the route. Major roads tend to comprise a significant part of longer-distance journeys, especially if it is to an unfamiliar destination. However, since local journeys are made much more frequently than long-distance journeys, major roads are used most often in the first of these contexts – as a small part of a short, familiar journey.
6 Anything on the road that would slow you down, e.g. roundabouts, town centres, slow vehicles that cannot be overtaken
Main roads
Broadly, main roads tended to be viewed as slower, in worse condition and less easy to navigate than major roads, but conversely were seen by many as more flexible, pleasant and interesting to drive on.
Practically, main roads were thought to be of variable quality, with many poor
experiences regarding the surface, lighting and signage cited. They were also said to have slower driving speeds than major roads, and more obstacles, such as
roundabouts, town centres and slow moving vehicles. In comparison to major roads, they were seen as less fuel efficient, but likely to offer a shorter route (in distance terms).
“I’m sure there are times where the motorway is slightly more congested than an A road but [on an A road] you still brake more and [there are] more traffic lights...and roundabouts.” (Individual, Frequent, Lower SEG, 36-49,
Nottingham)
The primary benefits of main roads tend to be emotional. Drivers characterised main roads as having more interesting routes and better views out of the window than major roads, and more options for stopping en route. Ease of stopping off en route was particularly important for older drivers and drivers with families. Views on how stressful main roads are were somewhat divided. Younger and more frequent drivers tended to find main roads more stressful than major roads given the number of obstacles, more stop/start driving and less consistent speeds, while older and less frequent drivers found the experience of driving on main roads less stressful given the slower speeds and ability to stop off if needed.
“[When] you snarl up into a single lane, you then slow down, you then speed up. It would be nice to keep it a bit more constant… it makes it more fuel efficient too.” (Individual, Regular, Upper SEG, 21-35, Exeter)
“I’d be looking to say, ooh, we could stop there or, you know, do a little detour to make the trip more enjoyable, I think.” (Individual, Infrequent, Lower SEG, 51+, Exeter)
“Now I’ve got kids in the car, I’m really funny about the speed. It sounds silly, but if you’re just going out for the day and just want to sort of have a nice drive somewhere, then I would avoid the motorway.” (Individual, Regular, Lower SEG, 51+, Brighton)
Finally, the cognitive burden appears to be higher on main roads (unless they are familiar) with many more decisions to make and options to think about. Many felt that signage and route choice are less clear on main roads than on major roads, and even if sat navs remove the responsibility for choices, the frequency of decision points means there is still more to think about.
Given the above, individuals have conscious reasons for choosing main roads over major roads in certain situations. Main roads are chosen if:
they provide a much shorter route (in distance terms);
taking an interesting or pleasant route matters more than getting there as quickly as possible;
driving on major roads is stressful in itself;
there is a passenger to give directions, and routes can be planned in advance; or
the driving is on a familiar route to an familiar destination.
“I go to the Cotswolds quite a bit, so I do the main roads which are the scenic route and all those, but coming back I use the motorway. To get back early.”
(Individual, Frequent, Upper SEG, 21-35, Brighton) Thus, main roads are most often used:
for leisure trips, where the drive is part of the overall experience;
on known routes – and especially if the surrounding roads are also known, so
alternative routes can be taken if necessary;
where there are no time constraints;
for short and medium length journeys; and
by older and less frequent drivers, and drivers with young families.
“If time isn’t necessarily an issue, I would opt for scenic rather than fastest or shortest.” (Individual, Regular, Upper SEG, 51+, Nottingham)
3.1.4 Choosing roads – Businesses
Business representatives described their businesses’ relationships with and use of major roads in similar terms as individuals, albeit for different reasons. They identified the same physical negatives of main and minor roads, but viewed these through a ‘corporate’ lens. For example: pot holes damage cars, which costs the business money; and road-related stress becomes a human resources issue.
Preferences between major and main roads were influenced by whether roads were used to deliver goods or to move staff. Businesses that deliver goods – haulage, freight deliveries etc. – use major roads wherever possible, and detour to include them in journeys even if there is a more direct alternative route. These businesses tend to focus on the practical benefits of major roads, such as the surface being in better condition and there being fewer speed and weight restrictions. Some business representatives (particularly those whose companies operated heavy goods vehicles) also indicated feeling less ‘guilt’ about holding others up on major roads.
Businesses that deliver people – sales staff, employees etc. – tend to use major roads if they fit into a journey and are therefore much less likely to detour to use them. However, the speed and reliability of the journey was still seen as important: staff have deadlines and appointments to meet, and some participants in managerial positions perceived staff travel time as unproductive if it is not used for business-related thinking or sales.
“Time’s money, if you’re burning fuel sitting in a traffic jam you’re not making money are you.” (Business, Regular, Car, Local/National, King’s Lynn)
Indirect road usage
Indirect usage of major roads was high for all businesses. Indirect usage of roads involves all ancillary usage, for example services used to conduct business (e.g. couriers) or how customers interact with business (e.g. customer travel). Larger businesses (in terms of staff numbers and turnover) and those with more complex operations recognised indirect usage and their dependence on major roads quickly, while smaller businesses and sole traders tended to recognise this only once
prompted.
A wide range of indirect uses were indicated, the specific nature of which varied according to industry sector. These included such uses as IT supplies, waste collections, money/banking, delivery and collections, general office supplies and couriers.
“We have deliveries every day from different companies. We have exchanges being returned to us from customers.” (Business, Frequent, Car, National, London)
“We have a courier service for our lab samples, pathology or blood samples ... and we also have a company who deals with the bodies - if there’s animals put to sleep - and the needles, syringes, they’ve all got to be incinerated so they pick up all of that sort of stuff for us…. There’s another company that comes and they deliver our oxygen and CO2...a huge lorry comes along and we’ve got
…our deliveries for our suppliers of course, our food.” (Business, Frequent, Car, Local, Dover/Folkestone)
3.2 Management, funding and investment
3.2.1 Understanding of ‘management’ and ‘investment’
Management and investment were widely seen both by businesses and individual users as separate, albeit linked, concepts. For most, investment related primarily to acquiring funds or making them available for spending on improving roads, either immediately or in the future; whereas management was seen as activities that maintain or optimise the current performance of roads (activities that are of course funded by investment).
Ideas about what investment and management comprise were sketchy, and tended to focus on the highest profile or most intuitive examples. Investment was most often related to building new roads, widening existing roads and ‘improving’ existing roads (often in some undefined sense) – these conceptions were similar in locations where such activities had and had not recently taken place.
“Well, there’s new investment, i.e. in completely new roads, new bridges, new tunnels and then I guess there’s …just keeping the roads that we’ve currently got working properly.” (Business, Frequent, LGV, Local, Sunderland)
“Investment in the infrastructure... it’s how much money is put into actually repairing or building roads or keeping the roads up to scratch... to improve things.” (Individual, Regular, Lower SEG, 36-49, Bolton)
“They need to widen out or build a new road, that’s investment to
me...investment is more about creating something new or improving...if you’re investing in something then presumably the outcome is going to be a net gain." (Individual, Regular, Lower SEG, 51+ Brighton)
“It has to be some kind of investment for the future as well, making roads suitable for the future, it must have trends and that’s happening now that is going to happen later as well, so they should be investing now really for the future, not just make do and mend.” (Individual, Frequent, Lower SEG, 36-49 Nottingham)
Management was seen as using money to fund activities that maintain or optimise the current performance of roads – i.e. making the current infrastructure work as
effectively as possible. These activities included maintaining physical aspects of the roads (surface, signage, lighting etc.); optimising traffic flow (directing traffic, clearing snow and accidents, speed restrictions etc.); and maintaining safety (ideas on how this is achieved in practice were rarely fully formed).
“Managing roads, it’s kind of looking at the traffic flow. So if I was managing the roads, I would look at where the need for the traffic improvement is, where the need for lights are, roundabouts, etcetera.” (Individual, Regular, Lower SEG, 51+, Brighton)
“[Management] means short routes are safe for pedestrians, cyclists, bikers, making sure traffic lights are in working order.” (Business, Frequent, LGV, Local, Liverpool)
Investment and management seemed to be more closely related in areas where roads had recently been built or substantially widened (e.g. Newcastle, Nottingham and Huntingdon). Here, individuals’ interpretations of investment tended to focus on the immediate benefits of that work, and these benefits and the works that had realised them were often discussed in terms of management as well as investment. Elsewhere, ‘investment’ seemed to be more related more readily to funding for longer-term works that would bring future benefits, and was thus further removed from more immediate management activities.
3.2.2 Funding
There was a widespread assumption, among both businesses and individual SRN users, that very large amounts of money need to be spent on managing, maintaining and improving roads, although conceptions of quite how much is needed were vague.
“I think it must be a lot of money. And actually it’s millions and billions and billions of pounds. Not only in new roads but probably to maintain the current network that we have, I envisage it is probably a lot of money.” (Business, Frequent, Car, Local, Dover/Folkestone)
“I don’t know how much goes in, but I think it’s immense the amount of money that it needs to maintain these roads...Got to be in the billions and billions.” (Individual, Regular, Lower SEG, 51+, Brighton)
Ideas and understanding about how this money is generated, and where it comes from, varied considerably. Among individual users and businesses there was some understanding that local and central government fund roads from general taxation. A subset of these people (especially frequent SRN users, older users and businesses with higher staff numbers and/or turnover) also recognised that finite funds need to be shared between numerous public services, and that money spent on the roads is money that cannot be spent elsewhere.
“It just depends how much the government can spare repairing these. There are so many other things that are taking the government’s money, the NHS – we all know that.” (Business, Car/LGV, Regular, National, London)
“The fact of the matter is that the country is near bankrupt. We demand the NHS. We demand an education system. And the road network is coming down and down and down the pecking order.” (Individual, Regular, Lower SEG, 51+, Brighton)
Most commonly participants assumed and/or believed funds from Vehicle Excise Duty (referred to by participants loosely as ‘car tax’ or ‘road tax’) and fuel duty are ring-fenced for spending on roads (hypothecated). Moreover, these participants believed that these taxes generate very large sums of money, which led many to question the management and maintenance of main and minor roads given their condition (see below).
“I don’t think it reflects the road fund license that we are actually paying on a yearly basis… we are contributing every year when we buy our road fund license and don’t seem to see where the money is going to.” (Individual, Regular, Lower SEG, 51+, Nottingham)
“The volume of traffic is going up, and the money has gone down, yet I’m paying more road tax. I don't get it.” (Individual, Regular, Lower SEG, 21-35, Huntingdon)
A third type of participant was broadly aware that VED and fuel duty are not
hypothecated, but felt that the amount of money raised through taxes which seem so closely linked to roads and driving ought to be reflected in the amounts actually spent on the roads. They often expressed resentment at a perceived mismatch between the sums they paid and the condition of main and minor roads, and felt to varying
degrees that their money had been collected under false pretences and diverted deceptively.
“I think people get upset about the state of the roads… because of the way that we’re swindled out of our money in terms of road tax, in inverted
commas, when, I don't know the figures exactly, but for the sake of argument, £8 billion a year goes onto maintaining the roads and they take something like £60 billion in road tax. (Individual, Frequent, Upper SEG, 36-49, Huntingdon)
“It’s getting syphoned off…So although you pay road tax, it doesn’t pay for the roads.” (Individual, Regular, Lower SEG, 21-35, Huntingdon)
“I think the government sees road users just as a means of taxation.”
(Business, Regular, Car/LGV, National, Dover/Folkestone)
Individual SRN users tended to change their views as discussion progressed – in particular, those who had believed funds are hypothecated typically had this
misunderstanding corrected by other individuals, and moved towards the position held by the third type of participant described above. It was rare for individual SRN users who did not already appreciate that money for roads comes from the same central funds as money for other services to move to this position in the groups, suggesting this would be a difficult message to communicate effectively.
3.2.3 Tolling
Tolls came up spontaneously in most individual SRN user discussions, although participants’ opinions were not probed in great detail. Views were based on partial knowledge, assumptions and personal experience – mostly from driving on the continent, but also the M6 toll for some.
Opinions regarding tolling are divided, but most individuals and businesses felt that introducing tolls on existing UK roads would be unacceptable as they felt they already contributed enough to roads via VED and fuel duty – and indeed other costs of driving such as services, MOTs, insurance, etc. (The idea that these or other taxes could be reduced to compensate for tolling, or that tolling might replace taxes, was not raised, but drivers’ aggregation of taxation and general driving costs is likely to complicate this argument.)
“I couldn’t possibly accept toll roads.” (Individual, Frequent, Upper SEG, 36-49, Huntingdon)
“It’s just principle of putting tax in my car and then asking me again. Taxing my car and then asking me again...You’ve already taxed your car. You’ve got tax, car tax, MOT, insurance, wear and tear.” (Individual, Frequent, Upper SEG 51+, Bolton)
“I am paying my road tax every year I don’t particularly want to be paying road tolls as well.” (Business, Regular, Car, Regular, National, Nottingham)
“You know, there’s only so much money they can take off everyone to invest in these roads.” (Business, Infrequent, Car, Local, London)
There was some support for road tolling in the UK, however, primarily based on
comparisons between conditionsof British untolled roads and continental tolled roads, as well as the M6 toll road. There was a general sense, particularly amongst those that had travelled abroad, that European toll roads are ‘better’ roads, and an assumption that this is because tolls are hypothecated, and that they have more money available to them as a result. They were therefore seen as “worth” the toll money.
“When I do go to London it is a hell of a lot easier to go down the toll road.”
(Business, Regular, Car/LGV, Local, Southport)
“The toll roads, yes, they are lovely, they’re a lot quieter so they’re quicker. They’re so well maintained.Good service stations along them…. I think in general motorways in Europe - the French Autoroutes, Autobahns in Germany - they’re all good quality…Easy to drive on” (Individual, Frequent, Upper SEG, 36-49, Huntingdon)
“We think we are paying enough but we are obviously not because if we were paying enough then they would be maintained.” (Individual, Infrequent, Lower SEG, 51+, Watford)
Freight businesses noted that an imbalance in driving chargesbetween UK and the continental roads puts UK freight businesses at a disadvantage: British businesses have to currently pay to use continental roads but their overseas competitors don’t pay to use English roads.
“As a British haulier we struggle to compete against the continentals”.
(Business, Frequent, Car/LGV/HGV, Local/National/International, Liverpool) However, some participants pointed out that comparing UK and continental costs and experience is like comparing apples to oranges. Some of them noted that charging/tax structures on the continent are likely to be different; others recognised that
continental toll roads tend to be used for holiday travel, and that this differs from other types of travel in numerous ways; and others pointed out that continental toll roads are mostly relatively new, and attributed this in part to the greater amount of space those countries have for building new roads.
“I think most of these roads in France, Austria, Germany and Spain are toll roads anyway. Most of the motorways, the new motorways are toll roads, so you can’t compare our roads with those because we don’t pay...I mean being an island, a small country, we are rather limited on what land we’ve got around aren’t we?” (Individual, Frequent, Upper SEG, 21-35, Brighton)
3.2.4 Management of roads
Confident knowledge of who manages the roads and/or how responsibilities are divided was rare among individual and business users. However if pressed most assumed that the Highways Agency (or some other central authority) manages the motorways and county/local councils manage the remaining roads.
Road management overall in the UK was generally thought to be ‘all right’ – a position driven by an acceptance that it ‘can’t be perfect’ and a broad sense of inevitability and fatalism – ‘it is as it is’.
“We’re always quick to criticise and whatever, but I don’t think we do too bad. I mean we’re a small country with increasing road use, you know. There are going to be problems. You know, you can’t expect it to be trouble free all the time. So, yes, we do okay. We could do better, but we do OK.” (Business, Frequent, Car, Local, Kings Lynn)
However, despite this acceptance there was a strong expectation that roads should be managed more effectively and money should be spent more efficiently. This was
especially the case with regard to pro-active planning. There was a deep frustration with ‘reactive’, ‘short-term’, ‘short-sighted’ and ‘uncoordinated’ road management, which many felt manifests itself in:
Multiple roadworks by utilities and a lack of co-ordination between organisations; The chaos caused by (predictable) weather events and the inability to manage
these events;
Temporary fixing of road surface problems, particularly potholes; and
Widening roads – for some this was a sign that they had not been wide enough in the first place.
“My experience of roadworks is somebody comes along, digs it up, lays tarmac down to repair what they’ve done and then 3 weeks later somebody else
comes in.” (Business, Frequent, Car/LGV, Local, Southport)
“I read … the products they are using to repair these roads or resurface them is not adequate for our weather… - that is [a] false economy because why are we spending money to repair something that they know is not going to last, why [aren’t they] looking at what is the best product to use, even if we end up having to pay a bit more, let’s… deal with it properly rather than this patching up all the time.” (Individual, Regular, Upper SEG, 51+, Nottingham)
“If they did it properly once, instead of touching it up, then they wouldn’t end up doing it next year.” (Individual, Infrequent, Lower SEG, 21-35, Watford)
“Well if we followed what the Americans told us to do when we built the M25... they suggested a ten lane, five lanes each way and we said no. We won’t need, we’ll only need a couple of lanes, don’t worry about it. So what we do now is we try and build more lanes because they were right and we were wrong” (Individual, Frequent, Upper SEG, 21-35, Brighton)
This perception of short-termism, and a view that many roads should be in better condition than they are (see below), meant that the relationship between investment and management was often confused. Visible short-termism implied to some that the large amounts of money they assumed were being allocated to roads were not being used effectively. Alternatively, poor road conditions that were not rectified suggested to others that not enough money is available in the first place.
“I think there’s just a quite high expectation because of the amount of tax you pay. And you think the roads should be, you know, prestigious, you know, perfect, basically, because you do pay a lot of road tax. You know? Every driver is paying that. Where is all the money going? That’s what I think, sometimes. If you weren’t paying so much tax, you probably wouldn’t pay quite so much attention to the smaller things.” (Individual, Regular, Upper SEG, 21-35, Exeter)
Despite this uncertainty, effective and transparent management of current resources, roads and money, was seen by some to be an important first step in ensuring future functioning of roads – and for others was a prerequisite for achieving additional investment.
[If they said] “are you prepared to pay more in taxes to increase the quality of the roads? I would…but…let’s have some formal body,… [that] is very visible and is actually going to take the money and do something about it, because it’s all well and good to say… pay more money in but then, it seems like; more money, more problems occur [with bureaucracy].” (Business, Regular, LGV, National, London)
3.2.5 Perceived levels of investment and management by road type Views about the amount of investment that different road types need and receive were clear and consistent. These were based both on individuals’ and business
representatives’ experience of driving on each type of road, and on their assumptions about the importance of each type to the UK and the measures that need to be taken given the type and amount of traffic that type of road takes.
Experience and visual cues about levels of investment and management included:
The extent to which money has been spent – e.g. state of repair of the road surface The extent to which money is being spent – e.g. on-going road works, whether any
work seems to be being done, and whether there seems to be a long term ‘plan’ for these
The extent to which traffic flows as expected for that type of road
It was overwhelmingly agreed that major roads are the highest priority for
investment, and are already managed well and receive enough investment. They were widely seen as ‘too big to fail’: too vital to the UK to be allowed to deteriorate.
Most felt the major roads they use are well maintained and in good condition, and many pointed to recent improvements to highlight that money is being spent. Road works were taken as a sign that maintenance is carried out on major roads, and were assumed to be efficient, well planned and pro-active (although there was little
discussion of how true this is, or how it could be improved). Major roads were also seen to take vehicles traveling at high speed, so need to be safe, well maintained and managed.
Main roads were seen to be a medium priority for investment overall, but to need more investment and better management than they currently receive. They tended to be viewed as less important to the country than major roads, but as having greater variability of road conditions and less well planned maintenance and road works. Minor roads were seen as the lowest priority for investment overall, but as needing much better management and increased investment. The overall condition of minor roads was thought to be poor: indeed, the majority of physical negatives (discussed in Section 3.1) were linked to minor roads (and to a lesser degree main roads). Minor roads were also characterised as having more obstacles, less consistent traffic flow and repeated road works at the same location. Overall these elements gave most participants the impression that minor roads are poorly planned and managed and have insufficient investment.
“I don't think some of them, like the back roads, are looked after very well. The motorways are good.” (Individual, Regular, Lower SEG, 21-35,
Huntingdon)
“Motorways are obviously kept up to a good standard. Whenever I’ve used a motorway I’ve never hit a pot hole. A roads are a reasonable standard and when they do degrade they tend within a month to six weeks to be sorted. But B roads and minor roads are just a nightmare.” (Business, Regular, LGV, Local, King’s Lynn)
Views about the amount of investment that different road types need and receive were clear and consistent, but there were some perceptions of differential investment across the country. Participants in some areas felt they received lower levels of road funding compared to the South East, which was assumed to get more investment than the rest of the UK. In particular, drivers located in Newcastle and Nottingham tended to feel their areas receive less investment. In a similar vein, some from Exeter felt that their region receives a lower level of investment than others because of its lower population/ voter density.
“As you go further South the roads down there are totally different from here…It’s like a different country.” (Individual, Frequent, Lower SEG, 51+, Newcastle)
“I think there is a north/south divide.” (Individual, Infrequent, Upper SEG, 36-49, Newcastle)
“Roads in big city centres...they use the taxpayers’ money where the majority of people are...Where the voters are.” (Individual, Regular, Upper SEG, 21-35, Exeter)
Individuals and business representatives also had slightly different views on
investment and management. Individuals tended to feel that the condition of major roads is ‘in line with their needs’ – few identified roads where improvements are needed. However, they often felt the perceived under-investment and poor management of main and minor roads is ‘scandalous’, and tended to have more emotional reactions to these issues, based partly on highly personalised views about taxes and funding discussed above.
Meanwhile, businesses were more pragmatic and tended to focus on how road conditions impacted on their business. They tended to report that major roads in general are ‘just good enough’ and were able to identify particular roads important for their businesses that need improvement (e.g. A47 in Norfolk). They were, however, more likely to acknowledge that funds are finite, and to prefer that enough is spent on major roads even if this comes at the expense of funding for main and minor roads.
“I think it’s always going to be insufficient. It’s adequate to what is available. We would all love if it was a lot better because they are not very good in a lot of places. I think there is more towards motorways because...that’s what businesses tend to use...The A5111 has had a lot of money recently spent on it along with the A50 and A52. They could do with a lot more, but needs must isn’t it?” (Business, Infrequent, Car, National, Nottingham)
3.3 Traffic and congestion on major roads
3.3.1 Individuals’ coping mechanisms
Individual SRN users recognised that traffic on major roads has increased. However, most found congestion7 largely predictable, which allowed them to plan their journeys defensively and to develop coping mechanisms which minimise its impact.
Local congestion hot spots were well known: participants knew where local major roads tend to be busier and slower, when to avoid these spots, and which alternative routes to take.
“You get to know it and then you get to learn how it works...Each road is quite specific in how it moves and what time it starts and what time it stops.”
(Individual, Regular, Lower SEG, 21-35, Huntingdon)
“You get used to routine. It’s like going to the Beehive, if you want to go Horwich, and that traffic is going to Horwich, get in the lane for Bolton and go around the roundabout. You know the shortcuts if you know the area.”
(Individual, Frequent, Upper SEG, 51+, Bolton)
Moving further afield, even if a route is unfamiliar, busy periods were thought to be generally the same everywhere, and those who could plan to avoid travelling longer distances at these times did so. Drivers spoke of avoiding major roads in rush hour, Friday evenings and Bank Holidays if they could (although this is of course not always possible).
“If we were going away for a day out or, like a bank holiday, you’d pick the time that you set off. If we were going to the Lake District, on a bank holiday you set off early doors, or else you’re just sitting there – you spend most of your bank holiday sitting in traffic.” (Individual, Regular, Lower SEG, 36-49, Bolton)
“You’ve obviously got general rush-hour is rush-hour, isn't it? It doesn’t matter where you are. Between sort of half-four ‘til six there’s pressure anywhere. So what you’ll do is you’ll look at these satnavs and they’ll give you a time and then you just add on time onto that, probably knowing, depending on what time [you go].You can guestimate roughly how bad you think it’s going to be.”
(Individual, Regular, Upper SEG, 21-35, Exeter)
Some slow and/or stationary traffic was anticipated on most journeys, so individuals reported building in ‘buffer time’ to journeys, viewing an early arrival if that buffer were not needed as a ‘bonus’.
Routine, predictable congestion, particularly locally (which is where the majority of journeys on major roads take place), was therefore tolerated – it was something participants had become conditioned to, and they knew how to minimise its impact.
7 It is worth noting that individuals and businesses use ‘congestion’, ‘heavy traffic’ and other terms interchangeably. For them, congestion does not necessarily mean stationary traffic it can also mean stop start traffic and heavy but free-flowing traffic. In this report, we follow this flexible usage of ‘congestion’.
Congestion which is unexpected and unpredictable to drivers had the potential to be more irritating and problematic. However, many recognised that this type of
congestion comes in two forms: that which is caused by an unpredictable event, and that with a cause that had been predicted, but which had not been mitigated
effectively.
Truly unpredictable congestion, for example caused by a road traffic accident, was felt to be relatively rare. While irritating at the time, most accepted that it does not
happen often, and that there is little that can be done to avoid it; this made it seem acceptable. Congestion caused by apparently predictable events, however, such as snow or road works, was seen as a result of poor management and planning, and was a source of considerable irritation for many individuals and businesses.
Commuters and others with time-critical journeys had less flexibility over their timing and route, and were less tolerant of slow traffic, but even they used the predictability of journey times and traffic speeds to ‘work around it’ as far as possible in order to arrive on time.
“Well if you’ve got to be at a football match, you know exactly where you are going but you have to plan what time to leave to be able to be there on time.”
(Individual, Frequent, Lower SEG, 36-49, Nottingham)
3.3.2 Journey times
Most of the journeys that participants made on major roads were local and fairly short, and the time these journeys take was said to be broadly consistent and
predictable. They therefore knew how long a journey on a local major road normally takes. In this context, judgements about acceptable journey times were relative rather than absolute – times were compared with how long it normally takes, not how long it ‘should’ take (or even ‘could’ take if the roads were managed differently). Journey times for longer distance trips were said to be less predictable, partly because there is more scope for variation. Those who made longer journeys frequently
reported having to adapt to uncertainty about how long it would take, especially if they had to arrive by a certain time.
“I know if I leave home at 7.30-8.00 in the morning, I’m going to hit the M25 any time between 8.30 and 10.00.” (Individual, Regular, Lower SEG, 21-35, Huntingdon)
However, most did not make longer distance trips frequently enough to establish a norm against which to judge the time taken, and were therefore more likely to accept however long it took (within reason). These journeys were also often not particularly time constrained, as they tended to be for holidays, visiting family/friends and other purposes that do not have a key arrival time. Even if they did take longer than was thought reasonable, the experience tended to be seen as a ‘one off’, and did not undermine the overall perception (based on the much more frequent local experience) that journey times on major roads are generally acceptable.
For infrequent longer distance journeys which do have a key arrival time (e.g.
appointments, or catching ferries or planes), individuals tended to build in additional buffer time to mitigate possible delays due to slow traffic or other factors, such as getting lost.
“A lot of the long trips, the majority of the time you probably haven’t been there before, so you’re not going to know until you hit a bad route. You’re not going to know in advance”. (Individual, Frequent, Upper SEG, 51+, Bolton)
“If it’s an airport run [you’re] not familiar with, you plan it.” (Individual, Frequent, Lower SEG, 36-49, Nottingham)
Overall, therefore, individuals used local knowledge and ‘rules of thumb’ to
avoid/anticipate congestion, and saw journey times that are slower than perhaps they ‘should’ be as normal and thus acceptable. Congestion only causes notable problems if it is unpredictable, and is only blamed on poor management if due to events that it is thought managers should be able to plan for.
3.3.3 Congestion and business
Businesses saw congestion as having cost implications for their businesses in four broad ways:
1. Productivity - time spent travelling is seen as unproductive and ‘dead time’; 2. Efficiency - reduced fuel efficiency as a result of delays and slow traffic; 3. Opportunities - late arrival for appointments with customers and clients can
lead to lost business; and
4. Business relations - relationships with on-going customer/client being impacted by the late delivery of goods and services.
Most businesses sought to absorb productivity and efficiency costs as ‘business costs’ wherever possible, and to avoid opportunity and relationship costs altogether.
Greater productivity and efficiency costs are, however, acceptable in order to avoid opportunity and relationship costs – for example building in extra buffer time, increasing unproductive time, to avoid late arrival for meetings.
As with individuals, predictable congestion tends to be normalised and, up to a point, tolerated. Predictability also means that costs can also be absorbed into the business and/or avoided by planning journeys defensively using rule of thumb knowledge about congestion, for example:
Small businesses with infrequent travel needs can be flexible, for example some
leave the night before or very early in the morning to ensure that they arrive in time;
Some businesses schedule journeys for less congested times, such as late at night, to speed up travel time, reduce ‘dead time’ and increase fuel efficiency; and
Others that have less flexibility over timing and route build ‘buffer time’ into journey planning.
“It’s very important that I don’t inflict [these] problems on my clients, so the clients they don’t see it and I make sure they don’t see it. So we’ll travel early and stay overnight somewhere or, you know, make sure that if a client wants us there on a given day at a given time we will be there, but we have to plan our trip defensively.” (Business, Frequent, Car, National, Fowey)
“A lot of people... whilst they are in a car, that time is relatively dead time...there’s a lot of time wasted with travelling – especially if there’s an accident or delays or poorly managed roads.” (Business, Regular, Car, Local, Southport)
“We have to compensate, we have to allow for greater delays and time getting from A to B.” (Business, Regular, Car/LGV, National, London)
Although these defensive strategies increase the amount of time employees spend engaging in non-productive activities, the associated productivity costs have become increasingly acceptable over time and are now tolerated as a normal operating cost. Unexpected delays were said to have the potential to create opportunity and
relationship costs, as businesses cannot absorb them through forward planning. Again as with individuals, businesses reacted differently to such delays depending on
whether the cause of the congestion was seen as predictable or not. Congestion caused by unpredictable events such as accidents was thought relatively rare, and thus largely accepted and considered ‘blameless’. However, congestion caused by seemingly predictable events (bad weather, road works etc.) was thought
unacceptable and related to poor management.
Thus while the costs and impacts of congestion were felt differently by businesses and individuals, both responded to it in similar ways. Indeed, businesses seemed no more likely than individuals to engage in pro-active forward planning to try to minimise the impacts of congestion. Some might listen to the radio or check online for traffic
reports immediately before they left, but few received information (e.g. regular traffic updates or details about forthcoming road works) that would allow them to plan their journey in advance. The great majority operated under the same ‘rules of thumb’ as individuals.
3.4 The Strategic Road Network
3.4.1 Understanding of the SRN
The ‘Strategic Road Network’ was itself an unfamiliar and not entirely self-explanatory term for most individuals and business representatives. However, the majority quickly reached an intuitive understanding of the concept of a ‘strategi