5-[(4-Methoxybenzyl)sulfanyl]-2-methyl-1,3,4-thiadiazole
Hoong-Kun Fun,a*‡ Suchada Chantrapromma,b§
B. Chandrakantha,cArun M. Isloordand Prakash Shettye
aX-ray Crystallography Unit, School of Physics, Universiti Sains Malaysia, 11800
USM, Penang, Malaysia,bCrystal Materials Research Unit, Department of Chemistry,
Faculty of Science, Prince of Songkla University, Hat-Yai, Songkhla 90112, Thailand,
cDepartment of Chemistry, Manipal Institute of Technology, Manipal 576 104, India, dOrganic Chemistry Division, Department of Chemistry, National Institute of
Technology-Karnataka, Surathkal, Mangalore 575 025, India, andeDepartment of
Printing, Manipal Institute of Technology, Manipal 576 104, India Correspondence e-mail: hkfun@usm.my
Received 7 December 2010; accepted 10 December 2010
Key indicators: single-crystal X-ray study;T= 296 K; mean(C–C) = 0.004 A˚; Rfactor = 0.052;wRfactor = 0.118; data-to-parameter ratio = 19.2.
The title molecule, C11H12N2OS2, is twisted with a dihedral
angle of 83.63 (12)between the 1,3,4-thiadiazole and benzene
rings. The methoxy group deviates slightly from the attached benzene ring, with a C—C—O—C torsion angle of 4.2 (4). In
the crystal, molecules are linked by weak C—H N inter-actions and stacked along thecaxis.
Related literature
For bond-length data, see: Allen et al. (1987). For a related structure, see: Wang et al. (2010). For background to and applications of thiadiazole derivatives, see: Bernard et al. (1985); Chandrakanthaet al.(2010); El-Sabbaghet al.(2009); Islooret al.(2010); Kallurayaet al.(2004). For the stability of the temperature controller, see: Cosier & Glazer (1986).
Experimental
Crystal data
C11H12N2OS2
Mr= 252.35 Monoclinic,P21=c a= 14.7765 (4) A˚
b= 8.6916 (3) A˚
c= 9.7339 (3) A˚ = 96.477 (1)
V= 1242.16 (7) A˚3
Z= 4
MoKradiation = 0.41 mm1
T= 296 K
0.250.190.03 mm
Data collection
Bruker APEXII CCD area-detector diffractometer
Absorption correction: multi-scan (SADABS; Bruker, 2005)
Tmin= 0.907,Tmax= 0.987
11429 measured reflections 2828 independent reflections 1660 reflections withI> 2(I)
Rint= 0.040
Refinement
R[F2> 2(F2)] = 0.052
wR(F2) = 0.118
S= 1.02 2828 reflections
147 parameters
H-atom parameters constrained max= 0.23 e A˚
3 min=0.19 e A˚3
Table 1
Hydrogen-bond geometry (A˚ ,).
D—H A D—H H A D A D—H A
C1—H1B N1i
0.96 2.59 3.532 (4) 164
Symmetry code: (i)x;yþ1 2;zþ
1 2.
Data collection:APEX2(Bruker, 2005); cell refinement:SAINT (Bruker, 2005); data reduction:SAINT; program(s) used to solve structure: SHELXTL (Sheldrick, 2008); program(s) used to refine structure:SHELXTL; molecular graphics:SHELXTL; software used to prepare material for publication:SHELXTLandPLATON(Spek, 2009).
AMI is thankful to the Director of the National Institute of Technology for providing research facilities and also thanks the Board for Research in Nuclear Sciences, Department of Atomic Energy, Government of India, for the Young Scientist award. SC thanks the Prince of Songkla University for generous support through the Crystal Materials Research Unit. The authors also thank Universiti Sains Malaysia for the Research University grant No. 1001/PFIZIK/811160.
Supplementary data and figures for this paper are available from the IUCr electronic archives (Reference: IS2640).
References
Allen, F. H., Kennard, O., Watson, D. G., Brammer, L., Orpen, A. G. & Taylor, R. (1987).J. Chem. Soc. Perkin Trans. 2, pp. S1–19.
Bernard, A. M., Cocco, M. T., Maccioni, A. & Plumitallo, A. (1985).Farmaco, 40, 259–271.
Bruker (2005).APEX2,SAINTandSADABS. Bruker AXS Inc., Madison, Wisconsin, USA.
Chandrakantha, B., Shetty, P., Nambiyar, V., Isloor, N. & Isloor, A. M. (2010).
Eur. J. Med. Chem.45, 1206–1210.
Cosier, J. & Glazer, A. M. (1986).J. Appl. Cryst.19, 105–107.
El-Sabbagh, O. I., Baraka, M. M., Ibrahim, S. M., Pannecouque, C., Andrei, G., Snoeck, R., Balzarini, J. & Rashad, A. A. (2009).Eur. J. Med. Chem.44, 3746–3753.
Isloor, A. M., Kalluraya, B. & Pai, K. S. (2010).Eur. J. Med. Chem.45, 825–830. Kalluraya, B., Jagadeesha, R. L. & Isloor, A. M. (2004).Indian J. Heterocycl.
Chem.13, 245–248.
Sheldrick, G. M. (2008).Acta Cryst.A64, 112–122. Spek, A. L. (2009).Acta Cryst.D65, 148–155.
Wang, H., Gao, Y. & Wang, W. (2010).Acta Cryst.E66, o3085. Acta Crystallographica Section E
Structure Reports
Online
ISSN 1600-5368
supporting information
Acta Cryst. (2011). E67, o163 [https://doi.org/10.1107/S1600536810051858]
5-[(4-Methoxybenzyl)sulfanyl]-2-methyl-1,3,4-thiadiazole
Hoong-Kun Fun, Suchada Chantrapromma, B. Chandrakantha, Arun M. Isloor and Prakash
Shetty
S1. Comment
Thiadiazole are a class of heterocyclic compounds having a five membered ring. They occur in nature and are
predominant among all types of pharmaceuticals, agrochemicals and veterinary products (El-Sabbagh et al., 2009). The
amino and mercapto groups in thiadiazole are readily-accessible nucleophilic centers. 1,3,4-Thiadiazole exhibit a wide
spectrum of biological activities (Bernard et al., 1985). Due to the presence of the –N—C—S moiety (Kalluraya et al.,
2004), they are found to be used as antibacterial, antimicrobial and anti-inflammatory agents (Chandrakantha et al.,
2010). Antibacterial and antifungal (Isloor et al., 2010) activities of the azoles are most widely studied and azoles are also
used as antimicrobial agents. Herein we report the crystal structure of the title 1,3,4-thiadiazole derivative, (I).
The molecule of (I) (Fig. 1) is twisted with a dihedral angle between the 1,3,4-thiadiazole and benzene rings being
83.63 (12)°. Atoms C3, S2, C4 and C5 lie nearly on the same plane with r.m.s. 0.0517 (5) Å and the torsion angle C3–S2–
C4–C5 = 172.25 (18)°. The mean plane through C3/S2/C4/C5 makes the dihedral angles of 9.02 (15) and 75.92 (16)°
with the 1,3,4-thiadiazole and benzene rings, respectively. The methoxy group is slightly deviated with respect to the
attached benzene ring with the torsion angle C11–O1–C8–C9 = 4.2 (4)°. The bond distances are of normal values (Allen
et al., 1987) and are comparable with the related structure (Wang et al., 2010).
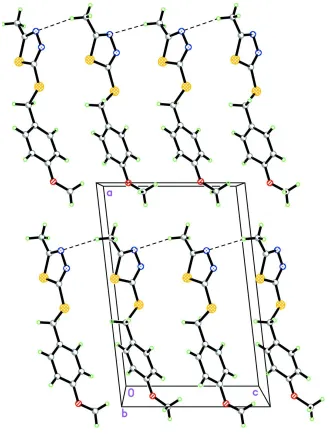
In the crystal packing (Fig. 2), the molecules are linked by C1—H1B···N1 weak interactions (Table 1) and stacked along
the c axis. S···N [3.340 (2) Å] short contacts (symmetry codes: x, 1/2 - y, 1/2 + z and x, 1/2 - y, -1/2 + z) are presented in
the crystal.
S2. Experimental
The title compound was synthesized by adding 4-methoxybenzylbromide (3.02 g, 0.0151 mol) dropwise to a stirred
solution of 5-methyl-1,3,4-thiadiazole-2-thiol (2.00 g, 0.0151 mol) and anhydrous potassiumcarbonate (4.16 g, 0.03 mol)
in dry acetonitrile (50 ml) at room temperature and the reaction mixture was stirred at room temperature for 5 h. After the
completion of reaction, the reaction mixture was filtered and the filtrate was concentrated. The crude product was
recrystallized with hot ethanol to afford the title compound as yellow solid (2.00 g, yield 57%). Yellow plate-shaped
single crystals of the title compound suitable for x-ray structure determination were recrystalized from ethanol by the
slow evaporation of the solvent at room temperature after several days (m.p. 413–415 K).
S3. Refinement
All H atoms were positioned geometrically and allowed to ride on their parent atoms, with d(C—H) = 0.93 Å for
aromatic, 0.97 Å for CH2 and 0.96 Å for CH3 atoms. The Uiso(H) values were constrained to be 1.5Ueq(C) for methyl H
Figure 1
The molecular structure of the title compound, showing 40% probability displacement ellipsoids and the atom-numbering
scheme.
Figure 2
The crystal packing of the title compound viewed along the b axis. C—H···N weak interactions are shown as dashed
[image:3.610.142.472.235.669.2]5-[(4-Methoxybenzyl)sulfanyl]-2-methyl-1,3,4-thiadiazole
Crystal data
C11H12N2OS2 Mr = 252.35
Monoclinic, P21/c
Hall symbol: -P 2ybc
a = 14.7765 (4) Å
b = 8.6916 (3) Å
c = 9.7339 (3) Å
β = 96.477 (1)°
V = 1242.16 (7) Å3 Z = 4
F(000) = 528
Dx = 1.349 Mg m−3
Melting point = 413–415 K Mo Kα radiation, λ = 0.71073 Å Cell parameters from 2828 reflections
θ = 2.7–27.5°
µ = 0.41 mm−1 T = 296 K Plate, yellow
0.25 × 0.19 × 0.03 mm
Data collection
Bruker APEXII CCD area-detector diffractometer
Radiation source: sealed tube Graphite monochromator
φ and ω scans
Absorption correction: multi-scan (SADABS; Bruker, 2005)
Tmin = 0.907, Tmax = 0.987
11429 measured reflections 2828 independent reflections 1660 reflections with I > 2σ(I)
Rint = 0.040
θmax = 27.5°, θmin = 2.7° h = −19→19
k = −11→11
l = −12→12
Refinement
Refinement on F2
Least-squares matrix: full
R[F2 > 2σ(F2)] = 0.052 wR(F2) = 0.118 S = 1.02 2828 reflections 147 parameters 0 restraints
Primary atom site location: structure-invariant direct methods
Secondary atom site location: difference Fourier map
Hydrogen site location: inferred from neighbouring sites
H-atom parameters constrained
w = 1/[σ2(F
o2) + (0.0454P)2 + 0.2899P]
where P = (Fo2 + 2Fc2)/3
(Δ/σ)max = 0.001
Δρmax = 0.23 e Å−3
Δρmin = −0.19 e Å−3
Special details
Geometry. All e.s.d.'s (except the e.s.d. in the dihedral angle between two l.s. planes) are estimated using the full covariance matrix. The cell e.s.d.'s are taken into account individually in the estimation of e.s.d.'s in distances, angles and torsion angles; correlations between e.s.d.'s in cell parameters are only used when they are defined by crystal symmetry. An approximate (isotropic) treatment of cell e.s.d.'s is used for estimating e.s.d.'s involving l.s. planes.
Refinement. Refinement of F2 against ALL reflections. The weighted R-factor wR and goodness of fit S are based on F2,
conventional R-factors R are based on F, with F set to zero for negative F2. The threshold expression of F2 > σ(F2) is used
only for calculating R-factors(gt) etc. and is not relevant to the choice of reflections for refinement. R-factors based on F2
are statistically about twice as large as those based on F, and R- factors based on ALL data will be even larger.
Fractional atomic coordinates and isotropic or equivalent isotropic displacement parameters (Å2)
x y z Uiso*/Ueq
N2 0.38487 (18) 0.3952 (3) 0.7726 (2) 0.0795 (7) C1 0.24763 (19) 0.1218 (4) 0.9455 (3) 0.0849 (9)
H1A 0.1893 0.1624 0.9098 0.127*
H1B 0.2534 0.1234 1.0447 0.127*
H1C 0.2529 0.0178 0.9141 0.127*
C2 0.32087 (18) 0.2174 (3) 0.8958 (2) 0.0616 (7) C3 0.45726 (18) 0.3383 (3) 0.8427 (2) 0.0609 (7) C4 0.63995 (18) 0.2718 (3) 0.9180 (3) 0.0672 (7)
H4A 0.6353 0.2848 1.0159 0.081*
H4B 0.6239 0.1665 0.8925 0.081*
C5 0.73488 (17) 0.3071 (3) 0.8867 (2) 0.0581 (7) C6 0.7820 (2) 0.4335 (3) 0.9444 (3) 0.0697 (8)
H6A 0.7551 0.4956 1.0062 0.084*
C7 0.8673 (2) 0.4688 (3) 0.9122 (3) 0.0738 (8)
H7A 0.8977 0.5539 0.9528 0.089*
C8 0.90874 (18) 0.3794 (3) 0.8200 (3) 0.0624 (7) C9 0.86360 (19) 0.2522 (3) 0.7635 (3) 0.0678 (7)
H9A 0.8909 0.1892 0.7029 0.081*
C10 0.77752 (18) 0.2183 (3) 0.7970 (3) 0.0653 (7)
H10A 0.7475 0.1324 0.7573 0.078*
C11 1.0358 (2) 0.3427 (5) 0.6936 (4) 0.1167 (14)
H11A 1.0964 0.3813 0.6905 0.175*
H11B 1.0014 0.3548 0.6046 0.175*
H11C 1.0385 0.2356 0.7180 0.175*
Atomic displacement parameters (Å2)
U11 U22 U33 U12 U13 U23
Geometric parameters (Å, º)
S1—C3 1.723 (3) C4—H4B 0.9700
S1—C2 1.725 (3) C5—C10 1.371 (3)
S2—C3 1.734 (3) C5—C6 1.386 (4)
S2—C4 1.814 (3) C6—C7 1.367 (4)
O1—C8 1.365 (3) C6—H6A 0.9300
O1—C11 1.410 (3) C7—C8 1.382 (4)
N1—C2 1.288 (3) C7—H7A 0.9300
N1—N2 1.383 (3) C8—C9 1.373 (4)
N2—C3 1.300 (3) C9—C10 1.380 (3)
C1—C2 1.488 (4) C9—H9A 0.9300
C1—H1A 0.9600 C10—H10A 0.9300
C1—H1B 0.9600 C11—H11A 0.9600
C1—H1C 0.9600 C11—H11B 0.9600
C4—C5 1.500 (3) C11—H11C 0.9600
C4—H4A 0.9700
C3—S1—C2 87.33 (13) C10—C5—C4 121.5 (2)
C3—S2—C4 102.99 (12) C6—C5—C4 121.2 (2)
C8—O1—C11 118.1 (2) C7—C6—C5 121.3 (2)
C2—N1—N2 113.2 (2) C7—C6—H6A 119.4
C3—N2—N1 112.1 (2) C5—C6—H6A 119.4
C2—C1—H1A 109.5 C6—C7—C8 120.7 (3)
C2—C1—H1B 109.5 C6—C7—H7A 119.7
H1A—C1—H1B 109.5 C8—C7—H7A 119.7
C2—C1—H1C 109.5 O1—C8—C9 125.0 (2)
H1A—C1—H1C 109.5 O1—C8—C7 116.2 (2)
H1B—C1—H1C 109.5 C9—C8—C7 118.8 (3)
N1—C2—C1 123.7 (3) C8—C9—C10 119.8 (3)
N1—C2—S1 113.5 (2) C8—C9—H9A 120.1
C1—C2—S1 122.8 (2) C10—C9—H9A 120.1
N2—C3—S1 113.7 (2) C5—C10—C9 122.2 (2)
N2—C3—S2 120.7 (2) C5—C10—H10A 118.9
S1—C3—S2 125.53 (16) C9—C10—H10A 118.9
C5—C4—S2 106.83 (17) O1—C11—H11A 109.5
C5—C4—H4A 110.4 O1—C11—H11B 109.5
S2—C4—H4A 110.4 H11A—C11—H11B 109.5
C5—C4—H4B 110.4 O1—C11—H11C 109.5
S2—C4—H4B 110.4 H11A—C11—H11C 109.5
H4A—C4—H4B 108.6 H11B—C11—H11C 109.5
C10—C5—C6 117.3 (2)
C2—N1—N2—C3 0.2 (3) S2—C4—C5—C6 76.6 (3)
N2—N1—C2—C1 −178.9 (2) C10—C5—C6—C7 0.5 (4)
N2—N1—C2—S1 0.9 (3) C4—C5—C6—C7 −177.7 (2)
C3—S1—C2—N1 −1.3 (2) C5—C6—C7—C8 0.4 (4)
N1—N2—C3—S1 −1.3 (3) C11—O1—C8—C7 −176.3 (3)
N1—N2—C3—S2 178.12 (18) C6—C7—C8—O1 179.1 (2)
C2—S1—C3—N2 1.5 (2) C6—C7—C8—C9 −1.4 (4)
C2—S1—C3—S2 −177.88 (18) O1—C8—C9—C10 −179.1 (3)
C4—S2—C3—N2 −171.8 (2) C7—C8—C9—C10 1.5 (4)
C4—S2—C3—S1 7.5 (2) C6—C5—C10—C9 −0.4 (4)
C3—S2—C4—C5 172.25 (18) C4—C5—C10—C9 177.8 (2)
S2—C4—C5—C10 −101.5 (3) C8—C9—C10—C5 −0.6 (4)
Hydrogen-bond geometry (Å, º)
D—H···A D—H H···A D···A D—H···A
C1—H1B···N1i 0.96 2.59 3.532 (4) 164