Water Stress in Beta vulgaris: Osmotic Adjustment
Response and Gene Expression Analysis in ssp. vulgaris
and maritima
Paola Vastarelli, Anna Moschella, Daniela Pacifico, Giuseppe Mandolino
Consiglio per la Ricerca e la Sperimentazione in Agricoltura, Centro di Ricerca per le Colture Industriali, Bologna, Italy. Email: giuseppe.mandolino@entecra.it
Received October 20th,2012; revised November 28th, 2012; accepted December 6th, 2012
ABSTRACT
Betavulgaris genus comprises wild and cultivated subspecies. The “maritima” subspecies is formed by wild or weedy
accessions, well adapted to low-water potential environments; it was previously shown that B. vulgaris ssp. maritima
has mechanisms of osmotic adjustment more effective than the cultivated B. vulgaris ssp. vulgaris. The response to a
progressive lowering of soil potential was compared in two Beta accessions, a cultivated and a wild one. Throughout
the 4-months experiment under rain shelters, osmotic potential and relative water content were measured and total RNA was extracted to test the expression of six target genes known in sugar beet or in other plants to be modulated by water shortage. The mild occurrence of drought was paralleled by slow increase in transcription for sucrose synthase 1 and choline monoxygenase, in a way that was in some cases accession-dependent, e.g. the gene for choline monoxygenase was found to be up-regulated at the later stages of growth in stressed plants compared to control ones, and showed a higher constitutive transcription in sea beet compared to sugar beet. Transcription factor DREB2A also was slowly in-duced during the growth season and upon onset of water shortage, and this induction was stronger in sea beet than in sugar beet. In control plants, the transcription of all genes tested except DREB2A were significantly higher in maritima
accession compared to vulgaris one.
Keywords:Beta vulgaris; Beta maritime; Drought; Osmotic Adjustment; Gene Expression
1. Introduction
Beta is an economically important genus, and it includes,
besides the cultivated forms of beets (Beta vulgaris ssp. vulgaris), wild or weedy forms like the subspecies B. vulgaris ssp. maritima, source of agronomically impor-
tant traits such as cercospora and rhizomania resistance [1]. Abiotic stresses are major causes of crop yield re-duction; particularly, low water availability is a increas-ingly severe environmental stress affecting agricultural production and quality [2]. Water resources are declining not only in dry areas, but also in temperate ones; as water for agronomic use becomes limiting, the development of drought tolerant cultivars gains in importance also in sugar beet genetic improvement [3,4]. Beta genus is
known to be relatively tolerant to low soil water poten-tials, compared to other genera of high economic impor-tance. Different mechanisms can contribute to an im-proved drought tolerance, including morphological char-acteristics like deep rooting [5] and metabolic regulatory mechanisms like osmotic adjustment [6,7]. The Beta vul- garis ssp. maritima germplasm includes accessions able
to develop mechanisms of escape from water shortage (e.g. osmotic adjustment) more effectively than the cul-tivated ssp. vulgaris. Many of these accessions are
phe-notypically similar to sugar beet, and are probably de-rived from hybridization of “bolters”—i.e. sugar beet
plants flowered during their first year—with truly wild sea beets; these hybrids are known as “weedy” beets. The comparison of the response to limited water supply of these accessions with cultivated forms can give useful informations for the future exploitation of wild or weedy germplasm in sugar beet breeding [8].
In experiments with Beta accessions raised in pots up
ment. In previous experiments [10], run under con- trolled conditions, it was shown that B. vulgaris ssp. maritima accession IDBBNR7268 (International Data-
base for Beta number), had a significantly higher (0.95 MPa) osmotic adjustment compared to the cultivated diploid variety Bianca (0.81 MPa) and to other Beta ac-
cessions (leaf beet, garden beet, B. patellaris).
The aim of the present work was to compare the re- sponse to a progressive water shortage applied gradually throughout the growth season to well developed plants of
B vulgaris ssp. vulgaris and B vulgaris ssp. maritima
grown outdoor in pots under rain shelters. The aim was the physiological and molecular analysis of representa- tive accessions of both cultivated and wild/weedy germ- plasm, for the identification of possible variations in the gene expression—either constitutive or induced by low soil potentials—of some genes selected among those known to be influenced by a low water potential; there- fore, the responses to a progressive water shortage- measured as an increase in soil potential in the treated plants- of the two subspecies were compared throughout a 4-month period, by periodically measuring the osmotic potential of leaf tissue and the expression levels of the selected genes.
2. Materials and Methods
2.1. Experimental Setup
Twelve plants for each accession (B. vulgaris ssp. mari- tima IDBBNR7268 and B. vulgaris ssp. vulgaris cv. Bi-
anca) and treatment (low- and high-soil potential) were germinated in paper pots and transplanted at the sec- ond-leaf stage (in March) in 100 liter pots, and arranged in alternate rows under two rain shelters. Water delivery was controlled through a computerized system, on the basis of daily readings of soil potential made on six pots per treatment, in which water tensiometers were in- stalled.
The time-course of average soil potential of the two groups of plants (controls and stressed) is shown in Fig- ure 1.
At the end of May, after a two-month growth period under optimal water availability, a differentiated water- ing regime was applied to the control and stressed plant groups. Following this regime, the soil potential of the watered plants remained around −10 cbar until the end of the season, while the soil potential of the stressed plants slowly reached an average of −70/−80 cbar at mid-Au- gust (Figure 1).
[image:2.595.309.537.86.216.2]During the growth season, leaf discs were sampled from control and stressed plants of both accessions, for the measurements of water status, gene expression analy- sis and sugar determination.
Figure 1. Variation of soil potential during the growth sea-son in control (dark gray dots) and treated (light gray dots) plants.
2.2. Osmotic Potential and RWC Measurements
Leaf osmotic potential (OP) was measured on two 15 mm leaf discs of each plants, frozen in liquid nitrogen and stored at −80˚C until the measurement. Once thawed, the discs were centrifuged for 5 min. at 3000 g; the measurement of OP was carried out on 10 μL aliquots of the sap collected at the bottom of the tube. The osmolar- ity was measured with a Wescor 5520 VAPRO (Logan, USA) vapour pressure osmometer; the conversion from mosmol/kg to MPa was made as in [10]. Relative water content of leaf samples taken during the growth period were measured as described in [10]. Progressive water limitation was applied to plants of both accessions start- ing from May 28 (60 d.a.p.), until the leaf OP was dif- ferent in the stressed (av. −2.0 MPa) and control plants (av. −1.4 MPa), at the end of August.
2.3. RNA Isolation and qPCR
RNA was extracted using the RNeasy plant mini kit (Qiagen); cDNA was synthesized from 5 μg RNA using High-Capacity Reverse Transcription Kits (Applied Biosystems). Real time-PCR was carried out by TaqMan assay (Applied Biosystems) including 5’FAM labelled probes MGB, on a Rotorgene 6000 System (Corbett Life Science). For each gene, specific intron-spanning primers and probes were designed by software File Builder 3.0. The sequences of the genes selected were obtained by screening of the Tentative Consenus (TC) sequences in the Sugar Beet EST Database curated by USDA and in the BvGI (Beta vulgaris Gene Index) database main-
tained by TIGR. A master mix for each qPCR run was prepared with TaqMan Universal PCR Master Mix (Ap- plied Biosystems). 18S RNA transcription levels were very uniform among the growth periods analysed (May, August and September), among the suspecies (ssp. vul- garis and ssp. maritima) and the treatments (low and
5.5%) among all the samples tested (2 replicates × 3 pe- riods × 2 subspecies × 2 treatments); therefore, 18S RNA amounts were always taken as reference to measure the transcript levels of the target genes The only exception was the quantitation of DREB2A transcripts; due to the low abundance of this target gene, tubulin gene was used instead of 18S RNA as reference [11].
Fifty ng of cDNA were used as template for real time PCR. All the samples were amplified in triplicate, and run twice in separate plates. Negative controls, RT minus (absence of reverse transcription) and NTC (no template), were always added to each plate. The reproducibility was measured by comparing the efficiencies in order to com- pare different assays; all efficiencies resulted between 86% and 100% with an inter-assay variation always less than 5%.
The target genes selected were the following: sucrose synthase 1 (SBSS1), sucrose phosphate synthase 2 (SPS2), choline monoxygenase (CMO), subunit 1 of plasma mem- brane aquaporin (PIP1), dehydration responsive element binding protein (DREB2A), and RuBisCo small subunit 1 (ss1RuBisCo). The primer design for real time assays was carried out as described in [11]. The transcript levels of the target genes were normalized to the most suitable reference genes, and compared in target versus control samples by the comparative Ct method. According to [12], the fold change in gene expression was calculated by relative quantitation method of comparative Ct (2−ΔΔCt). The calibrators used for relative quantification were: May for comparison between growth periods; ssp. vulgaris for
subspecies comparison; full watering (i.e. low soil water
potentials and higher leaf osmotic potentials) for treat-ments’ comparison.
3. Results and Discussion
The slow and progressive drying of the soil in the treated group of plants of the two accessions, produced an effec- tive adaptation, as no significant biomass loss in both accessions tested was observed (data not shown); this capacity of adaptation of Beta vulgaris had already been
observed previously in the capacity of the plants not to loose biomass and sugar yield when a salinity stress was progressively applied in experimental conditions similar to those of the field (large pots under rain shelters, [13]. The ability of Beta species to maintain high RWC, turgor
and growth despite the decrease in soil potential had been proposed as deriving from the response of osmotic ad-justment rather than stomata closure [7]; indeed, in our experiments the average leaf OP in both subspecies de-creased from an initial −1.0 MPa (on May 25) up to a final −2.1 MPa in treated plants, concordingly with the change of soil potential from −10 to −70 cbars, while in the control plants OP remained constant (Figure 2). This
slow decrease in the cellular OP value, however, was not due to water loss, as foliar RWC determined on fully expanded leaves, remained unchanged between the two accessions and treatments over a wide range of soil po-tential values, confirming that mechanisms of osmotic adjustment are actively operating, able to accumulate so- lutes in order to retain tissutal water and sustain growth [10]. Also the final fresh weight of control and stressed plants of both accessions was not significantly different (data not shown).
Gene expression levels were compared between the growth periods for control plants (May-August-Septem- ber, section A of Table 1), between the treatments for
each accession (control and stressed, section B of Table 1) or between accessions in control plants. (B. vulgaris
and B. maritima, section C of Table 1); in these com-
[image:3.595.310.533.374.678.2]parisons, the effects of the time after planting, of the treatment and of the genotype on the expression of 6 tar- get genes were estimated.18S RNA was the reference genes, as it showed an extremely low level of variation between genotypes, harvest date of samples, and treat- ments (data not shown); however, as the level of expres- sion of one of the target genes tested, DREB2A, was
Figure 2. Dependance of cellular osmotic potential (top) and relative water content (bottom) of leaf samples on different soil potentials during the growth season. Each point is the average of four or six data from leaf discs excised from
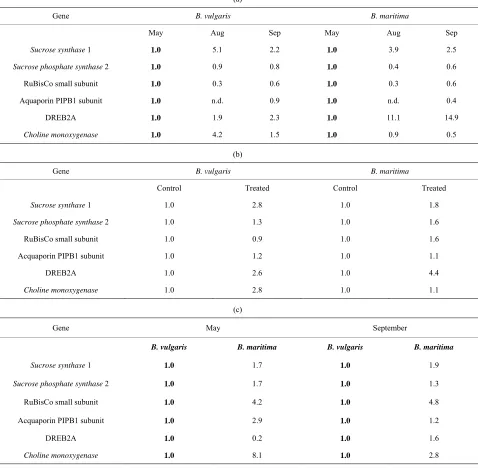
Table 1. Relative gene expression levels for the six target genes in different comparisons. For each comparison, values taken as calibrators are indicated in bold: (a) Comparison between growth stages (control plants); (b) Comparison between treat-ments (for each accessions); (c) Comparison between accessions (control plants).
(a)
Gene B. vulgaris B. maritima
May Aug Sep May Aug Sep
Sucrose synthase 1 1.0 5.1 2.2 1.0 3.9 2.5
Sucrose phosphate synthase 2 1.0 0.9 0.8 1.0 0.4 0.6
RuBisCo small subunit 1.0 0.3 0.6 1.0 0.3 0.6
Aquaporin PIPB1 subunit 1.0 n.d. 0.9 1.0 n.d. 0.4
DREB2A 1.0 1.9 2.3 1.0 11.1 14.9
Choline monoxygenase 1.0 4.2 1.5 1.0 0.9 0.5
(b)
Gene B. vulgaris B. maritima
Control Treated Control Treated
Sucrose synthase 1 1.0 2.8 1.0 1.8
Sucrose phosphate synthase 2 1.0 1.3 1.0 1.6
RuBisCo small subunit 1.0 0.9 1.0 1.6
Acquaporin PIPB1 subunit 1.0 1.2 1.0 1.1
DREB2A 1.0 2.6 1.0 4.4
Choline monoxygenase 1.0 2.8 1.0 1.1
(c)
Gene May September
B. vulgaris B. maritima B. vulgaris B. maritima
Sucrose synthase 1 1.0 1.7 1.0 1.9
Sucrose phosphate synthase 2 1.0 1.7 1.0 1.3
RuBisCo small subunit 1.0 4.2 1.0 4.8
Acquaporin PIPB1 subunit 1.0 2.9 1.0 1.2
DREB2A 1.0 0.2 1.0 1.6
Choline monoxygenase 1.0 8.1 1.0 2.8
very low (i.e. average Ct values around 43,0) compared
to the high abundance of 18S RNA gene, for the quanti- fication of DREB2A, tubulin, another well-established housekeeping gene, was used as reference.
Sucrose is synthetized in the leaves mainly by sucrose phosphate synthases (SPS), while sucrose synthases (SBSS) are engaged in the cleavage of sucrose; the rela- tive rate of transcription of the isoform 2 of SPS and of the isoform 1 of SBSS were quantified and are shown in
Table 1. Transcription rate of the cleaving enzyme
SBSS1 increased during the season, peaking in August
(Table 1(a)), and was also enhanced by the lowering of
soil potential during application of the stress (Table 1(b))
in both accessions. The basal transcription level of SBSS1 is slightly higher in sea beet than in sugar beet during all season (Table 1(c)).
The transcription of the synthetizing enzyme sucrose phosphate synthase 2, showed on the contrary very small changes in all conditions tested, and again, it was consti- tutively slightly higher in control plants of the wild beet compared to the cultivated one (Tables 1(a)-(c)); how-
motic potential was observed.
The rate of transcription in the leaves of these two key enzymes of the sugars metabolism were not immediately related with the levels of sugars substrate or products of their activities (sucrose, glucose, fructose), as detected by HPLC in the leaves (data not shown).
In response to drought stress, expression of a large number of genes is up or down-regulated. Drought stress is known to decrease the amounts of Rubisco small sub- unit transcripts [14]. However in sugar beet leaves, slow stress deriving from lowering soil potential did not in- duce changes in Rubisco small subunit transcription, while a slight increase was recorded in sea beet (Table 1(b)). In untreated leaves, the expression of Rubisco
small subunit was at higher levels (4 - 5×) in B. maritima
than B. vulgaris during growth (Table 1(c)); its tran-
scription showed a decline in untreated plants throughout the growth, in a pattern that was the same for both acces- sions (Table 1(a)).
According to [7,15], Beta species appear to be aniso-
hydric plants, reacting to a mild water stress by osmotic adjustment rather than by closing stomata. The lack of observed growth limitation and the capacity to increase tissutal osmotic pressure not associated to a significant foliar water loss, shown by our data, seem to confirm this fact. It has been reported that anisohydric behaviour does not require modulation of acquaporins, but rather their constitutive expression [15,16]. PIP1 subunit of plasma membrane acquaporin indeed did not show any regula- tion following onset of water shortage (Table 1(b)), and
was found only slightly and transiently higher in Beta vulgaris ssp. maritima compared to ssp. vulgaris (Table 1(c)).
DREB2A is a transcription factor known in Arabidop- sis to be activated during early exposition to drought
stress, through interaction with cis-acting dehydration-
responsive elements. Under normal conditions, during the season a slight increase in DREB2A transcription was observed in B. vulgaris leaves (2.3× in September),
while in B. maritima this increase was much stronger, up
to 15× in September compared to May (Table 1(a)); the
response to the lowering soil potential was evident in both accessions, as treated plants transcribed DREB2A almost 3× (B. vulgaris) or 4.4× (B. maritima) compared
to controls (Table 1(b)). Finally, the comparison of the
two accessions in control plants showed a lower tran- scription of DREB2A in May in sea beet, but a slightly higher one in September (Table 1(c)).
Choline monoxygenase is an enzyme involved in the synthesis of the compatible solute glycin betaine, and it was demonstrated in sugar beet to be up-regulated by water stress [17]. During the season, in control plants a transient increase in transcription levels in sugar beet was observed, while in sea beet a steady decline from May to
September (Table 1(a)) was observed; the drying of soil
induced a 2.4x increase in B. vulgaris, while transcription
levels remained constant in B. maritima (Table 1(b));
this failure in a stimulation of CMO expression during water-limiting growth conditions in wild beet, however, can be explained by a much higher basal transcription rate in sea beet compared to sugar beet, ranging from over 8× in May to about 3× late in the season (Table 1(c)).
In conclusion, both wild and cultivated accessions were able to stand increasingly dry soil conditions with- out significant loss of water and growth delay, probably due to osmotic adjustment mechanisms, especially effect- tive during slow onset of water shortage. The adaptation showed by the two beet accessions to slow decrease of soil potential was probably not mediated by ABA, as it is known that Beta is a genus not responding to drought by
closing stomata [7]; this limited dependence from ABA- mediated response could explain both the lack of aq- uaporins induction and the slow and small increase in DREB2A transcription. However, an enhancement of transcription of enzymes involved in other water-short- age responses (CMO) and in the mobilization of sucrose (SBSS1) was observed, while no changes in the tran- scription of the sucrose-synthetizing enzyme SPS2 was recorded.
Interesting differences in the gene expression levels between the wild and the cultivated accession were ob- served either in control and in treated plants, especially for choline monoxygenase gene and for DREB2A tran- scription factor, suggesting that the differential responses of the two subspecies to a rapidly-occurring water short- age, previously described [10], but also to a slow adapta- tion, might involve a long-term transcriptional regulation also for these genes.
REFERENCES
[1] M. J. C. Asher and S. A. Francis, “Exploiting Disease Resistance in Beta Germplasm,” Report of the Second Joint Meeting of the Working Group on Beta and World Beta Network, Bologna, 23-26 October 2002, p. 111. [2] J. S. Boyer, “Plant Productivity and Environment,” Sci-
ence, Vol. 218, No. 4571, 1982, pp. 443-448. doi:10.1126/science.218.4571.443
[3] E. S. Ober, C. J. A. Clark, M. Le Bloa, A. Royal, K. W. Jaggard and J. D. Pidgeon, “Assessing the Genetic Re- sources to Improve Drought Tolerance in Sugar Beet: Agronomic Traits of Diverse Genotypes under Droughted and Irrigated Conditions,” Field Crops Research, Vol. 90, No. 2-3, 2004, pp. 213-234.
doi:10.1016/j.fcr.2004.03.004
2005, pp. 231-249. doi:10.1016/j.fcr.2004.07.012 [5] E. Biancardi, G. Mandolino and W. Boschetti, “A Study
of the Sugar Beet Root System by Endoscopic Tech- niques,” Proceedings of the 29th General Meeting of American Society of Sugar Beet Technologists, Phoenix, 2-5 March 1997, pp. 73-81.
[6] P. V. Biscoe, “The Diffusion Resistance and Water Status of Leaves of Beta vulgaris,” Journal of Experimental Botany, Vol. 23, No. 4, 1972, pp. 930-940.
doi:10.1093/jxb/23.4.930
[7] K. J. McCrea and S. G. Richardson, “Stomatal Closure vs. Osmotic Adjustment: A Comparison of Stress Responses,” Crop Science, Vol. 27, No. 3, 1987, pp. 539-543. [8] E. Biancardi, L. W. Panella and R. T. Llewellen, “Beta
maritima. The Origin of Beets,” Springer, Berlin, 2012. doi:10.1007/978-1-4614-0842-0
[9] C. M. Hoffmann, “Sucrose Accumulation in Sugar Beet under Drought Stress,” Journal of Agronomy and Crop Science, Vol. 196, No. 4, 2010, pp. 243-252.
[10] M. Bagatta, D. Pacifico and G. Mandolino, “Evaluation of the Osmotic Adjustment Response within the Genus beta,” Journal of Sugar Beet Research, Vol. 45, No. 3-4, 2008, pp. 119-133. doi:10.5274/jsbr.45.3.119
[11] D. Pacifico, C. Onofri and G. Mandolino, “Cold-Modu- lated Expression of Genes Encoding for Key Enzymes of the Sugar Metabolism in Spring and Autumn cvs. of Beta vulgaris L.,” Plant Genetic Resources: Characterization and Utilization, Vol. 9, No. 2, 2011, pp. 268-271. doi:10.1017/S1479262111000438
[12] K. J. Livak and T. D. Schmittgen, “Analysis of Relative Gene Expression Data Using Real Time Quantitative PCR and the 2–ΔΔCt Method,”
Methods, Vol. 25, No. 4, 2001, pp. 402-408. doi:10.1006/meth.2001.1262
[13] N. Katerij, J. W. van Hoorn, A. Hamdy, M. Mas-Trorilli and E. Mou Karzel, “Osmotic Adjustment of Sugar Beets in Response to Salinity and Its Influence on Stomatal Conductance, Growth and Yield,” Agricultural Water Management, Vol. 34, No. 1, 1997, pp. 57-69.
doi:10.1016/S0378-3774(96)01294-2
[14] D. C. Dreesmann, C. Harn and J. Daie, “Expression of Genes Encoding Rubisco in Sugarbeet (Beta vulgaris L) Plants Subjected to Gradual Desiccation,” Plant and Cell Physiology, Vol. 35, No. 4, 1994, pp. 645-653.
[15] N. Sade, A. Gebremedhin and M. Moshelion, “Risk- Taking Plants. Anisohydric Behaviour as a Stress-Resis- tance Trait,” Plant Signaling and Behavior, Vol. 7, No. 7, 2012, pp. 767-770. doi:10.4161/psb.20505
[16] A. Pou, H. Medrano, J. Flexas and S. D. Tyerman, “A Putative Role for TIP and PIP Acquaporins in Dynamics of Leaf Hydraulic and Stomatal Conductances in Grape- vine under Water Stress and Re-Watering,”Plant, Cell& Environment, 2012, in Press. doi:10.1111/pce.12019 [17] B. L. Russell, B. Rathinasabapathi and A. D. Han-Son,
“Osmotic Stress Induces Expression of Choline Mono- oxygenase in Sugar Beet and Amaranth,” Plant Physiol- ogy, Vol. 116, No. 2, 1998, pp. 859-865.