Mukund R. Patel, Ph.D., P.E.
U.S. Merchant Marine Academy
Kings Point, New York
Formerly
Principal Engineer, General Electric Company
Fellow Engineer, Westinghouse Reasearch Center
Wind
and
Solar
Power Systems
Library of Congress Cataloging-in-Publication Data
Patel, Mukind R., 1942.
Wind and solar power systems / Mukund R. Patel. p. cm.
Includes bibliographical references and index. ISBN 0-8493-1605-7 (alk. paper)
1. Wind power plants. 2. Solar power plants. 3. Photovoltaic power systems. I. Title. TK1541.P38 1999
621.31′2136—dc21 98-47934
CIP
This book contains information obtained from authentic and highly regarded sources. Reprinted material is quoted with permission, and sources are indicated. A wide variety of references are listed. Reasonable efforts have been made to publish reliable data and information, but the author and the publisher cannot assume responsibility for the validity of all materials or for the consequences of their use.
Neither this book nor any part may be reproduced or transmitted in any form or by any means, electronic or mechanical, including photocopying, microfilming, and recording, or by any information storage or retrieval system, without prior permission in writing from the publisher.
The consent of CRC Press LLC does not extend to copying for general distribution, for promotion, for creating new works, or for resale. Specific permission must be obtained in writing from CRC Press LLC for such copying.
Direct all inquiries to CRC Press LLC, 2000 N.W., Corporate Blvd., Boca Raton, Florida 33431.
Trademark Notice: Product or corporate names may be trademarks or registered trademarks, and are used only for identification and explanation, without intent to infringe.
Visit the CRC Press Web site at www.crcpress.com
© 1999 by CRC Press LLC
No claim to original U.S. Government works International Standard Book Number 0-8493-1605-7
Library of Congress Card Number 98-47934
…dedicated
to my mother, Shakariba,
who practiced ingenuity,
and
to my children, Ketan, Bina, and Vijal,
who flattered me by being engineers.
Preface
The total electricity demand in 1997 in the United States of America was three trillion kWh, with the market value of $210 billion. The worldwide demand was 12 trillion kWh in 1997, and is projected to reach 19 trillion kWh in 2015. This constitutes the worldwide average annual growth of 2.6 percent. The growth rate in the developing countries is projected to be approximately 5 percent, almost twice the world average.
Most of the present demand in the world is met by fossil and nuclear power plants. A small part is met by renewable energy technologies, such as the wind, solar, biomass, geothermal and the ocean. Among the renewable power sources, wind and solar have experienced a remarkably rapid growth in the past 10 years. Both are pollution free sources of abundant power. Additionally, they generate power near the load centers, hence eliminate the need of run-ning high voltage transmission lines through rural and urban landscapes.
Since the early 1980s, the wind technology capital costs have declined by 80 percent, operation and maintenance costs have dropped by 80 percent and availability factors of grid-connected plants have risen to 95 percent. These factors have jointly contributed to the decline of the wind electricity cost by 70 percent to 5 to 7 cents per kWh. The grid-connected wind plant can generate electricity at cost under 5 cents per kWh. The goal of ongoing research programs funded by the U.S. Department of Energy and the National Renewable Energy Laboratory is to bring the wind power cost below 4 cents per kWh by the year 2000. This cost is highly competitive with the energy cost of the conventional power technologies. For these reasons, wind power plants are now supplying economical clean power in many parts of the world.
In the U.S.A., several research partners of the NREL are negotiating with U.S. electrical utilities to install additional 4,200 MW of wind capacity with capital investment of about $2 billion during the next several years. This amounts to the capital cost of $476 per kW, which is comparable with the conventional power plant costs. A recent study by the Electric Power Research Institute projected that by the year 2005, wind will produce the cheapest electricity available from any source. The EPRI estimates that the wind energy can grow from less than 1 percent in 1997 to as much as 10 percent of this country’s electrical energy demand by 2020.
the transmission line costs would be prohibitive. Many developing countries have large areas falling in this category. With ongoing research in the pho-tovoltaic (pv) technologies around the world, the pv energy cost is expected to fall to 12 to 15 cents per kWh or less in the next several years as the learning curves and the economy of scale come into play. The research programs funded by DOE/NREL have the goal of bringing down the pv energy cost below 12 cents per kWh by 2000.
After the restructuring of the U.S. electrical utilities, as mandated by the Energy Policy Act (EPAct) of 1992, the industry leaders expect the power generation business, both conventional and renewable, to become more prof-itable in the long run. The reasoning is that the generation business will be stripped of regulated price and opened to competition among electricity producers and resellers. The transmission and distribution business, on the other hand, would still be regulated. The American experience indicates that the free business generates more profits than the regulated business. Such is the experience in the U.K. and Chile, where the electrical power industry had been structured similar to the EPAct of 1992 in the U.S.A.
About the Author
Mukund R. Patel, Ph.D, P.E., is an experienced research engineer with 35 years of hands-on involvement in designing and developing state-of-the-art electrical power equipment and systems. He has served as principal power system engineer at the General Electric Company in Valley Forge, fellow engineer at the Westinghouse Research & Development Center in Pittsburgh, senior staff engineer at Lockheed Martin Corporation in Prince-ton, development manager at Bharat Bijlee Limited, Bombay, and 3M dis-tinguished visiting professor of electrical power technologies at the University of Minnesota, Duluth. Presently he is a professor at the U.S. Merchant Marine Academy in Kings Point, New York.
Dr. Patel obtained his Ph.D. degree in electric power engineering from the Rensselaer Polytechnic Institute, Troy, New York; M.S. in engineering man-agement from the University of Pittsburgh; M.E. in electrical machine design from Gujarat University and B.E.E. from Sardar University, India. He is a fellow of the Institution of Mechanical Engineers (U.K.), senior member of the IEEE, registered professional engineer in Pennsylvania, and a member of Eta Kappa Nu, Tau Beta Pi, Sigma Xi and Omega Rho.
About the Book
The book was conceived when I was invited to teach a course in the emerging electrical power technologies at the University of Minnesota in Duluth. The lecture notes and presentation charts I prepared for the course formed the first draft of the book. The subsequent teaching of a couple of short courses to professional engineers advanced the draft closer to the finished book. The book is designed and tested to serve as textbook for a semester course for university seniors in electrical and mechanical engineering fields. The prac-ticing engineers will get detailed treatment of this rapidly growing segment of the power industry. The government policy makers would benefit by overview of the material covered in the book.
Chapters 1 through 3 cover the present status and the ongoing research programs in the renewable power around the world and in the U.S.A. Chapter 4 is a detailed coverage on the wind power fundamentals and the probability distributions of the wind speed and the annual energy potential of a site. It includes the wind speed and energy maps of several countries. Chapter 5 covers the wind power system operation and the control require-ments. Since most wind plants use induction generators for converting the turbine power into electrical power, the theory of the induction machine performance and operation is reviewed in Chapter 6 without going into details. The details are left for the classical books on the subject. The electrical generator speed control for capturing the maximum energy under wind fluctuations over the year is presented in Chapter 7.
The power-generating characteristics of the photovoltaic cell, the array design, and the sun-tracking methods for the maximum power generation are discussed in Chapter 8. The basic features of the utility-scale solar ther-mal power plant using concentrating heliostats and molten salt steam turbine are presented in Chapter 9.
The more than two billion people in the world not yet connected to the utility grid are the largest potential market of stand-alone power systems. Chapter 12 presents the design and operating methods of such power sys-tems using wind and photovoltaic syssys-tems in hybrid with diesel generators. The newly developed fuel cell with potential of replacing diesel engine in urban areas is discussed. The grid-connected renewable power systems are covered in Chapter 13, with voltage and frequency control methods needed for synchronizing the generator with the grid. The theory and the operating characteristics of the interconnecting transmission line, the voltage regula-tion, the maximum power transfer capability, and the static and dynamic stability are covered.
Chapter 14 is about the overall electrical system design. The method of designing the system components to operate at their maximum possible efficiency is developed. The static and dynamic bus performance, the har-monics, and the increasingly important quality of power issues applicable to the renewable power systems are presented.
Chapter 15 discusses the total plant economy and the costing of energy delivered to the paying customers. It also shows the importance of a sensi-tivity analysis to raise confidence level of the investors. The profitability charts are presented for preliminary screening of potential sites. Finally, Chapter 16 discusses the past and present trends and the future of the green power. It presents the declining price model based on the learning curve, and the Fisher-Pry substitution model for predicting the market growth of the wind and pv power based on historical data on similar technologies. The effect of the utility restructuring, mandated by the EPAct of 1992, and its expected benefits on the renewable power producers are discussed.
Acknowledgment
The book of this nature on emerging technologies, such as the wind and photovoltaic power systems, cannot possibly be written without the help from many sources. I have been extremely fortunate to receive full support from many organizations and individuals in the field. They not only encour-aged me to write the book on this timely subject, but also provided valuable suggestions and comments during the development of the book.
Dr. Nazmi Shehadeh, head of the Electrical and Computer Engineering Department at the University of Minnesota, Duluth, gave me the opportunity to develop and teach this subject to his students who were enthusiastic about
learning new technologies. Dr. Elliott Bayly, president of the World Power
Technologies in Duluth, shared with me and my students his long experience in the field. He helped me develop the course outline, which later became
the book outline. Dr. Jean Posbic of Solarex Corporation in Frederick,
Mary-land and Mr. Carl-Erik Olsen of Nordtank Energy Group/NEG Micon,
Denmark, kindly reviewed the draft and provided valuable suggestions for
improvement. Mr. Bernard Chabot of ADEME, Valbonne, France, provided
the profitability charts for screening the wind and photovoltaic power sites.
Mr. Ian Baring-Gould of the National Renewable Energy Laboratory, Golden, Colorado, has been a source of useful information and the hybrid power plant simulation model.
Several institutions worldwide provided current data and reports on these
rather rapidly developing technologies. They are the American Wind Energy
Association, the American Solar Energy Society, the European Wind Energy Association, the Risø National Laboratory, Denmark, the Tata Energy Research Institute, India, and many corporations engaged in the wind and solar power technologies. Many individuals at these organizations gladly provided help I requested.
I gratefully acknowledge the generous support from all of you.
Contents
1. Introduction
1.1 Industry Overview
1.2 Incentives for Renewables
1.3 Utility Perspective
1.3.1 Modularity
1.3.2 Emission-Free
References
2. Wind Power
2.1 Wind in the World
2.2 The U.S.A.
2.3 Europe
2.4 India
2.5 Mexico
2.6 Ongoing Research and Development
References
3. Photovoltaic Power
3.1 Present Status
3.2 Building Integrated pv Systems
3.3 pv Cell Technologies
3.3.1 Single-Crystalline Silicon
3.3.2 Polycrystalline and Semicrystalline
3.3.3 Thin Films
3.3.4 Amorphous Silicon
3.3.5 Spheral
3.3.6 Concentrated Cells
3.4 pv Energy Maps
References
4. Wind Speed and Energy Distributions
4.1 Speed and Power Relations
4.2 Power Extracted from the Wind
4.3 Rotor Swept Area
4.4 Air Density
4.5 Global Wind Patterns
4.6 Wind Speed Distribution
4.6.1 Weibull Probability Distribution
4.6.3 Root Mean Cube Speed
4.6.4 Mode, Mean, and rmc Speeds Compared
4.6.5 Energy Distribution
4.6.6 Digital Data Loggers
4.6.7 Effect of Height
4.6.8 Importance of Reliable Data
4.7 Wind Speed Prediction
4.8 Wind Resource Maps
4.8.1 The U.S.A.
4.8.2 Minnesota
4.8.3 The United Kingdom
4.8.4 Europe
4.8.5 Mexico
4.8.6 India
References
5. Wind Power System
5.1 System Components
5.1.1 Tower
5.1.2 Turbine Blades
5.1.3 Yaw Control
5.1.4 Speed Control
5.2 Turbine Rating
5.3 Electrical Load Matching
5.4 Variable-Speed Operation
5.5 System Design Features
5.5.1 Number of Blades
5.5.2 Rotor Upwind or Downwind
5.5.3 Horizontal Axis Versus Vertical Axis
5.5.4 Spacing of the Towers
5.6 Maximum Power Operation
5.6.1 Constant Tip-Speed Ratio Scheme
5.6.2 Peak Power Tracking Scheme
5.7 System Control Requirements
5.7.1 Speed Control
5.7.2 Rate Control
5.8 Environmental Aspects
5.8.1 Audible Noise
5.8.2 Electromagnetic Interference (EMI)
References
6. Electrical Generator
6.1 Electromechanical Energy Conversion
6.1.1 DC Machine
6.1.2 Synchronous Machine
6.2 Induction Generator
6.2.1 Construction
6.2.2 Working Principle
6.2.3 Rotor Speed and Slip
6.2.4 Equivalent Circuit for Performance Calculations
6.2.5 Efficiency and Cooling
6.2.6 Self-Excitation Capacitance
6.2.7 Torque-Speed Characteristic
6.2.8 Transients
References
7. Generator Drives
7.1 Speed Control Regions
7.2 Generator Drives
7.2.1 One Fixed-Speed Drive
7.2.2 Two Fixed-Speeds Drive
7.2.3 Variable-Speed Using Gear Drive
7.2.4 Variable-Speed Using Power Electronics
7.2.5 Scherbius Variable-Speed Drive
7.2.6 Variable-Speed Direct Drive
7.3 Drive Selection
7.4 Cut-Out Speed Selection
References
8. Solar Photovoltaic Power System
8.1 The pv Cell
8.2 Module and Array
8.3 Equivalent Electrical Circuit
8.4 Open Circuit Voltage and Short Circuit Current
8.5 i-v and p-v Curves
8.6 Array Design
8.6.1 Sun Intensity
8.6.2 Sun Angle
8.6.3 Shadow Effect
8.6.4 Temperature Effect
8.6.5 Effect of Climate
8.6.6 Electrical Load Matching
8.6.7 Sun Tracking
8.7 Peak Power Point Operation
8.8 pv System Components
References
9. Solar Thermal System
9.1 Energy Collection
9.1.1 Parabolic Trough
9.1.2 Central Receiver
9.2 Solar II Power Plant
9.3 Synchronous Generator
9.3.1 Equivalent Electrical Circuit
9.3.2 Excitation Methods
9.3.3 Electrical Power Output
9.3.4 Transient Stability Limit
9.4 Commercial Power Plants
References
10. Energy Storage
10.1 Battery
10.2 Types of Batteries
10.2.1 Lead-Acid
10.2.2 Nickel Cadmium
10.2.3 Nickel-Metal Hydride
10.2.4 Lithium-Ion
10.2.5 Lithium-Polymer
10.2.6 Zinc-Air
10.3 Equivalent Electrical Circuit
10.4 Performance Characteristics
10.4.1 Charge/Discharge Voltages
10.4.2 Charge/Discharge Ratio
10.4.3 Energy Efficiency
10.4.4 Internal Resistance
10.4.5 Charge Efficiency
10.4.6 Self-Discharge and Trickle Charge
10.4.7 Memory Effect
10.4.8 Effects of Temperature
10.4.9 Internal Loss and Temperature Rise
10.4.10 Random Failure
10.4.11 Wear-Out Failure
10.4.12 Various Batteries Compared
10.5 More on Lead-Acid Battery
10.6 Battery Design
10.7 Battery Charging
10.8 Charge Regulators
10.8.1 Multiple Charge Rates
10.8.2 Single Charge Rate
10.8.3 Unregulated Charging
10.9 Battery Management
10.9.1 Monitoring and Controls
10.9.2 Safety
10.10 Flywheel
10.10.1 Energy Relations
10.10.2 Flywheel System Components
10.11 Compressed Air
10.12 Superconducting Coil
References
11. Power Electronics
11.1 Basic Switching Devices
11.2 AC to DC Rectifier
11.3 DC to AC Inverter
11.4 Grid Interface Controls
11.4.1 Voltage Control
11.4.2 Frequency Control
11.5 Battery Charge/Discharge Converters
11.5.1 Battery Charge Converter
11.5.2 Battery Discharge Converter
11.6 Power Shunts
References
12. Stand-Alone System
12.1 pv Stand-Alone
12.2 Electric Vehicle
12.3 Wind Stand-Alone
12.4 Hybrid System
12.4.1 Hybrid with Diesel
12.4.2 Hybrid with Fuel Cell
12.4.3 Mode Controller
12.4.4 Load Sharing
12.5 System Sizing
12.5.1 Power and Energy Estimates
12.5.2 Battery Sizing
12.5.3 pv Array Sizing
12.6 Wind Farm Sizing
References
13. Grid-Connected System
13.1 Interface Requirements
13.2 Synchronizing with Grid
13.2.1 Inrush Current
13.2.2 Synchronous Operation
13.2.3 Load Transient
13.2.4 Safety
13.3 Operating Limit
13.3.1 Voltage Regulation
13.3.2 Stability Limit
13.4 Energy Storage and Load Scheduling
13.5 Utility Resource Planning Tool
14. Electrical Performance
14.1 Voltage Current and Power Relations
14.2 Component Design for Maximum Efficiency
14.3 Electrical System Model
14.4 Static Bus Impedance and Voltage Regulation
14.5 Dynamic Bus Impedance and Ripple
14.6 Harmonics
14.7 Quality of Power
14.7.1 Harmonic Distortion
14.7.2 Voltage Transients and Sags
14.7.3 Voltage Flickers
14.8 Renewable Capacity Limit
14.8.1 Systems Stiffness
14.8.2 Interfacing Standards
14.9 Lightning Protection
14.10 National Electrical Code® on Renewable Power Systems
References
15. Plant Economy
15.1 Energy Delivery Factor
15.2 Initial Capital Cost
15.3 Availability and Maintenance
15.4 Energy Cost Estimates
15.5 Sensitivity Analysis
15.5.1 Effect of Wind Speed Variations
15.5.2 Effect of Tower Height
15.6 Profitability Index
15.6.1 Wind Farm Screening Chart
15.6.2 pv Park Screening Chart
15.6.3 Stand-Alone pv Versus Grid Line
15.7 Hybrid Economics
References
16. The Future
16.1 World Electricity Demand to 2015
16.2 Wind Future
16.3 pv Future
16.4 Declining Production Costs
16.5 Market Penetration
16.6 Effect of Utility Restructuring
16.6.1 Energy Policy Act of 1992
16.6.2 Impact on Renewable Power Producers
References
Appendix 2 Acronyms
1
Introduction
1.1 Industry Overview
The total annual primary energy consumption in 1997 was 390 quadrillion
(1015) BTUs worldwide1 and over 90 quadrillion BTUs in the United States
of America, distributed in segments shown in Figure 1-1. About 40 percent of the total primary energy is used in generating electricity. Nearly 70 percent of the energy used in our homes and offices is in the form of electricity. To meet this demand, 700 GW of electrical generating capacity is now installed in the U.S.A. For most of this century, the U.S. electric demand has increased with the gross national product (GNP). At that rate, the U.S. will need to install additional 200 GW capacity by the year 2010.
The new capacity installation decisions today are becoming complicated in many parts of the world because of difficulty in finding sites for new generation and transmission facilities of any kind. In the U.S.A., no nuclear
power plants have been ordered since 19782 (Figure 1-2). Given the potential
for cost overruns, safety related design changes during the construction, and local opposition to new plants, most utility executives suggest that none will be ordered in the foreseeable future. Assuming that no new nuclear plants are built, and that the existing plants are not relicensed at the expiration of their 40-year terms, the nuclear power output is expected to decline sharply after 2010. This decline must be replaced by other means. With gas prices expected to rise in the long run, utilities are projected to turn increasingly to coal for base load-power generation. The U.S.A. has enormous reserves of coal, equivalent to more than 250 years of use at current level. However, that will need clean coal burning technologies that are fully acceptable to the public.
power sources, wind and solar have recently experienced a rapid growth around the world. Having wide geographical spread, they can be generated near the load centers, thus simultaneously eliminating the need of high voltage transmission lines running through rural and urban landscapes.
The present status and benefits of the renewable power sources are com-pared with the conventional ones in Tables 1-1 and 1-2, respectively.
[image:19.666.56.388.247.453.2]The renewables compare well with the conventionals in economy. Many energy scientists and economists believe that the renewables would get much more federal and state incentives if their social benefits were given full credit.
FIGURE 1-1
Primary energy consumption in the U.S.A. in three major sectors, total 90 quadrillion BTUs in 1997. (From U.S. Department of Energy, Office of the Integrated Analysis and Forecasting, Report No. DE-97005344, April 1997.)
FIGURE 1-2
For example, the value of not generating one ton of CO2, SO2, and NOx, and
the value of not building long high voltage transmission lines through rural and urban areas are not adequately reflected in the present evaluation of the renewables.
1.2 Incentives for Renewables
A great deal of renewable energy development in the U.S.A. occurred in the 1980s, and the prime stimulus for it was the passage in 1978 of the Public Utility Regulatory Policies Act (PURPA). It created a class of nonutility power generators known as the “qualified facilities (QFs)”. The QFs were defined to be small power generators utilizing renewable energy sources and/or cogeneration systems utilizing waste energy. For the first time, PURPA required electric utilities to interconnect with QFs and to purchase QFs’ power generation at “avoided cost”, which the utility would have incurred by generating that power by itself. PURPA also exempted QFs from certain
TABLE 1-1
Status of Conventional and Renewable Power Sources
Conventional Renewables
Coal, nuclear, oil, and natural gas Wind, solar, biomass geothermal, and ocean Fully matured technologies Rapidly developing technologies
Numerous tax and investment subsidies embedded in national economies
Some tax credits and grants available from some federal and/or state governments
Accepted in society under the ‘grandfather clause’ as necessary evil
Being accepted on its own merit, even with limited valuation of their environmental and other social benefits
TABLE 1-2
Benefits of Using Renewable Electricity
Traditional Benefits
Nontraditional Benefits Per Million kWh consumed
Monetary value of kWh consumed U.S. average 12 cents/kWh U.K. average 7.5 pence/kWh
Reduction in emission 750–1000 tons of CO2 7.5–10 tons of SO2 3–5 tons of NOx
50,000 kWh reduction in energy loss in power lines and equipment
federal and state utility regulations. Furthermore, significant federal invest-ment tax credit, research and developinvest-ment tax credit, and energy tax credit, liberally available up to the mid 1980s, created a wind rush in California, the state that also gave liberal state tax incentives. As of now, the financial incentives in the U.S.A. are reduced, but are still available under the Energy Policy Act of 1992, such as the energy tax credit of 1.5 cents per kWh. The potential impact of the 1992 act on renewable power producers is reviewed in Chapter 16.
Globally, many countries offer incentives and guaranteed price for the renewable power. Under such incentives, the growth rate of the wind power in Germany and India has been phenomenal.
1.3 Utility Perspective
Until the late 1980s, the interest in the renewables was confined primarily among private investors. However, as the considerations of fuel diversity, environmental concerns and market uncertainties are becoming important factors into today’s electric utility resource planning, renewable energy tech-nologies are beginning to find their place in the utility resource portfolio. Wind and solar power, in particular, have the following advantages to the electric utilities:
• Both are highly modular in that their capacity can be increased incrementally to match with gradual load growth.
• Their construction lead time is significantly shorter than those of the conventional plants, thus reducing the financial and regulatory risks. • They bring diverse fuel sources that are free of cost and free of
pollution.
Because of these benefits, many utilities and regulatory bodies are increas-ingly interested in acquiring hands on experience with renewable energy technologies in order to plan effectively for the future. The above benefits are discussed below in further details.
1.3.1 Modularity
The electricity demand in the U.S.A. grew at 6 to 7 percent until the late 1970s, tapering to just 2 percent in the 1990s as shown in Figure 1-3.
The economic size of the conventional power plant has been 500 MW to 1,000 MW capacity. These sizes could be justified in the past, as the entire power plant of that size, once built, would be fully loaded in just a few years. At a 2 percent growth rate, however, it could take decades before a 500 MW plant could be fully loaded after it is commissioned in service. Utilities are unwilling to take such long-term risks in making investment decisions. This has created a strong need of modularity in today’s power generation industry. Both the wind and the solar photovoltaic power are highly modular. They allow installations in stages as needed without losing the economy of size in the first installation. The photovoltaic (pv) is even more modular than the wind. It can be sized to any capacity, as the solar arrays are priced directly by the peak generating capacity in watts, and indirectly by square foot. The wind power is modular within the granularity of the turbine size. Standard wind turbines come in different sizes ranging from tens of kW to hundreds of kW. Prototypes of a few MW wind turbines are also tested and are being made commercially available in Europe. For utility scale installations, stan-dard wind turbines in the recent past have been around 300 kW, but is now in the 500-1,000 kW range. A large plant consists of the required number and size of wind turbines for the initially needed capacity. More towers are added as needed in the future with no loss of economy.
For small grids, the modularity of the pv and wind systems is even more important. Increasing demand may be more economically added in smaller increments of the green power capacity. Expanding or building a new con-ventional power plant in such cases may be neither economical nor free from the market risk. Even when a small grid is linked by transmission line to the main network, installing a wind or pv plant to serve growing demand may be preferable to laying another transmission line. Local renewable
FIGURE 1-3
power plants can also benefit small power systems by moving generation near the load, thus reducing voltage drop at the end of a long overloaded line. In the developing countries like China and India, the demand has been rising at a 10 percent growth rate or more. This growth rate, when viewed with the large population base, makes these two countries rapidly growing electrical power markets for all sources of electrical energy, including the renewables.
1.3.2 Emission-Free
In 1995, the U.S.A. produced 3 trillion kWh of electricity, 70 percent of it (2 trillion kWh) from fossil fuels, a majority of that came from coal. The
resulting emission is estimated to be 2 billion tons of CO2, 15 million tons of
SO2 and 6 million tons of NOx. The health effects of these emissions are of
significant concern to the U.S. public. The electromagnetic field emission around the high voltage transmission lines is another concern that has also recently become an environmental issue.
For these benefits, the renewable energy sources are expected to find importance in the energy planning in all countries around the world.
References
1. U.S. Department of Energy. 1997. “International Energy Outlook 1997 with Projections to 2015,” DOE Office of the Integrated Analysis and Forecasting, Report No. DE-97005344, April 1997.
2. Felix, F. 1992. “State of the Nuclear Economy,” IEEE Spectrum, November 1997,
2
Wind Power
The first use of wind power was to sail ships in the Nile some 5000 years ago. The Europeans used it to grind grains and pump water in the 1700s and 1800s. The first windmill to generate electricity in the rural U.S.A. was installed in 1890. Today, large wind-power plants are competing with electric utilities in supplying economical clean power in many parts of the world.
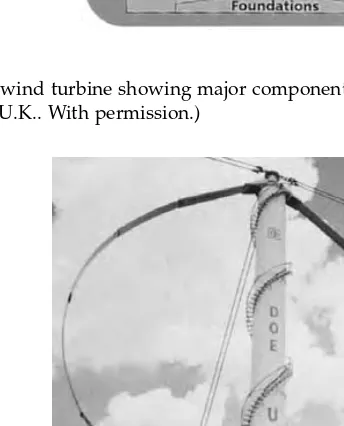
The average turbine size of the wind installations has been 300 kW until the recent past. The newer machines of 500 to 1,000 kW capacity have been developed and are being installed. Prototypes of a few MW wind turbines are under test operations in several countries, including the U.S.A. Figure 2-1 is a conceptual layout of modern multimegawatt wind tower suitable for utility scale applications.1
Improved turbine designs and plant utilization have contributed to a decline in large-scale wind energy generation costs from 35 cents per kWh in 1980 to less than 5 cents per kWh in 1997 in favorable locations (Figure 2-2). At this price, wind energy has become one of the least-cost power sources. Major factors that have accelerated the wind-power technol-ogy development are as follows:
• high-strength fiber composites for constructing large low-cost blades. • falling prices of the power electronics.
• variable-speed operation of electrical generators to capture maxi-mum energy.
• improved plant operation, pushing the availability up to 95 percent. • economy of scale, as the turbines and plants are getting larger in size. • accumulated field experience (the learning curve effect) improving
the capacity factor.
2.1 Wind in the World
FIGURE 2-1
technology by national programs and market incentives. The International Energy Agency (IEA), with funding from 14 countries, supports joint
research projects and information exchange on wind-power development.2
These countries are Austria, Canada, Denmark, Finland, Germany, Italy, Japan, the Netherlands, New Zealand, Norway, Spain, Sweden, the United Kingdom, and the United States of America. By the beginning of 1995, more than 25,000 grid-connected wind turbines were operating in the IEA-member countries, amounting to a rated power capacity of about 3,500 MW. Collec-tively, these turbines are producing more than 6 million MWh of energy every year. The annual rate of capacity increase presently is about 600 MW. According to the AWEA and the IEA, the 1994, 1995, and 1997 installed capacity in countries listed in Table 2-1 were 3,552 MW, 4,776 MW, and 7,308 MW, respectively. The 1995 sales of new plants set a record of 1224 MW ($1.5 billion), boosting the global installed capacity by 35 percent to nearly 4,776 MW. The most explosive growth occurred in Germany installing 500 MW and India adding 383 MW to their wind capacities. New wind plants installed in 1996-97 added another 2,532 MW to that total with an annual growth rate of 24 percent.
Much of the new development around the world can be attributed to government policies to promote the renewables energy sources. For example, the United Kingdom’s nonfossil fuel obligation program will add 500 MW of wind power to the UK’s power grid within this decade.
A 1994 study, commissioned by the American Wind Energy Association (AWEA) with Arthur D. Little Inc., concluded that in the 10 overseas wind farm markets, between 1,935 MW and 3,525 MW of wind capacity would be added by the year 2000 (Table 2-2). This translates to between $2 to $3.5 billion in sales.
FIGURE 2-2
2.2 The U.S.A.
Large-scale wind-power development in the U.S.A. has been going on since the late 1970s. In 1979, a 2 MW experimental machine was installed jointly by the Department of Energy and NASA on the Howard Knob Mountain near Boone, North Carolina. The system was designed and built by the
TABLE 2-1
Installed Wind Capacity in Selected Countries, 1994, 1995 and 1997
Country 1994 MW 1995 MW 1997 MW Growth 1994-1995 Percent
Annual Growth Rate 1995-97 Percent
Germany 643 1136 2079 76.7 35.2
United States 1785 1828 2000 2.4 4.7
Denmark 540 614 1141 13.7 36.3
India 182 565 1000 210 33.0
Netherlands 153 259 325 69 12.0
United Kingdom 147 193 308 31 26.3
Spain 72 145 455 100 77.1
China 30 36 — 20 —
TOTAL 3552 4776 7308 35.4 23.7
(Source: United States data from Energy Information Administration, Annual Energy Outlook 1997, DOE/EIA Report No. 0383-97, Table A17, Washington, D.C., December 1996. Other countries data from the Amercian Wind Energy Association, Satus Report of International Wind Projects, Washington, D.C., March 1996.)
TABLE 2-2
Projected Wind Capacity Addition in Megawatts Between 1994 and 2000
Country
Addition planned Megawatts
United Kingdom 100–300
Spain 150–250 Germany 200–350 India 700–1200 China 350–600 Mexico 150–300 Argentina 100–150 Chile 100–200 Australia 50–75
New Zealand 50–100
Total 1950–3525
General Electric Company using two 61-meter diameter rotor blades from Boeing Aerospace Corporation. It was connected to the local utility grid and operated successfully.
Beginning 1984, the electrical energy derived from the wind and delivered to the paying users is increasing rapidly (Figure 2-3). Until the late 1980s, most wind power plants in the U.S.A. were owned and operated by private investors or cooperatives. In California alone, there was more than 1500 MW of wind generating capacity in operation by the end of 1991. The Southern California Edison Company had over 1,120 MW of wind turbines under contract, with over 900 MW installed and connected to their grid. Major benefits to the Southern California Edison are the elimination of building new generating plant and transmission lines.
The technology development and the resulting price decline have caught the interest of a number of electric utilities outside California that are now actively developing wind energy as one element of the balanced resource
mix.3 Projects are being built in Alaska, California, Minnesota, Texas,
Ver-mont, Washington, and Wyoming. During 1994, several new wind-energy projects started, particularly in the Midwest. A 73-turbine 25 MW plant was completed in Minnesota. Iowa and Wyoming producers and utilities plan to
add significant wind-power capacity in the near future.4 In 1995, a 35 MW
utility-scale wind plant came on-line in Texas, which is expandable to 250 MW capacity, enough to supply 100,000 homes. This plant has a 25-year fixed-price contract to supply Austin City at 5 cents per kWh for generation and 1 cent per kWh for transmission. Nearly 700 MW of additional wind capacity was brought on-line in the U.S.A. by the end of 1996. The current and near-term wind-power capacity plans in the U.S.A. are shown in Figure 2-4.
FIGURE 2-3
About 90 percent of the usable wind resource in the U.S.A. lies in the Great Plains. In Minnesota, Northern States Power Company started installing 100 MW wind-power capacity with a plan to expand to at least 425 MW by 2002. Several contractors working with the National Renewable Energy Lab-oratory are negotiating power purchase agreements with utilities for 4,200 MW of wind capacity at an estimated $2 billion capital investment.
The Energy Information Administration estimates that the U.S. wind capacity will reach 12,000 MW by 2015. Out of this capacity, utilities and wind-power developers have announced plans for more than 4,200 MW of new capacity in 15 states by 2006. The 1.5 cents per kWh federal tax credit that took effect January 1, 1994, is certainly helping the renewables.
State legislators in Minnesota have encouraged the wind power develop-ment by mandating that Northern States Power Company acquire 425 MW of wind generation by 2002. After commissioning a 25 MW wind plant in the Buffalo Ridge Lake Benton area in southwestern Minnesota near Holland, the Northern States Power is now committed to develop up to 100 MW of wind capacity over the next few years in the same area. This area has good steady wind and is accessible to the transmission lines. To support this program, the state has funded the “Wind Smith” education program at junior colleges to properly train the work force with required skills in installing, operating, and repairing the wind power plants.
FIGURE 2-4
2.3 Europe
The wind-power picture in Europe is rapidly growing. The 1995 projections on the expected wind capacity in 2000 have been met in 1997, in approximately one-half of the time. Figure 2-5 depicts the wind capacity installed in the European countries at the end of 1997. The total capacity installed was 4,694 MW. The new targets adopted by the European Wind Energy Association are 40,000 MW capacity by 2010 and 100,000 MW by 2020. These targets form part of a series of policy objectives agreed by the association in November
FIGURE 2-5
1997. Germany and Denmark lead Europe in the wind power. Both have achieved phenomenal growth through guaranteed tariff based on the domes-tic electricity prices. Germany has a 35-fold increase between 1990 and 1996. With 2,079 MW installed capacity, Germany is now the world leader. The former global leader, the U.S.A., has seen only a small increase during this period, from 1,500 MW in 1990 to approximately 2,000 MW in 1997.
2.4 India
India has 9 million square kilometers land area with a population over 900 million, of which 75 percent live in agrarian rural areas. The total power generating capacity has grown from 1,300 MW in 1950 to about 100,000 MW in 1998 at an annual growth rate of about nine percent. At this rate, India needs to add 10,000 MW capacity every year. The electricity network reaches over 500,000 villages and powers 11 million agricultural water-pumping stations. Coal is the primary source of energy. However, coal mines are concentrated in certain areas, and transporting coal to other parts of the country is not easy. One-third of the total electricity is used in the rural areas, where three-fourths of the population lives. The transmission and distribu-tion loss in the electrical network is relatively high at 25 percent. The envi-ronment in a heavily-populated area is more of a concern in India than in other countries. For these reasons, the distributed power system, such as wind plants near the load centers, are of great interest to the state-owned electricity boards. The country has adopted aggressive plans for developing these renewables. As a result, India today has the largest growth rate of the wind capacity and is one of the largest producers of wind energy in the
world.5 In 1995, it had 565 MW of wind capacity, and some 1,800 MW
additional capacity is in various stages of planning. The government has identified 77 sites for economically feasible wind-power generation, with a generating capacity of 4,000 MW of grid-quality power.
It is estimated that India has about 20,000 MW of wind power potential, out of which 1,000 MW has been installed as of 1997. With this, India now ranks in the first five countries in the world in wind-power generation, and provides attractive incentives to local and foreign investors. The Tata Energy Research Institute’s office in Washington, D.C., provides a link between the investors in India and in the U.S.A.
2.5 Mexico
population. However, there are still 90,000 hard-to-access villages with fewer than 1,000 inhabitants without electricity. These villages are being powered by renewable systems with deep cycle lead-acid batteries for energy storage. The wind resource has been thoroughly mapped in collaboration with the
U.S. National Renewable Energy Laboratory.6
2.6 Ongoing Research and Development
The total government research and development funding in the International Energy Agency member countries in 1995 was about $200 million. The U.S. Department of Energy funded about $50 million worth of research and devel-opment in 1995. The goal of these programs is to further reduce the wind electricity-generation cost to less than 4 cents per kWh by the year 2000. The Department of Energy and the U.S. national laboratories also have a number of programs to promote the wind-hybrid power technologies throughout the developing world, with particular emphasis on Latin America and the
Pacific Rim countries.7 These activities include feasibility studies and pilot
projects, project financing and supporting renewable energy education efforts.
References
1. U.S. Department of Energy. 1995. “Wind Energy Programs Overview,” NREL
Report No. DE-95000288, March 1995.
2. International Energy Agency. 1995. “Wind Energy Annual Report,” International
Energy Agency Report by NREL, March 1995.
3. Utility Wind Interest Group. 1995. “Utilities Move Wind Technology Across
America,” 1995 Report. November 1995.
4. Anson, S., Sinclair, K., and Swezey, B. 1994. “Profiles in Renewables Energy,”
Case studies of successful utility-sector projects, DOE/NREL Report No. DE-930000081, National Renewable Energy Laboratory, Golden, Colorado, August 1994.
5. Gupta, A. K. 1997. “Power Generation from Renewables in India,” Ministry of
Non-Conventional Energy Sources, New Delhi, India, 1997.
6. Schwartz, M. N. and Elliott, D. L. 1995. “Mexico’s Wind Resources Assessment
Project,” DOE/NREL Report No. DE-AC36-83CH10093, National Renewable
En-ergy Laboratory, Golden, Colorado, May 1995.
7. Hammons, T. J., Ramakumar, R., Fraser, M., Conners, S. R., Davies, M., Holt, E. A., Ellis, M., Boyers, J., and Markard, J. 1997. “Renewable Energy Technology
Alternatives for Developing Countries,” IEEE Power Engineering Review,
3
Photovoltaic Power
The photovoltaic (pv) power technology uses semiconductor cells (wafers), generally several square centimeters in size. From the solid-state physics point of view, the cell is basically a large area p-n diode with the junction positioned close to the top surface. The cell converts the sunlight into direct current electricity. Numerous cells are assembled in a module to generate required power (Figure 3-1). Unlike the dynamic wind turbine, the pv instal-lation is static, does not need strong tall towers, produces no vibration or noise, and needs no cooling. Because much of the current pv technology uses crystalline semiconductor material similar to integrated circuit chips, the production costs have been high. However, between 1980 and 1996, the capital cost of pv modules per watt of power capacity has declined from more than $20 per watt to less than $5 per watts (Figure 3-2). During the same period, the cost of pv electricity has declined from almost $1 to about $0.20 per kWh, and is expected to decline to $0.15 per kWh by the year 2000 (Figure 3-3). The installed capacity in the U.S. has risen from nearly zero in 1980 to approximately 200 MW in 1996 (Figure 3-4). The world capacity of pv systems was about 350 MW in 1996, which could increase to almost 1,000 MW by the end of this century (Figure 3-5).
The pv cell manufacturing process is energy intensive. Every square cen-timeter cell area consumes a few kWh before it faces the sun and produces the first kWh of energy. However, the manufacturing energy consumption is steadily declining with continuous implementation of new production processes (Figure 3-6).
Major advantages of the photovoltaic power are as follows:
• short lead time to design, install, and start up a new plant. • highly modular, hence, the plant economy is not a strong function
of size.
• power output matches very well with peak load demands. • static structure, no moving parts, hence, no noise.
• high power capability per unit of weight.
• longer life with little maintenance because of no moving parts. • highly mobile and portable because of light weight.
Almost 40 percent of the pv modules installed in the world are produced in the United States of America. Approximately 40 MW modules were pro-duced in the U.S.A. in 1995, out of which 19 MW were propro-duced by Siemens Solar Industries and 9.5 MW by Solarex Corporation.
FIGURE 3-1
3.1 Present Status
At present, pv power is extensively used in stand-alone power systems in remote villages, particularly in hybrid with diesel power generators. It is expected that this application will continue to find expanding markets in many countries. The driving force is the energy need in developing countries, and the environmental concern in developed countries. In the United States, city planners are recognizing the favorable overall economics of the pv power for urban applications. Tens of thousands of private, federal, state and commercial pv systems have been installed over the last 20 years. More than 65 cities in 24 states have installed such systems for a variety of needed services. These cities, shown in Figure 3-7, are located in all regions of the country, dispensing the myth that pv systems require a sunbelt climate to work effectively and efficiently.
The U.S. utilities have started programs to develop power plants using the newly available low-cost pv modules. Idaho Power has a pilot program to supply power to selected customers not yet connected to the grid. Other
FIGURE 3-2
FIGURE 3-3
Photovoltaic energy price trend.
FIGURE 3-4
utilities such as Southern California Edison, the municipal utility of Austin, Delmarva Power and Light, and New York Power Authority are installing such systems to meet peak demands. The Pacific Gas and Electric’s utility-scale 500 kW plant at Kerman is designed to deliver power during the local peak demand. It generates 1.1 MWh of energy annually.
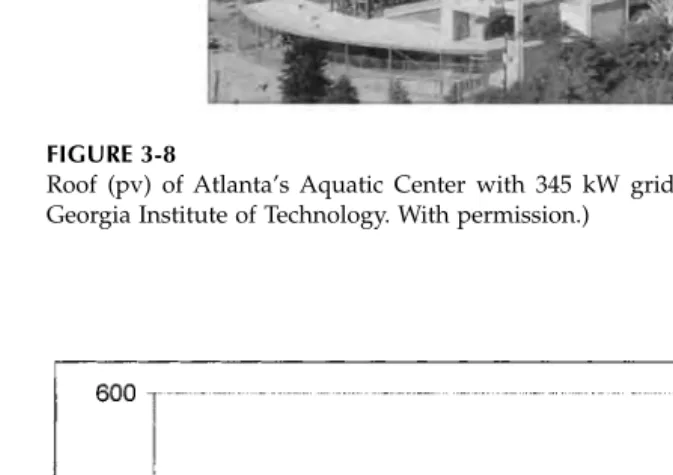
The roof of the Aquatic Center in Atlanta (Figure 3-8), venue of the 1996 Olympic swimming competition, is one of the largest grid-connected power plants. It generates 345 kW of electric power, and is tied into the Georgia Power grid lines. Its capacity is enough to power 70 homes connected to the network. It saves 330 tons of CO2, 3.3 tons of SO2 and 1.2 tons of NOx yearly.
Installations are under way to install a similar 500 kW grid-connected pv system to power the Olympics Games of 2000 in Sydney, Australia.
In 14 member countries of the International Energy Agency, the pv installa-tions are being added at an average annual growth rate of 27 percent. The total installed capacity increased from 54 MW in 1990 to 176 MW in 1995. The IEA estimates that by the end of 2000, 550 MW of additional capacity will be installed, 64 percent off-grid and 36 percent grid-connected (Figure 3-9).
India is implementing perhaps the most number of pv systems in the world for remote villages. About 30 MW capacity has already been installed, with more being added every year. The country has a total production capacity of 8.5 MW modules per year. The remaining need is met by imports. A
FIGURE 3-5
FIGURE 3-6
Energy consumption per cm2 of pv cell manufactured. (Source: U.S. Department of Commerce and Dataquest, Inc.)
FIGURE 3-7
FIGURE 3-8
Roof (pv) of Atlanta’s Aquatic Center with 345 kW grid-connected power system. (Source: Georgia Institute of Technology. With permission.)
FIGURE 3-9
700 kW grid-connected pv plant has been commissioned, and a 425 kW capacity is under installation in Madhya Pradesh. The state of West Bengal has decided to convert the Sagar Island into a pv island. The island has 150,000 inhabitants in 16 villages spread out in an area of about 300 square kilometers. The main source of electricity at present is diesel, which is expen-sive and is causing severe environmental problems on the island.
The state of Rajasthan has initialed a policy to purchase pv electricity at an attractive rate of $0.08 per kWh. In response, a consortium of Enron and Amoco has proposed installing a 50 MW plant using thin film cells. When completed, this will be the largest pv power plant in the world.
The studies at the Arid Zone Research Institute, Jodhpur, indicate signifi-cant solar energy reaching the earth surface in India. About 30 percent of the electrical energy used in India is for agricultural needs. Since the avail-ability of solar power for agricultural need is not time critical (within a few days), India is expected to lead the world in pv installations in near future.
3.2 Building Integrated pv Systems
In new markets, the near-term potentially large application of the pv tech-nology is for cladding buildings to power air-conditioning and lighting loads. One of the attractive features of the pv system is that its power output matches very well with the peak load demand. It produces more power on a sunny summer day when the air-conditioning load strains the grid lines (Figure 3-10). The use of pv installations in buildings has risen from a mere 3 MW in 1984 to 16 MW in 1994, at a rate of 18 percent per year.
In the mid 1990s, the DOE launched a 5-year cost-sharing program with Solarex Corporation of Maryland to develop and manufacture low cost, easy to install, pre-engineered Building Integrated Photovoltaic (BIPV) modules. Such modules made in shingles and panels can replace traditional roofs and walls. The building owners have to pay only the incremental cost of these components. The land is paid for, the support structure is already in there, the building is already wired, and developers may finance the BIPV as part of their overall project. The major advantage of the BIPV system is that it produces power at the point of consumption. The BIPV, therefore, offers the first potentially widespread commercial implementation of the pv technol-ogy in the industrialized countries. The existing programs in the U.S.A., Europe, and Japan could add 200 MW of BIPV installations by the year 2010. Worldwide, the Netherlands plans to install 250 MW by 2010, and Japan has plans to add 185 MW between 1993 and 2000.
Figure 3-11 shows a building-integrated and grid-connected pv power sys-tem recently installed and operating in Germany.
U.S.A. by the year 2010. This “Million Solar Roof Initiative” is expected to increase the momentum for more widespread use of solar power, lowering the cost of photovoltaic technologies.
FIGURE 3-10
Power usage in commercial building on a typical summer day.
FIGURE 3-11
3.3 pv Cell Technologies
In making comparisons between alternative power technologies, the most important measure is the energy cost per kWh delivered. In pv power, this cost primarily depends on two parameters, the photovoltaic energy conver-sion efficiency, and the capital cost per watt capacity. Together, these two parameters indicate the economic competitiveness of the pv electricity.
The conversion efficiency of the photovoltaic cell is defined as follows:
The continuing development efforts to produce more efficient low cost cells have resulted in various types of pv technologies available in the market today, in terms of the conversion efficiency and the module cost. The major
types are discussed in the following sections:1
3.3.1 Single-Crystalline Silicon
The single crystal silicon is the widely available cell material, and has been the workhorse of the industry. In the most common method of producing this material, the silicon raw material is first melted and purified in a crucible. A seed crystal is then placed in the liquid silicon and drawn at a slow constant rate. This results in a solid, single-crystal cylindrical ingot (Figure 3-12). The manufacturing process is slow and energy intensive, resulting in high raw material cost presently at $25 to $30 per pound. The ingot is sliced using a diamond saw into 200 to 400 µm (0.005 to 0.010 inch) thick wafers. The wafers are further cut into rectangular cells to maximize the number of cells that can be mounted together on a rectangular panel. Unfortunately, almost half of the expensive silicon ingot is wasted in slicing ingot and forming square cells. The material waste can be minimized by making the full size round cells from round ingots (Figure 3-13). Using such cells would be economical where the panel space is not at a premium. Another way to minimize the waste is to grow crystals on ribbons. Some U.S. companies have set up plants to draw pv ribbons, which are then cut by laser to reduce waste.
3.3.2 Polycrystalline and Semicrystalline
This is relatively a fast and low cost process to manufacture thick crystalline cells. Instead of drawing single crystals using seeds, the molten silicon is cast into ingots. In the process, it forms multiple crystals. The conversion efficiency is lower, but the cost is much lower, giving a net reduction in cost per watt of power.
η = electrical power output
3.3.3 Thin Films
These are new types of photovoltaics entering the market. Copper Indium Diselenide, Cadmium Telluride, and Gallium Arsenide are all thin film mate-rials, typically a few µm or less in thickness, directly deposited on glass, stainless steel, ceramic or other compatible substrate materials. This technol-ogy uses much less material per square area of the cell, hence, is less expen-sive per watt of power generated.
3.3.4 Amorphous Silicon
In this technology, amorphous silicon vapor is deposited on a couple of µm-thick amorphous (glassy) films on stainless steel rolls, typically 2,000-feet long and 13-inches wide. Compared to the crystalline silicon, this technology uses only 1 percent of the material. Its efficiency is about one-half of the crystalline silicon at present, but the cost per watt generated is projected to
FIGURE 3-12
be significantly lower. On this premise, two large plants to manufacture amorphous silicon panels started in the U.S.A. in 1996.
3.3.5 Spheral
This is yet another technology that is being explored in the laboratories. The raw material is low-grade silicon crystalline beads, presently costing about $1 per pound. The beads are applied on typically 4-inch squares of thin perforated aluminum foil. In the process, the impurities are pushed to the surface, from where they are etched away. Since each sphere works indepen-dently, the individual sphere failure has negligible impact on the average performance of the bulk surface. According to a Southern California Edison Company’s estimate, 100 square feet of spheral panels can generate 2,000 kWh per year in an average southern California climate.
FIGURE 3-13
3.3.6 Concentrated Cells
In an attempt to improve the conversion efficiency, the sunlight is concen-trated into tens or hundreds of times the normal sun intensity by focusing on a small area using low cost lenses (Figure 3-14). The primary advantage is that such cells require a small fraction of area compared to the standard cells, thus significantly reducing the pv material requirement. However, the total module area remains the same to collect the required sun power. Besides increasing the power and reducing the size or number of cells, such cells have additional advantage that the cell efficiency increases under concen-trated light up to a point. Another advantage is that they can use small area cells. It is easier to produce high efficiency cells of small areas than to produce large area cells with comparable efficiency. On the other hand, the major disadvantage of the concentrator cells is that they require focusing optics adding into the cost.
The annual production of various pv cells in 1995 is shown in Table 3-1. Almost all production has been in the crystalline silicon and the amorphous silicon cells, with other types being in the development stage. The present status of the crystalline silicon and the amorphous silicon technologies is shown in Table 3-2. The former is dominant in the market at present and the latter is expected to be dominant in the near future.
FIGURE 3-14
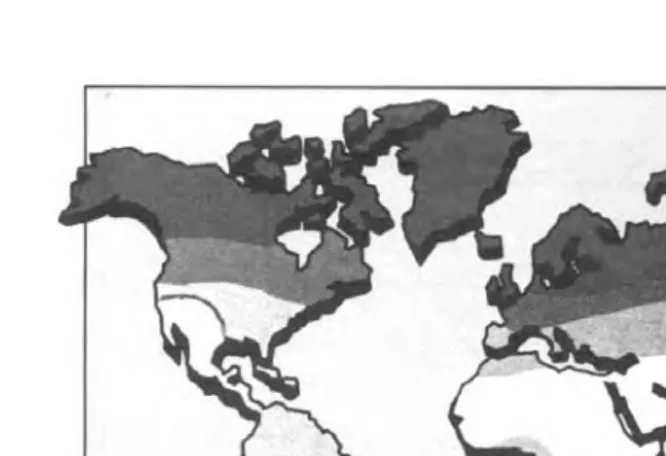
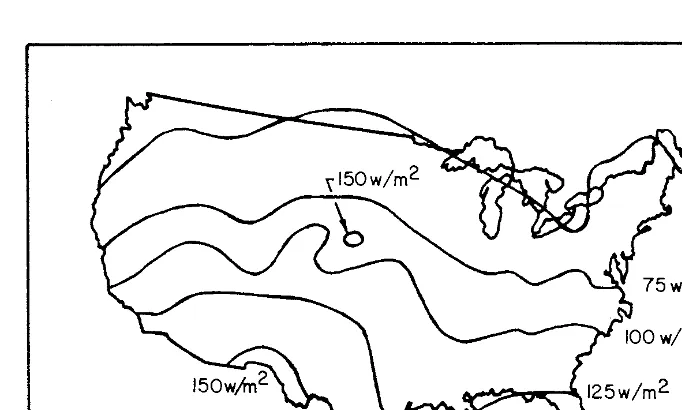
3.4 pv Energy Maps
The solar energy impinging the surface of the earth is depicted in Figure 3-15, where the white areas get more solar radiation per year. The yearly 24-hour average solar flux reaching the horizontal surface of the earth is shown in Figure 3-16, whereas Figure 3-17 depicts that in the month of December. Notice that the 24-hour average decreases in December. This is due to the shorter days and clouds, and not due to the cold temperature. As will be seen later, the pv cell actually converts more solar energy into electricity at low temperatures.
It is the total yearly energy capture potential of the site that determines the economical viability of installing a power plant. Figure 3-18 is useful in this regard, as it gives the annual average solar energy per day impinging on the surface always facing the sun at right angle. Modules mounted on a sun-tracking structure receive this energy. The electric energy produced per day is obtained by multiplying the map number by the photoconversion efficiency of the modules installed at the site.
TABLE 3-1
Production Capacities of Various pv Technologies in 1995
PV Technology 1995 Production
Crystalline Silicon 55 MW
Amorphous Silicon 9 MW
Ribbon Si, GaAs, CdTe 1 MW
TOTAL 65 MW
(Source: Carlson, D. E., Recent Advances in Photovoltaics, 1995. Proceedings of the Intersociety Engineering Confer-ence on Energy Conversion, 1995.)
TABLE 3-2
Comparison of Crystalline and Amorphous Silicon Technologies
Crystalline Silicon Amorphous Silicon
Present Status Workhorse of terrestrial and space applications
New rapidly developing technology, tens of MW yearly production facilities have been built in 1996 to produce low cost cells Thickness 200-400 µm (.004-.008 inch) 2 µm (less then 1 percent of that in crystalline
silicon)
Raw Material Cost High About 3 percent of that in crystalline silicon Conversion
Efficiency
16-18 percent 8-9 percent
Module Costs (1995)
$6–8 per watt, expected to fall slowly due to the matured nature of this technology
FIGURE 3-15
[image:47.666.56.389.71.299.2]Solar radiation by regions of the world (higher energy potential in the white areas).
FIGURE 3-16
FIGURE 3-17
December 24-hour average solar radiation in watts/m2 reaching the horizontal surface of the earth. (Source: Profiles in Renewable Energy, DOE/NREL Report No. DE-930000081, August 1994.)
FIGURE 3-18
[image:48.666.55.390.346.568.2]References
1. Carlson, D. E. 1995. “Recent Advances in Photovoltaics,” 1995 Proceedings of
4
Wind Speed and Energy Distributions
The wind turbine captures the wind’s kinetic energy in a rotor consisting of two or more blades mechanically coupled to an electrical generator. The turbine is mounted on a tall tower to enhance the energy capture. Numerous wind turbines are installed at one site to build a wind farm of the desired power production capacity. Obviously, sites with steady high wind produce more energy over the year.
Two distinctly different configurations are available for the turbine design, the horizontal axis configuration (Figure 4-1) and the vertical axis configura-tion (Figure 4-2). The vertical axis machine has the shape of an egg beater, and is often called the Darrieus rotor after its inventor. It has been used in the past because of specific structural advantage. However, most modern wind turbines use horizontal-axis design. Except for the rotor, all other com-ponents are the same in both designs, with some difference in their placement.
4.1 Speed and Power Relations
The kinetic energy in air of mass “m” moving with speed V is given by the following in SI units:
(4-1)
The power in moving air is the flow rate of kinetic energy per second. Therefore:
(4-2)
If we let P = mechanical power in the moving air
ρ = air density, kg/m3
A = area swept by the rotor blades, m2
V = velocity of the air, m/s
Kinetic Energy= ⋅ ⋅1 m V
2
2
joules.
Power= ⋅1
(
mass flow rate per)
⋅V2
FIGURE 4-1
Horizontal axis wind turbine showing major components. (Courtesy: Energy Technology Sup-port Unit, DTI, U.K.. With permission.)
FIGURE 4-2
[image:51.666.132.304.372.585.2]then, the volumetric flow rate is A·V, the mass flow rate of the air in kilograms
per second is ρ·A·V, and the power is given by the following:
(4-3)
Two potential wind sites are compared in terms of the specific wind power expressed in watts per square meter of area swept by the rotating blades. It is also referred to as the power density of the site, and is given by the following expression:
(4-4)
This is the power in the upstream wind. It varies linearly with the density of the air sweeping the blades, and with the cube of the wind speed. All of the upstream wind power cannot be extracted by the blades, as some power is left in the downstream air which continues to move with reduced speed.
4.2 Power Extracted from the Wind
The actual power extracted by the rotor blades is the difference between the upstream and the downstream wind powers. That is, using Equation 4-2:
(4-5)
where Po = mechanical power extracted by the rotor, i.e., the turbine output
power
V = upstream wind velocity at the entrance of the rotor blades
Vo= downstream wind velocity at the exit of the rotor blades.
The air velocity is discontinuous from V to Vo at the “plane” of the rotor
blades in the macroscopic sense (we leave the aerodynamics of the blades for many excellent books available on the subjects). The mass flow rate of air through the rotating blades is, therefore, derived by multiplying the density with the average velocity. That is:
(4-6)
P= 1
(
AV)
⋅V = AV watts2
1 2
2 3
ρ ρ .
Specific Power of the site= 1 ⋅ watts per m of the rotor swept area.2
2
3
ρ V
Po= 1 ⋅
{
V −Vo}
2
2 2
mass flow rate per second
mass flow rate= ⋅ρ A⋅V V+ o
The mechanical power extracted by the rotor, which is driving the electrical generator, is therefore:
(4-7)
The above expression can be algebraically rearranged:
(4-8)
The power extracted by the blades is customarily expressed as a fraction of the upstream wind power as follows:
(4-9)
where (4-10)
The Cpis the fraction of the upstream wind power, which is captured by
the rotor blades. The remaining power is discharged or wasted in the
down-stream wind. The factor Cpis called the power coefficient of the rotor or the
rotor efficiency.
For a given upstream wind speed, the value of Cpdepends on the ratio of
the down stream to the upstream wind speeds, that is (Vo/V). The plot of
power coefficient versus (Vo/V) shows that Cp is a single, maximum-value
function (Figure 4-3). It has the maximum value of 0.59 when the (Vo/V) is
one-third. The maximum power is extracted from the wind at that speed ratio, when the downstream wind speed equals one-third of the upstream speed. Under this condition:
(4-11)
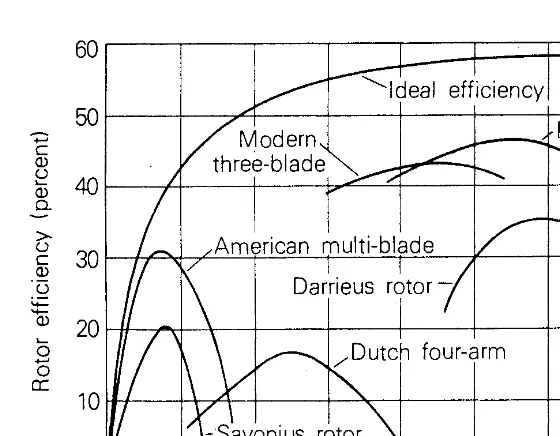
The theoretical maximum value of Cpis 0.59. In practical designs, the
max-imum achievable Cp is below 0.5 for high-speed, two-blade turbines, and
between 0.2 and 0.4 for slow speed turbines with more blades (Figure 4-4). If we take 0.5 as the practical maximum rotor efficiency, the maximum power output of the wind turbine becomes a simple expression:
Po= ⋅ ⋅A
(
V V+ o)
V Vo ⋅
(
−)
1 2 2 2 2 ρP A V
V V V V o o o = ⋅ ⋅ + − 1 2 1 1 2 3 2 ρ
Po= 1 ⋅ ⋅A V ⋅Cp
2 3 ρ C V V V V p o o = + − 1 1 2 2
Pmax= 1 ⋅ ⋅A V ⋅ .
2 0 59
3
(4-12)
4.3 Rotor Swept Area
As seen in the power equation, the output power of the wind turbine varies linearly with the rotor swept area. For the horizontal axis turbine, the rotor swept area is given by:
(4-13)
For the Darrieus vertical axis machine, determination of the sweptarea is
complex, as it involves elliptical integrals. However, approximating the blade shape as a parabola leads to the following simple expression for the swept area:
[image:54.666.56.396.76.314.2](4-14)
FIGURE 4-3
Rotor efficiency versus Vo/V ratio has single maximum. Rotor efficiency is the fraction of available wind power extracted by the rotor and fed to the electrical generator.
Pmax= ⋅ ⋅V
1 4
3
ρ watts per m of swept area.2
A= πD
4
2
where D is the rotor diameter.
A= ⋅2
(
)
⋅(
)
The wind turbine efficiently intercepts the wind energy flowing through the entire swept area even though it has only two or three thin blades with solidity between 5 to 10 percent. The solidity is defined as the ratio of the solid area to the swept area of the blades. The modern 2-blade turbine has low solidity ratio. Hence, it requires little blade material to sweep large areas.
4.4 Air Density
The wind power varies linearly with the air density sweeping the blades.
The air density ρ varies with pressure and temperature in accordance with
the gas law:
(4-15)
where p = air pressure
T = temperature on the absolute scale R = gas constant.
[image:55.666.82.362.70.288.2]The air density at sea level, one atmospheric pressure (14.7 psi) and 60°F is 1.225 kg/m3. Using this as the reference, ρ is corrected for the site specific
FIGURE 4-4
Rotor efficiency versus tip speed ratio for rotors with different numbers of blades. Two-blade rotors have the highest efficiency. (Source: Eldridge, F.R., Wind Machines, Energy Research and Development Administration, Washington, DC, Report AER-75-12937, p. 55, 1975.)
ρ = ⋅