Relevance Prediction in Information Extraction
using Discourse and Lexical Features
Silja Huttunen, Arto Vihavainen, Peter von Etter, Roman Yangarber Department of Computer Science
University of Helsinki, Finland
Abstract
We present on-going work on estimating the relevance of the results of an Informa-tion ExtracInforma-tion (IE) system. Our aim is to build a user-oriented measure of utility of the extracted factual information. We de-scribe experiments using discourse-level features, with classifiers that learn from users’ ratings of relevance of the results. Traditional criteria for evaluating the per-formance of IE focus on correctness of the extracted information, e.g., in terms of re-call, precision and F-measure. We intro-duce subjective criteria for evaluating the quality of the extracted information: util-ity of results to the end-user.
To measure utility, we use methods from text mining and linguistic analysis to iden-tify features that are good predictors of the relevance of an event or a document to a user. We report on experiments in two real-world news domains: business activ-ity and epidemics of infectious disease. 1 Introduction
In this paper we present on-going work aimed at finding user-oriented relevance measures for in-formation extracted from plain-text news articles. Measure for relevance has been created in collab-oration with actual end users of our system. End users view and rate the utility of extracted events using our online news surveillance service.
We aim to show that by utilizing domain-specific and domain-independent sets of features we can build and train a system that is able to predict the utility of new information obtained by an Information Extraction system. We apply the
methods on two domains in order to demonstrate that the approach is, in principle, domain indepen-dent, and easily adapted to different domains.
Our target domains are business news, with the focus on analyzing reports about corporate acqui-sitions and new product launches, and medical news, with the focus on outbreaks and spread of infectious diseases. These topics are actively re-searched in the IE community, e.g. (Grishman et al., 2003; Freifeld et al., 2008; Cvitas, 2010; Sag-gion et al., 2007).
The news extraction and relevance prediction works in three phases. The first phase identifies articles potentially relevant to a target domain us-ing a broad keyword-based Web search – this is done continuously. The second phase employs IE to extract events from acquired articles, and the final phase then determines the relevance of the extracted events or articles for the end-user.
In the next section, we briefly present the cri-teria for judging qualityof extracted events, and present the approach taken in our system. Sec-tion 3 introduces the features we use for predicting utility. Section 4 discusses our experimental setup and gives a short system description of the rele-vance generation process. Section 5 presents our current experiments and results with automatic as-signment of relevance scores. In the final section we discuss the results and outline next steps. 2 Quality measures
In IE research, performance has been traditionally measured in terms ofcorrectness, counting how many of the fields in each record were correctly extracted by comparing the system’s answers to a set of answers pre-defined by human annotators. In the MUC and ACE initiatives, e.g., this was computed mainly in terms of recall and precision, and F-measure, (Hirschman, 1998; ACE, 2004).
We would like to distinguishobjectivevs. sub-jective measures of quality. Objective measures take the perspective of the system in evaluating the obtained IE results in terms of correctness and confidence. Confidence has been studied to es-timate the probability of the correctness of the system’s answer, in e.g. (Culotta and McCal-lum, 2004). Our IE system, PULS, computes con-fidence using discourse-level cues, (Steinberger et al., 2008), such as: confidence decreases as the distance between the sentence containing the event and event attributes increases; confidence in-creases if a document mentions only one country.
Subjective measures reflect the end users’ per-spective, that is the relevance (or utility) of the ex-tracted information, and the reliability1of the in-formation found (von Etter et al., 2010) .
Utility measures howusefulthe result is to the userirrespectiveof its correctness. An event may be correctly extracted, and yet be of low utility to the user.2 Conversely, an event may have many incorrectly extracted attributes, and yet be of great valueand interest to the user.
We focus specifically on relevance vs. correct-ness. The relevance ratings currently used in our 1Reliabilitymeasures whether the reported event is “true”, or trustworthy. We include this criterion for completeness, since it is the ultimate goal of any news surveillance process. However, this requires pragmatic knowledge, including in-formation that is obtainable by the user only through down-stream verification, and is thus beyond the scope of this paper. 2Historical or hypothetical events, e.g., may not be useful for an analyst concerned with the current state of affairs.
work are listed in Table 1. Our goal is, specifi-cally to devise methods for automatic assignment of relevance scores to extracted events, and to the documents in which they are found.
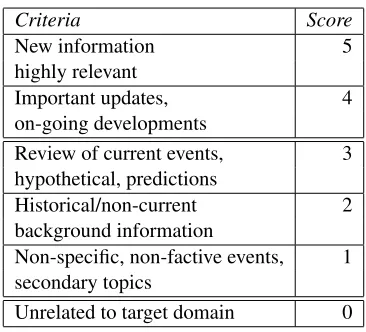
Criteria Score
New information 5
highly relevant
Important updates, 4
on-going developments
Review of current events, 3 hypothetical, predictions
Historical/non-current 2
background information
Non-specific, non-factive events, 1 secondary topics
[image:2.612.326.509.117.283.2]Unrelated to target domain 0
Table 1: Guidelines for relevance scores
The users assign the scores as presented in the Likert-like scale, Table 1. In the work and ex-periments reported in this paper, these scores are reduced for simplicity, into either a three-way classification—high (4–5), low (1–3) and irrele-vant (0), or a binary classification— where events with high relevance are those with a score of 4–5, and low-relevance events have a score of 0–3. The binary classification is useful because one imme-diate purpose of introducing the relevance score is for the system to determine whether to present the extracted event to the end user on the main page of the site—which is a binary decision.
3 Linguistic Features
In this section we describe the features that we use in our system for predicting the relevance of an event. These features were devised through a de-tailed analysis of the domains and user-evaluated events, and were chosen based on their potential for relevance prediction.
eight confirmed cases of measles, after an out-break at Royal Perth Hospital.” a pattern is trig-gered by the phrase “cases ofdisease”. The at-tributes of the event correspond to the fills in the database record, in this example, the name of the disease, the location, date, the number of cases, etc. Several events may appear in a news article.
We distinguish discourse features and lexical features. Discourse features are based on proper-ties of the article text and of the events extracted from it. Lexical features are simpler low-level fea-tures based on bags of words, discussed in sec-tion 3.2. In essence, lexical features capture lo-cal information, while discourse features capture longer-range relationships within the document. 3.1 Discourse Features
Discourse features include information about the number of events, positioning of the event in the document, the compactness of the placement of the event’s attributes (Bagga and Biermann, 1997; Huttunen et al., 2002), and the recency of event occurrence.
3.1.1 Layout and positioning
We introduce a set of features describing the posi-tion of the trigger sentence within the document. These help to quantify the assumption that impor-tant details of news topics are placed in the be-ginning of an article whereas less important de-tails are stated later.4 Layout features include the length of the document and the position of the trig-ger sentence in the document.
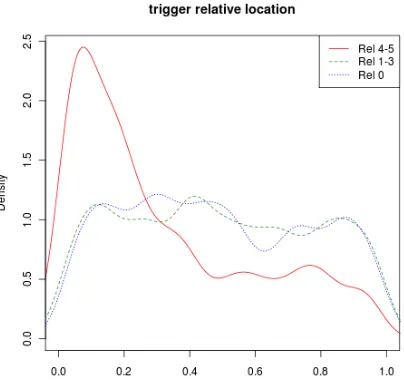
Figure 1 shows the distribution of the relative location of the event in the text, given that the event has a high relevance score (4-5), low rele-vance (1-3), or is completely irrelevant (score 0).
Figure 2 shows that high-relevance events favor the placement of the trigger sentence in the docu-mentheader, i.e., in the headline or the first two sentences of the news article.
3.1.2 Event compactness
In a compact event, all the event attributes are sit-uated close to the trigger in the text. The com-pactness features track the distance of mentions of event attributes from the event trigger. We model the effect of compactness on relevance of an event by, e.g., measuring the distance between the trigger and the disease name (for epidemics do-main) or a company name (for business dodo-main). 4The so-called “Inverted Pyramid” principle, (Bell, 1991)
Figure 1: Distributions of relative trigger po-sition in medical domain, given relevance class (high/low/zero)
The distance is measured as the number of bytes, words, or sentences. The “active” participating at-tributes of an event are here calledactors.
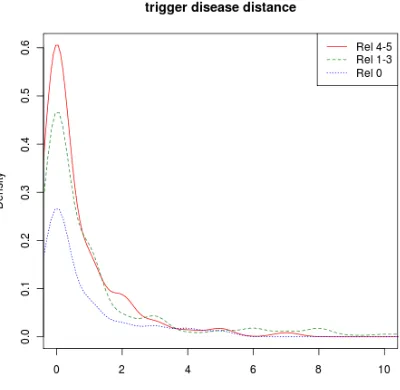
Figure 3 shows the distribution of the distance in sentences (horizontal axis) between disease name and trigger (or absence of disease name in document) given high, low and zero relevance. The name of a disease is more likely to occur in a trigger sentence of a high-relevance event than in the trigger sentence of low-relevance event. For events that contain no actor at all, the feature re-ceives a special valueNA.
Content-repetition features test whether an im-portant fill, such as an actor, is repeated in the document (likely affecting relevance positively). Conversely, features that count the numberdistinct actors mentioned in text may be good indicators of lower relevance—such as an article mentioning many different diseases or companies is less likely to be of high relevance.
3.1.3 Time and recency
[image:3.612.319.521.69.263.2]rel-Figure 2: Probability that the trigger of the current event is in the header for medical domain, given the different relevance scores.
evant articles, usually describe more recent events. Recency is a good indicator for relevance, as can be seen in Figure 4.
3.1.4 Indicators of irrelevant domains For each domain, we devise a set ofblacklist fea-turesthat signal low relevance in respect to a given domain. Negative indicators for epidemic surveil-lance, may be, e.g., “vaccination campaign” and “obituary”. The latter is a common source of false positives when the deceased suffered from ill-nesses during his/her lifetime, and the IE patterns fail to distinguish those from epidemics cases, on localcues alone.
In the business domain, an indicator of low rel-evance is, e.g., “President”, possibly followed by a proper name, and a country. This mostly refers to a head of state, rather than head of a company.
The PULS system extracts “negative events”, (called hereharm events), as well, to catch events that frequently interfere with events of inter-est. For example, in the business domain, satel-lite/rocket launches may trigger patterns for find-ing product launches, since they are syntactically similar; natural disasters (flooding, earthquake, etc.) with casualties often interfere with patterns in for medical domain. The number of found harm events in a document is a discourse feature.
[image:4.612.320.520.70.265.2]A missing attribute may also be an indication
Figure 3: Distribution of distance from trigger to name of the disease. Instances with no disease, or with distance> 10 are mapped to the point
dis-tance= 20(not shown in the figure).
of an irrelevant event. Events rejected or marked irrelevant by the user are more likely to be miss-ing the name of a disease. The system also extracts victim names where possible, since obituaries, sto-ries about public figures, and other items irrele-vant from the epidemiological perspective, tend to name the victims.5
The number of unique actors preceding the trig-ger sentences is potentially correlated with irrel-evance.6 For example, if no disease names exist before the trigger sentence, then the document is likely to be irrelevant. On the other hand, impor-tant news events often mention only a single dis-ease or company. The discourse features used in the experiments are listed in Table 2.
3.2 Lexical Features
Lexical features for an event consists of bags of words in the trigger sentence, and in the sentences immediately preceding and following the trigger sentence. The surrounding sentences provide ad-ditional context for disambiguation. For example, 5On the other hand, some news articles about genuine epi-demic outbreaks may name the victims as well—to personal-ize them for the reader. All these features only capture ten-dencies and probabilities, and are not deterministic.
[image:4.612.94.293.71.272.2]Figure 4: Distribution of the difference days from publication to event date in medical domain. Neg-ative values indicate events in the future.
the trigger sentence may include deaths and in-juries, but in principle the article could be about any kind of casualties.
3.3 Domain specificity
Some features are applicable directly to different domains. An example of such features are the re-cency features, which compare the event date to the publication date of the document. Other fea-tures are domain-specific, and make use of the domain-specific attributes. For example, we may check the position of an actor attribute, and see whether it appears in the headline. In the medi-cal domain, such an attribute would be the disease name, in the business domain, we use the company name in an analogous fashion.
4 Experimental Setup and System Description
Next, we briefly describe how the relevance clas-sifiers are built. We have an online news surveil-lance system that allows users to review, rate and correct events extracted from news articles. The work-flow for finding relevant events is as follows: The system’s information retrieval (IR) compo-nent continuously polls news sites, (Yangarber et al., 2007). News filtering is done using Boolean keyword-based queries. The result is a continuous
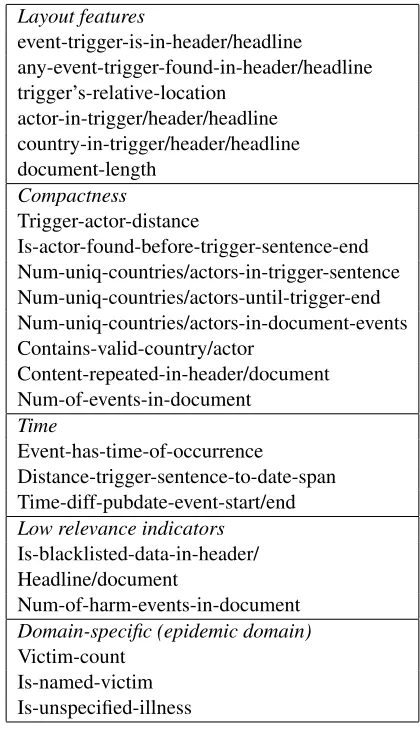
Layout features
event-trigger-is-in-header/headline
any-event-trigger-found-in-header/headline trigger’s-relative-location
actor-in-trigger/header/headline country-in-trigger/header/headline document-length
Compactness
Trigger-actor-distance
Is-actor-found-before-trigger-sentence-end Num-uniq-countries/actors-in-trigger-sentence Num-uniq-countries/actors-until-trigger-end Num-uniq-countries/actors-in-document-events Contains-valid-country/actor
Content-repeated-in-header/document Num-of-events-in-document
Time
Event-has-time-of-occurrence
Distance-trigger-sentence-to-date-span Time-diff-pubdate-event-start/end Low relevance indicators
Is-blacklisted-data-in-header/ Headline/document
Num-of-harm-events-in-document Domain-specific (epidemic domain) Victim-count
Is-named-victim Is-unspecified-illness
Table 2: Examples of discourse features
stream of potentially relevant documents, that is forwarded to the information extraction system.
Our IE system then extracts events of potential relevance from this stream of articles. The ex-tracted information, i.e., the structured events with their attributes, is stored into a database. The IE component uses a large set of linguistic patterns, which in turn utilize general and domain-specific concepts, such as diseases, locations and organi-zations.
Once the attributes of an event have been ex-tracted, the relevance classifier is invoked. Each event is converted to a feature vector, to which a classifier assigns a relevance score.
After the event receives a relevance score, it ap-pears on the on-line server. Relevance predictions are highlighted with different colors, which en-hances the user experience and allows easy noti-fication of high relevance events.
[image:5.612.95.300.78.263.2]sim-ple editing facility for the extracted events. In case of errors in the automatic extraction, the UI allows the user to correct erroneous fills, e.g., if a com-pany name, country, or a disease name was ex-tracted incorrectly. In addition to editing the event fills, the users can also assign or edit the relevance labels to the extracted events. The set of events that have been corrected and/or relevance-labeled manually by human users are used for training and testing the relevance classifiers.
In the business domain, we use a set of hand-labeled data, in which currently roughly 45% of the events are high-relevance, and 55% are low-relevance. In the medical domain, about 80% of examples are labeled with lower relevance. We experimented with building balanced and unbal-anced classifiers for the medical domain; we took a sample from the complete labeled set, so that the class distribution in the sample is about even—i.e., the randomly sampled training subset is balanced so it contains about the same amount of low- and high-relevance events.
Since parts of the labeled data are actually cor-rected by the user, we obtaintwoparallel sets of events with relevance labels: the “raw” events, as extracted by the system, and corresponding “cleaned” events, i.e., the same events with correc-tions. The raw set is more noisy, since it contains the errors that were introduced by the system.
The relevance classifiers are built using the cleaned labeled data. For evaluation, we test the classifier performance against both the cleaned and the raw events. We focus on classification performance on the raw events, because ultimately the goal is to build a classifier that can be applied to the extracted event stream, which are not vali-dated or corrected by the end-user. In any case, the IE system must assign the relevance score to each event, before a user examines it, and possibly vali-dates it. Therefore, the “raw” scores in the evalua-tion give us an indicaevalua-tion of what performance we can expect in the real-world setting.7
5 Evaluation Methodology and Results The predictive power of our features is evalu-ated by using three different classifiers: Naive Bayes (John and Langley, 1995), SVM (Platt, 1999) and BayesNet (Bouckaert, 2004). We used
7Note that, on the other hand, it makes less sense to train the classifier on raw data, since it is inherently more noisy, degrades the classifier performance.
the implementations from the WEKA toolkit (Hall et al., 2009), which provides a collection of ma-chine learning algorithms.
Evaluations are done using a 10-fold cross-validation. We evaluated the results using preci-sion, recall, F-measure and accuracy for high/low-relevance classification. It is important to note that when we split the corpus into 10 parts, we make sure that for any given document,allevents found in that document fall within the same split—to as-sure that a document never contributes events to both the training and the testing set.
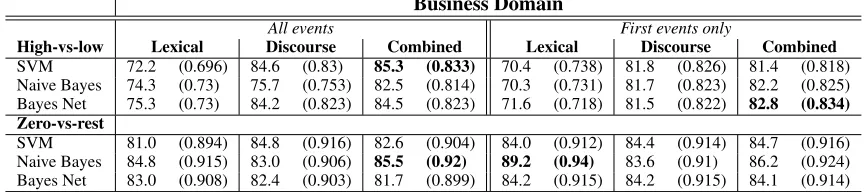
5.1 Business domain
In the business domain, we use about 213 user-labeled events, in 127 documents. Table 3 shows classification performance achieved on discourse, lexical and combined features. Discourse feature construction is as described in section 3. We cur-rently utilize roughly 40 discourse-level features.
In the table, we report the system’s performance on all events in our labeled corpus, as well as only on events that appear first within a docu-ment (which may contain more than one event). The first-event evaluation is interesting since we can view it as an additional document-level text-filteringtask, where the relevance of the first event is used to define the relevance of the entire docu-ment.
We train two types of binary classifiers: the high-vs-low classifiers separate between events la-beled 4–5 and 0–3. The zero-vs-rest classifiers separate the zero-relevance (i.e., completely use-less) events from the rest. In each case, the F-measure is calculated for predicting the higher-relevance class.
For each classifier, we show the performance using discourse features only, lexical features only, and the combined set of features. The classifiers are trained with feature selection using informa-tion gain. In the table, the bold score indicates the best score achieved for the given column.
5.2 Medical domain
Business Domain
All events First events only
High-vs-low Lexical Discourse Combined Lexical Discourse Combined
SVM 72.2 (0.696) 84.6 (0.83) 85.3 (0.833) 70.4 (0.738) 81.8 (0.826) 81.4 (0.818)
Naive Bayes 74.3 (0.73) 75.7 (0.753) 82.5 (0.814) 70.3 (0.731) 81.7 (0.823) 82.2 (0.825) Bayes Net 75.3 (0.73) 84.2 (0.823) 84.5 (0.823) 71.6 (0.718) 81.5 (0.822) 82.8 (0.834) Zero-vs-rest
SVM 81.0 (0.894) 84.8 (0.916) 82.6 (0.904) 84.0 (0.912) 84.4 (0.914) 84.7 (0.916)
Naive Bayes 84.8 (0.915) 83.0 (0.906) 85.5 (0.92) 89.2 (0.94) 83.6 (0.91) 86.2 (0.924) Bayes Net 83.0 (0.908) 82.4 (0.903) 81.7 (0.899) 84.2 (0.915) 84.2 (0.915) 84.1 (0.914)
Table 3: Relevance classification results on business domain: accuracy and F-measure (in parentheses) for discourse features, lexical features, and combined features.
Medical Domain
All events First events only
High-vs-low Lexical Discourse Combined Lexical Discourse Combined
SVM 82.2 (0.537) 85.1 (0.618) 84.2 (0.613) 87.2 (0.625) 88.5 (0.664) 89.6 (0.71)
Naive Bayes 79.7 (0.64) 80.7 (0.598) 84.6 (0.702) 85.8 (0.679) 85.0 (0.639) 89.2 (0.728)
Bayes Net 80.6 (0.558) 79.1 (0.615) 79.5 (0.64) 82.6 (0.529) 82.0 (0.612) 82.5 (0.619)
Zero-vs-rest
SVM 83.9 (0.907) 84.8 (0.913) 85.9 (0.917) 80.6 (0.888) 81.6 (0.895) 83.0 (0.897)
Naive Bayes 85.3 (0.915) 84.1 (0.908) 85.7 (0.918) 82.7 (0.898) 82.5 (0.895) 83.8 (0.902)
[image:7.612.91.524.62.158.2]Bayes Net 82.4 (0.903) 81.7 (0.891) 82.1 (0.893) 78.3 (0.876) 78.8 (0.868) 78.2 (0.864)
Table 4: Initial relevance classification results on Medical domain. Accuracy and F-measure (in paren-theses) for discourse features, lexical features, and combined features.
6 Discussion and Conclusions
As the quantity of information available from dif-ferent news services increases rapidly, the capa-bility to extract and highlight relevant news items becomes important. For intelligence officers such as business analysts and epidemiologists, it is im-portant that they can limit the amount of time used to monitor extracted facts.
The relevance classifiers form a component of the on-line news monitoring, to predict the rele-vance of extracted events to the users. In the ex-periments in the business domain, the discourse features alone perform better than lexical features. In most cases for the business domain, combining discourse and lexical features helps the classifier. The nature of product launch and corporate acqui-sition news is typically such that most of the infor-mation is available in the first few sentences.
In medical domain, combining discourse and lexical features also generally helps classification performance. Information such as disease type, adjectives related to the event and other subtle hints (e.g. female victims are often described through their family relations) are missing from the discourse features, but have an effect on the classifier performance.
In certain knowledge-intensive domains—such
as the ones studied here—missing a relevant news item carries a higher cost to the end-user. In our future work, we will also test classification with different precision-recall-ratio, by adjusting the classification threshold, to model the utility of the results to the users with a preference for high-or low-relevance news items.
To summarize the points addressed in the paper:
• We present prediction of relevance in the task of event extraction in the domains of public health and business intelligence, that we be-lieve to be generalizable to different domains.
• We emphasize the importance of the user’s perspective when estimating quality, not just the system’s performance. Relevance to the user is at least as important as (if not more important than) correctness.
• For the present, we assume that users have the same notion of relevance of an event in a given domain. We do not model differences between individual users (as with collabora-tive filtering), and treat them as a single group with a shared perspective.
• Our experiments indicate that relevance is a tractable measure of quality, at least in the studied domains.
Our on-going work includes refining the clas-sification approaches, especially exploring feature dependencies using Bayesian networks, extending the system to cover multiple languages, and ex-ploring collaborative filtering to address users’ and user-groups differing interests. We are currently working on applying our approach to other do-mains as well.
Acknowledgements
We thank the anonymous reviewers for their valu-able feedback.
References
ACE. 2004. Automatic content extraction.
A. Bagga and A. W. Biermann. 1997. Analyzing the complexity of a domain with respect to an informa-tion extracinforma-tion task. InProc. 10th Intl. Conf. on
Re-search on Computational Linguistics (ROCLING X).
Allan Bell. 1991.The Language of News Media. Lan-guage in Society. Blackwell, Oxford, September.
R. Bouckaert. 2004. Bayesian network classifiers in Weka. Technical report.
A Culotta and A McCallum. 2004. Confidence es-timation for information extraction. InProc.
HLT-NAACL.
A. Cvitas. 2010. Information extraction in business intelligence systems. InMIPRO, 2010 Proceedings
of the 33rd International Convention.
C.C. Freifeld, K.D. Mandl, B.Y. Reis, and J.S. Brown-stein. 2008. HealthMap: Global infectious disease monitoring through automated classification and vi-sualization of internet media reports. J. Am. Med.
Inform. Assoc., 15(1).
R. Grishman, S. Huttunen, and R. Yangarber. 2002. Event extraction for infectious disease outbreaks. In Proc. 2nd Human Language Technology Conf. (HLT
2002), San Diego, CA.
R. Grishman, S. Huttunen, and R. Yangarber. 2003. In-formation extraction for enhanced access to disease outbreak reports.J. of Biomed. Informatics,35(4).
M. Hall, E. Frank, G. Holmes, B. Pfahringer, P. Reute-mann, and I. H. Witten. 2009. The WEKA data mining software: an update. SIGKDD Explor.
Newsl., 11(1).
L. Hirschman. 1998. Language understanding evalu-ations: Lessons learned from MUC and ATIS. In Proc. First Int’l Conf. on Language Resources and
Evaluation (LREC), Granada.
S. Huttunen, R. Yangarber, and R. Grishman. 2002. Complexity of event structure in information extrac-tion. InProc. 19th Intl. Conf. Computational
Lin-guistics (COLING 2002), Taipei.
G. H. John and P. Langley. 1995. Estimating continu-ous distributions in bayesian classifiers. InEleventh
Conference on Uncertainty in Artificial Intelligence,
San Mateo. Morgan Kaufmann.
John C. Platt. 1999. Fast training of support vector machines using sequential minimal optimization. In Advances in kernel methods: support vector learn-ing. MIT Press, Cambridge, MA, USA.
H. Saggion, A. Funk, D. Maynard, and K. Bontcheva. 2007. Ontology-based information extraction for business intelligence. InProc. Intl. Semantic Web
Conf. and 2nd Asian Asian Semantic Web Conf.,
ISWC’07/ASWC’07, Berlin, Heidelberg. Springer-Verlag.
R. Steinberger, F. Fuart, E. van der Goot, C. Best, P. von Etter, and R. Yangarber. 2008. Text mining from the web for medical intelligence. In D. Perrotta, J. Piskorski, F. Souli´e-Fogelman, and R. Steinberger, editors,Mining Massive Data Sets for Security. OIS Press, Amsterdam, the Netherlands.
P. von Etter, S. Huttunen, A. Vihavainen, M. Vuorinen, and R. Yangarber. 2010. Assessment of utility in web mining for the domain of public health. InProc. NAACL HLT 2010, Second Louhi Workshop on Text
and Data Mining of Health Documents, Los
Ange-les, CA.
R. Yangarber, C. Best, P. von Etter, F. Fuart, D. Horby, and R. Steinberger. 2007. Combining informa-tion about epidemic threats from multiple sources.
InProc. RANLP-2007 MMIES Workshop, Borovets,