LORIA System for the WMT12 Quality Estimation Shared Task
Langlois David
Raybaud Sylvain LORIA, Universit´e de Lorraine
615 rue du Jardin Botanique 54602 Villers les Nancy, France
Sma¨ıli Kamel
Abstract
In this paper we present the system we sub-mitted to the WMT12 shared task on Quality Estimation. Each translated sentence is given a score between 1 and 5. The score is ob-tained using several numerical or boolean fea-tures calculated according to the source and target sentences. We perform a linear regres-sion of the feature space against scores in the range [1:5]. To this end, we use a Support Vec-tor Machine. We experiment with two kernels: linear and radial basis function. In our submis-sion we use the features from the shared task baseline system and our own features. This leads to 66 features. To deal with this large number of features, we propose an in-house feature selection algorithm. Our results show that a lot of information is already present in baseline features, and that our feature selec-tion algorithm discards features which are lin-early correlated.
1 Introduction
Machine translation systems are not reliable enough to be used directly. They can only be used to grasp the general meaning of texts or help human transla-tors. Confidence measures detect erroneous words or sentences. Such information could be useful for users to decide whether or not to post-edit translated sentences (Specia, 2011; Specia et al., 2010) or se-lect documents mostly correctly translated (Soricut and Echihabi, 2010). Moreover, it is possible to use confidence measures to compare outputs from dif-ferent systems and to recommend the best one (He et al., 2010). One can also imagine that confidence
measures at word-level could be also useful for a machine translation system to automatically correct parts of output: for example, a translation system translates the source sentence, then, this output is translated with another translation system (Simard et al., 2007). This last step could be driven by confi-dence measures.
In previous works (Raybaud et al., 2011; Raybaud et al., 2009a; Raybaud et al., 2009b) we used state-of-the-art features to predict the quality of a transla-tion at sentence- and word-level. Moreover, we pro-posed our own features based on previous works on cross-lingual triggers (Lavecchia et al., 2008; Latiri et al., 2011). We evaluated our work in terms of Dis-crimination Error Trade-off, Equal Error Rate and Normalised Mutual Information.
In this article, we compare the features used in the shared task baseline system and our own features. This leads to 66 features which will be detailed in sections 3 and 4. We therefore deal with many fea-tures. We used a machine learning approach to per-form regression of the feature space against scores given by humans. Machine learning algorithms may not efficiently deal with high dimensional spaces. Moreover, some features may be less discriminant descriptors and then in some cases could add more noise than information. That is why, in this article we propose an in-house feature selection algorithm to remove useless features.
The article is structured as follows. In Section 2, we give an overview of our quality estimation sys-tem. Then, in Sections 3 and 4, we describe the features we experimented with. In section 6, we de-scribe the algorithm we propose for feature
tion. Then we give the results of several configura-tions in Section 7.
2 Overview of our quality estimation submission
Each translated sentence is assigned a score between 1 and 5. 5 means that the machine translation output is perfectly clear and intelligible and 1 means that it is incomprehensible. The score is calculated using several numerical or boolean features extracted ac-cording to the source and target sentences. We per-form a regression of the feature space against[1 : 5].
3 The baseline features
The quality estimation shared task organizers pro-vided a baseline system including several interesting features. Among them, several are yet used in (Ray-baud et al., 2011) but we give below a brief review of the whole baseline features set1:
• Source and target sentences lengths: there is a correlation between the sizes of source and tar-get sentences.
• Average source token length: this is the average number of letters of the words in the sentence. We guess that this feature can be useful because short words have more chance to be tool words.
• Language model likelihood of source and target sentences: a source sentence with low likeli-hood is certainly far from training corpus statis-tics. There is a risk it is badly translated. A tar-get sentence with low likelihood is not suitable in terms of target language.
• Average number of occurrences of the words within the target sentence: too many occur-rences of the same word in the target sentence may indicate a bad translation.
• Average number of translations per source word in the sentence: for each word in the source sentence, the feature indicates how many words of the target sentence are indeed translations of this word in the IBM1 table (with probability higher than 0.2).
1
Indeed, our system takes into input a set of features, and is able to discard redundant features (see Section 6).
• Weighted average number of translations per source word in the sentence: this feature is sim-ilar to the previous one, but a frequent word is given a low weight in the averaging.
• n-gram frequency based features: the baseline system proposes to group the n-gram frequen-cies into 4 quartiles. The features indicate how many n-gram (unigram to trigram) in source sentence are in quartiles 1 and 4. These fea-tures indicate if the source sentence contains n-grams relevant to the training corpus.
• Punctuation based features: there may exist a correlation between punctuation of source and target sentences. The count of punctuation marks in both sentences may then be useful.
Overall, the baseline system proposes 17 features.
4 The LORIA features
In a previous work (Raybaud et al., 2011), we tested several confidence measures. The Quality Measure Task campaign constitutes a good opportunity for us to compare our approach to others. We give below a brief review of our features (we cite again features which are yet presented in baseline features because sometimes, we use a variant of them):
• lengths: three features are generated, lengths of source and target sentences (already presented in baseline features), and ratio of target over source length
• n-gram based features (Duchateau et al., 2002): each word in the source and target sentences is given its 5-gram probability. Then, the sentence-level score is the average of the scores across all words in the sentence. There are 4 features: one for each language (source and tar-get) and one for each direction (left-to-right and right-to-left 5-gram).
• averaged features: a common property of all n-gram based and backoff based features is that a word can get a low score if it is actually correct but its neighbours are wrong. To compensate for this phenomenon we took into account the average score of the neighbours of the word be-ing considered. More precisely, for every rele-vant feature x. defined at word level we also
computed:
xlef t. (wi) = x.(wi−2)∗x.(wi−1)∗x.(wi)
xcentred. (wi) = x.(wi−1)∗x.(wi)∗x.(wi+1)
xright. (wi) = x.(wi)∗x.(wi+1)∗x.(wi+2)
A sentence level feature is then calculated ac-cording to the average of each new ”averaged feature”.
• intra-lingual features: the intra-lingual score of a word in a sentence is the average of the mutual information between that word and the other words in that sentence. Mutual informa-tion is defined by:
I(w1, w2) =P(w1, w2)×log
P(w1, w2)
P(w1)P(w2)
(1) The intra-lingual score of a sentence is the av-erage of the intra-lingual scores of the words in this sentence. There are two features, one for each language.
• cross-lingual features: the cross-lingual score of a word in a target sentence is the average of the mutual information between that word and the words in the source sentence. The cross-lingual score of a target sentence is the average of its constituents.
• IBM1 features: the score of the target sentence is the average translation probability provided by the IBM1 model.
• basic parser: this produces two scores, a bi-nary flag indicating whether any bracketing side the target sentence is correct, and one in-dicating if the sentence ends with an end of sentence symbol (period, colon, semi-colon, question/exclamation/quotation mark, comma, apostrophe, close parenthese)
• out-of-vocabulary: this generates two scores, the number of out-of-vocabulary words in the sentence, and the same one but normalized by the length of the sentence. These scores are used for both sides.
This leads to 49 features. A few ones are equiv-alent to or are strongly correlated to baseline ones. As we want to be able to integrate several sets of fea-tures without prior knowledge, our system is able to discard redundant features (see Section 6).
5 Regression
Our system predicts a score between 1 and 5 for each test sentence. For that, we used the training corpus to perform the linear regression of the input features against scores given by humans. We used SVM al-gorithm to perform this regression (LibSVM toolkit (Chang and Lin, 2011)). We experimented two ker-nels: linear, and radial basis function. For the radial basis function, we used grid search to optimise pa-rameters.
6 Feature Selection
We experimented with many features. Some of them may be very poor predictors. Then, these features may disturb the convergence of the training algo-rithm of SVM. To prevent this drawback, we applied an in-house feature selection algorithm. A feature selection algorithm selects the most relevant features by maximizing a criterion. Feature selection algo-rithms can be divided into two classes: backward and forward (Guyon and Elisseeff, 2003). Backward algorithms remove useless features from a set. For-ward algorithms start with an empty feature set and insert useful features. We implemented a greedy backward elimination algorithm for feature selec-tion. It discards features until a quality criterion stops to decrease. The criterion used is the Mean Av-erage Error (MAE) calculated on the development corpus:
M AE(s, r) =
Pn
i=1|si−ri|
n (2)
wheresis the list of scores predicted by the sys-tem,ris the list of scores given by experts,nis the size of these lists.
Algorithm 1: Feature Selection algorithm begin
Start with a setSof features
while two features inSare linearly
correlated (more than 0.999) do discard one of them fromS CalculateMAEforS
repeat
DecreaseMax←0
forall the featuref ∈Sdo
S′←S\f
CalculatenewMAEforS′
if MAE-newMAE> DecreaseMaxthen
DecreaseMax← MAE-newMAE fchosen←f
ifDecreaseMax>0 then S←S\fchosen
MAE←MAE-DecreaseMax
untilDecreaseMax=0;
For calculating the MAE for a feature set, several steps are necessary: performing the regression be-tween the features and the expert scores on the train-ing corpus, ustrain-ing this regression to predict the scores on the development corpus, calculate the MAE be-tween the predicted scores and the expert scores on this development corpus.
7 Results
We used the data provided by the shared task on Quality Estimation2, without additional corpus. This data is composed of a parallel English-Spanish training corpus. This corpus is made of the con-catenation of europarl-v5 and news-commentary10 corpora (from WMT-2010), followed by tokeniza-tion, cleaning (sentences with more than 80 tokens removed) and truecasing. It has been used for base-line models provided in the basebase-line package by the shared task organizers. We used the same train-ing corpus to train additional language models (for-ward and back(for-ward 5-gram with kneyser-ney dis-counting, obtained with the SRILM toolkit) and trig-gers required for our features. For feature
extrac-2
http://dl.dropbox.com/u/6447503/resources.tbz
tion, we used the files provided by the organizers: 1832 source english sentences, their translations by the baseline translation system, and the score given by humans to these translations. We split these files into a training part (1000 sentences) and a develop-ment part (832 sentences). We used the train part to perform the regression between the features and the scores. We used the development corpus to opti-mise the parameters of the regression and for feature selection. We did not use additional provided infor-mation such as phrase alignment, word alignment, word graph, etc.
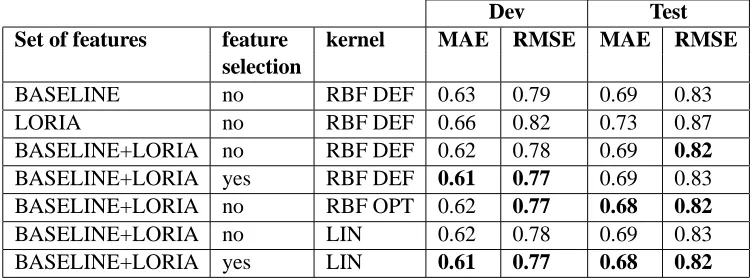
Table 1 presents our results in terms of MAE and Root Mean Squared Error (RMSE). MAE is de-scribed in Formula 2, and RMSE is defined by:
RM SE(s, r) =
r Pn
i=1(si−ri)2
n (3)
Each line of Table 1 gives the performance for a set of features. BASELINE+LORIA constitutes the union of both features BASELINE (Section 3) and LORIA (Section 4). the ’feature selection’ column indicates if feature selection algorithm is applied. We experimented the SVM with two kernels: lin-ear (LIN in Table 1) and radial basis function (RBF in Table 1). As the radial basis function uses pa-rameters, we proposed results with default values (DEF) and with values optimised by grid search on the development corpus (OPT). MAE and RMSE are given for development corpus and for the test cor-pus. This test corpus (and its reference scores given by humans) is the one released for the shared 2012 task3. MAE and RMSE has been computed against the scores given by humans to the translations in this test corpus4.
The results show that the performance on devel-opment corpus are always confirmed by those of the test corpus. The BASELINE features alone achieve already good performance, better than ours. Al-though the differences are well inside the confidence interval, the fusion of both sets outperforms slightly the BASELINE. The feature selection algorithm al-lows to gain 0.01 point. The gain is the same for
3
https://github.com/lspecia/QualityEstimation/blob/master/ test set.tar.gz
4
the optimisation of the radial basis function param-eters. Surprisingly, the linear kernel, simpler than other kernels, yields the same performance as radial basis function.
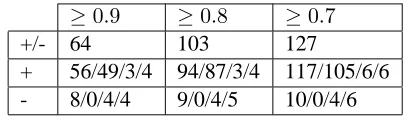
In addition to MAE and RMSE results, we stud-ied the linear correlations between features: our ob-jective is to check if BASELINE and LORIA com-plement each other. We computed the linear cor-relation between all features (BASELINE+LORIA). This leads to 2145 values. Table 2 shows in line +/-the number of features pairs which correlate with an absolute score higher than thresholds 0.9, 0.8 or 0.7. Among these pairs we give in line + the number of pairs with positive correlation, and in line - the num-ber of pairs with negative correlation. For lines + and -, we give 4 numbers: number of pairs, num-ber of LORIA-LORIA (e.g. the numnum-ber of correla-tions between a LORIA feature and another LORIA feature) pairs, number of BASELINE-BASELINE pairs, number of LORIA-BASELINE pairs. We re-mark that only 6% of the pairs correlates (column 0.7, line +/-) and that the correlations are mostly be-tween LORIA features. This last point is not sur-prising because there are more LORIA features than BASELINE ones. There are very few correlations between LORIA and BASELINE features. We stud-ied precisely the correlated pairs. There is a strong (more than 0.9) positive correlation between n-gram and backoff based features and their averaged fea-ture versions. Sometimes, there is also a strong cor-relation between ’forward’ and ’backward’ features. Source and target sentences lengths linearly corre-late (0.98). This is the same case for source and tar-get language model likelihoods. There is also a high correlation between forward and backward 5-gram scores (0.89). There are very few negative correla-tions between features. As they are not numerous, one can list these pairs with correlation between -1 and -0.7: target sentence length and target lan-guage model probability; source sentence length and source language model probability; ratio of OOV words over sentence length in source sentence and percentage of unigrams in the source sentence seen in the SMT training corpus; and number of OOV words in source sentence and percentage of uni-grams in the source sentence seen in the SMT train-ing corpus. These correlations are not surpristrain-ing. First, language model probability is not normalized
≥0.9 ≥0.8 ≥0.7
+/- 64 103 127
[image:5.612.324.527.56.114.2]+ 56/49/3/4 94/87/3/4 117/105/6/6 - 8/0/4/4 9/0/4/5 10/0/4/6
Table 2: Statistics on the linear correlations between LO-RIA+BASELINE features
by the number of tokens: the more tokens, the lower probability. Second, the more OOV in the sentence, the fewer known unigrams.
Last, we present the set of features discarded by our feature selection algorithm. We give only this description for the LORIA+BASELINE set, with linear kernel. The algorithm discards 18 LORIA features out of 49 (37%) and 3 BASELINE out of 17 (18%). The features discarded from LORIA are mostly averaged features based onn-gram and back-off. This is consistent with the fact that these fea-tures are strongly correlated withn-gram and back-off features. We remark that very few BASELINE features are discarded: lengths of source and target language because these features are yet included in LORIA features, and ”average number of transla-tions per source word in the sentence” maybe be-cause the LORIA feature giving the average IBM1 probabilities is more precise. Last, we remark that the target length feature is discarded, and only ratio between target and source length is kept.
8 Conclusion
Dev Test
Set of features feature kernel MAE RMSE MAE RMSE
selection
BASELINE no RBF DEF 0.63 0.79 0.69 0.83
LORIA no RBF DEF 0.66 0.82 0.73 0.87
BASELINE+LORIA no RBF DEF 0.62 0.78 0.69 0.82
BASELINE+LORIA yes RBF DEF 0.61 0.77 0.69 0.83
BASELINE+LORIA no RBF OPT 0.62 0.77 0.68 0.82
BASELINE+LORIA no LIN 0.62 0.78 0.69 0.83
[image:6.612.118.494.58.198.2]BASELINE+LORIA yes LIN 0.61 0.77 0.68 0.82
Table 1: Results of the various sets of features in terms of MAE and RMSE
remark is confirmed by our feature selection algo-rithm. Our feature selection algorithm seems to dis-card features linearly correlated with others while keeping relevant features for prediction. Last, we remark that the choice of kernel, optimisation of pa-rameters and feature selection have not a strong ef-fect on performance. The main effort may have to be concentrated on features in the future.
References
C.-C. Chang and C.-J. Lin. 2011. LIBSVM: A library for support vector machines. ACM Transactions on Intelligent Systems and Tech-nology, 2:27:1–27:27. Software available at http://www.csie.ntu.edu.tw/ cjlin/libsvm.
J. Duchateau, K. Demuynck, and P. Wambacq. 2002. Confidence scoring based on backward language mod-els. In Proceedings of IEEE International
Confer-ence on Acoustics, Speech, and Signal Processing,
vol-ume 1, pages 221–224.
I. Guyon and A. Elisseeff. 2003. An introduction to vari-able and feature selection. Journal of Machine
Learn-ing Research (Special Issue on Variable and Feature Selection), pages 1157–1182.
Y. He, Y. Ma, J. van Genabith, and A. Way. 2010. Bridg-ing SMT and TM with translation recommendation. In
Proceedings of the 48th Annual Meeting of the Associ-ation for ComputAssoci-ational Linguistics, pages 622–630.
C. Latiri, K. Sma¨ıli, C. Lavecchia, C. Nasri, and D. Lan-glois. 2011. Phrase-based machine translation based on text mining and statistical language modeling tech-niques. In Proceedings of the 12th International
Con-ference on Intelligent Text Processing and Computa-tional Linguistics.
C. Lavecchia, K. Sma¨ıli, and D. Langlois. 2008. Dis-covering phrases in machine translation by simulated
annealing. In Proceedings of the Eleventh Interspeech
Conference.
S. Raybaud, C. Lavecchia, D. Langlois, and K. Sma¨ıli. 2009a. New confidence measures for statistical ma-chine translation. In Proceedings of the
Interna-tional Conference on Agents and Artificial Intelli-gence, pages 61–68.
S. Raybaud, C. Lavecchia, D. Langlois, and K. Sma¨ıli. 2009b. Word- and sentence-level confidence measures for machine translation. In Proceedings of the 13th
Annual Conference of the European Association for Machine Translation, pages 104–111.
S. Raybaud, D. Langlois, and K. Sma¨ıli. 2011. ”This sentence is wrong.” Detecting errors in machine-translated sentences. Machine Translation, 25(1):1– 34.
M. Simard, N. Ueffing, P. Isabelle, and R. Kuhn. 2007. Rule-based translation with statistical phrase-based post-editing. In Proceedings of the ACL-2007
Work-shop on Statistical Machine Translation (WMT-07),
pages 203–206.
R. Soricut and A. Echihabi. 2010. Trustrank: Inducing trust in automatic translations via ranking. In
Proceed-ings of the 48th Annual Meeting of the Association for Computational Linguistics, pages 612–621.
L. Specia, N. Hajlaoui, C. Hallett, and W. Aziz. 2010. Predicting machine translation adequacy. In
Proceed-ings of the Machine Translation Summit XIII, pages
612–621.
L. Specia. 2011. Exploiting objective annotations for measuring translation post-editing effort. In
Proceed-ings of the 15th Conference of the European Associa-tion for Machine TranslaAssocia-tion, pages 73–80.
C. Uhrik and W. Ward. 1997. Confidence metrics based on n-gram language model backoff behaviors. In Fifth