Classifying Gene Sentences in Biomedical Literature by
Combining High-Precision Gene Identifiers
Sun Kim, Won Kim, Don Comeau, and W. John Wilbur
National Center for Biotechnology Information National Library of Medicine, National Institutes of Health
Bethesda, MD 20894, USA
{sun.kim,won.kim,donald.comeau,john.wilbur}@nih.gov
Abstract
Gene name identification is a fundamental step to solve more complicated text mining problems such as gene normalization and pro-tein-protein interactions. However, state-of-the-art name identification methods are not yet sufficient for use in a fully automated sys-tem. In this regard, a relaxed task, gene/protein sentence identification, may serve more effectively for manually searching and browsing biomedical literature. In this pa-per, we set up a new task, gene/protein sen-tence classification and propose an ensemble approach for addressing this problem. Well-known named entity tools use similar gold-standard sets for training and testing, which results in relatively poor performance for un-known sets. We here explore how to combine diverse high-precision gene identifiers for more robust performance. The experimental results show that the proposed approach out-performs BANNER as a stand-alone classifier for newly annotated sets as well as previous gold-standard sets.
1
Introduction
With the rapidly increasing biomedical literature, text mining has become popular for finding bio-medical information in text. Among others, named entity recognition (NER) for bio-entities such as genes and proteins is a fundamental task because
extracting biological relationships begins with enti-ty identification. However, NER in biomedical literature is challenging due to the irregularities and ambiguities in bio-entities nomenclature (Yang et al., 2008). In particular, compound entity names make this problem difficult because it also requires deciding word boundaries.
Recent bio-text competitions such as JNLPBA (Kim et al., 2004) and BioCreative (Lu et al., 2011; Smith et al., 2008) have evaluated NER systems for gene mentions. Even though progress has been made in several areas, gene identification methods are not yet sufficient for real-world use without human interaction (Arighi et al., 2011). Thus, at the present, a realistic suggestion is to use these algorithms as an aid to human curation and infor-mation retrieval (Altman et al., 2008).
In this paper, we define a new task, gene/protein sentence classification. A gene or protein sentence means a sentence including at least one specific gene or protein name. This new task has ad-vantages over gene mention identification. First, gene name boundaries are not important at the sen-tence level and human judges will agree more in their judgments. Second, highlighting gene sen-tences may be more useful in manual search and browsing environments since this can be done more accurately and with less distraction from in-correct annotations.
To classify gene/protein sentences, we here pro-pose an ensemble approach to combine different NER identifiers. Previous NER approaches are mostly developed on a small number of
standard sets including GENIA (Kim et al., 2003) and BioCreative (Smith et al., 2008) corpora. The-se The-sets help to find regular name patterns in a lim-ited set of articles, but also limit the NER performance for real-world use. In the proposed approach, we use a Semantic Model and a Priority Model along with BANNER (Leaman and Gonzalez, 2008). The Semantic and Priority Mod-els are used to provide more robust performance on gene/protein sentence classification because they utilize larger resources such as SemCat and Pub-Med○R to detect gene names.
For experiments, we created three new gold-standard sets to include cases appearing in the most recent publications. The experimental results show that our approach outperforms machine learning classifiers using unigrams and substring features as well as stand-alone BANNER classification on five gold-standard datasets.
The paper is organized as follows. In Section 2, the ensemble approach for gene/protein sentence classification is described. Section 3 explains the gold-standard sets used for our experiments. Sec-tion 4 presents and discusses the experimental re-sults. Conclusions are drawn in Section 5.
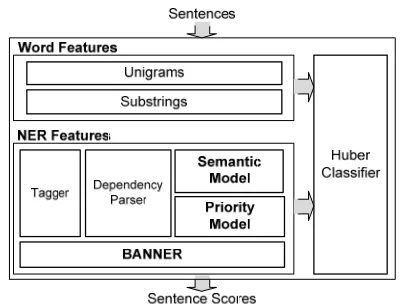
[image:2.612.86.289.417.571.2]2
Methods
Figure 1. Method Overview.
Figure 1 shows the overall framework for our pro-posed approach. We basically assume that a main NER module works as a strong predictor, i.e., the majority of outputs obtained from this module are correct. We here use BANNER (Leaman and Gonzalez, 2008) as the main NER method because it adopts features and methods which are generally known to be effective for gene name recognition. While BANNER shows good performance on
well-known gold-standard sets, it suffers from rela-tively poor performance on unknown examples. To overcome this problem, we combine BANNER with two other predictors, a Sematic Model and a Priority Model. First, the Semantic Model and the Priority Model do not use previous gold-standard sets for training. Second, these two models learn name patterns in different ways, i.e., semantic rela-tionships for the Semantic Model and positional and lexical information for the Priority Model. This combination of a strong predictor and two weaker but more general predictors can respond better to unknown name patterns.
As described above, the proposed method main-ly relies on outputs from different NER methods, whereas word features can still provide useful evi-dence for discriminating gene and non-gene sen-tences. Hence, we alternatively utilize word features such as unigrams and substrings along with NER features. For NER features only, the output is the sum of binary decisions from three NER modules. For word and NER features, the Huber classifier (Kim and Wilbur, 2011) is trained to combine the features. The parameter set in the Huber classifier is optimized to show the best clas-sification performance on test sets. The following subsections describe each feature type used for gene sentence classification.
2.1 Word Features
Unigrams are a set of words obtained from to-kenizing sentences on white space. All letters in unigrams are converted to lower case.
Substrings are all contiguous substrings of a sen-tence, sized three to six characters. This substring feature may help reduce the difference between distributions on training and test sets (Huang et al., 2008). Substrings encode the roots and morpholo-gy of words without identifying syllables or stems. They also capture neighboring patterns between words.
2.2 BANNER
BANNER is a freely available tool for identifying gene mentions. Due to its open-source policy and Java implementation, it has become a popular tool.
orthographic, morphological and shallow syntax features (Leaman and Gonzalez, 2008):
(1) The part of speech (POS) of a token in a sen-tence.
(2) The lemma of a word.
(3) 2, 3 and 4-character prefixes and suffixes. (4) 2 and 3 character n-grams including start-of-token and end-of-start-of-token indicators.
(5) Word patterns by converting upper-case letters, lower-case letters and digits to their corresponding representative characters (A, a, 0).
(6) Numeric normalization by converting digits to “0”s.
(7) Roman numerals. (8) Names of Greek letters.
Even though BANNER covers most popular feature types, it does not apply semantic features or other post-processing procedures such as abbrevia-tion processing. However, these features may not have much impact for reducing performance since our goal is to classify gene sentences, not gene mentions.
2.3 Semantic Model
The distributional approach to semantics (Harris, 1954) has become more useful as computational power has increased, and we have found this ap-proach helpful in the attempt to categorize entities found in text. We use a vector space approach to modeling semantics (Turney and Pantel, 2010) and compute our vectors as described in (Pantel and Lin, 2002) except we ignore the actual mutual in-formation and just include a component of 1 if the dependency relation occurs at all for a word, else the component is set to 0. We constructed our vec-tor space from all single tokens (a token must have an alphabetic character) throughout the titles and abstracts of the records in the whole of the Pub-Med database based on a snapshot of the database taken in January 2012. We included only tokens that occurred in the data sufficient to accumulate 10 or more dependency relations. There were just over 750 thousand token types that satisfied this condition and are represented in the space. We de-note this space by h. We then took all the single tokens and all head words from multi-token strings in the categories “chemical”, “disease”, and “gene/protein” from an updated version of the
SemCat database (Tanabe et al., 2006) and placed all the other SemCat categories similarly processed into a category we called “other”. We consider on-ly the tokens in these categories that also occur in our semantic vector space h and refer to these sets as hChemical, hDisease, hGene/Protein, hOther. Table 1 shows
the size of overlaps between sets.
Chemical
h hDisease hGene/Protein hOther
Chemical
h 54478 209 4605 5495
Disease
h 8801 1139 169
in Gene/Prote
h 76440 9466
Other
[image:3.612.313.539.169.244.2]h 127337
Table 1. Pairwise overlap between sets representing the different categories.
Class '
Chemical h ' Disease h ' in Gene/Prote h ' Other h
Strings 49800 7589 70832 113815
Ave. Prec. 0.8680 0.7060 0.9140 0.9120
Table 2. Row two contains the number of unique strings in the four different semantic classes studied. The last row shows the mean average precisions from a 10-fold cross validation to learn how to distinguish each class from the union of the other three.
In order to remove noise or ambiguity in the training set, we removed the tokens that appeared in more than one semantic class as follows.
Chemical Disease Gene/Protein
Other ' Other Disease Chemical in Gene/Prote ' in Gene/Prote in Gene/Prote Chemical Disease ' Disease in Gene/Prote Disease Chemical ' Chemical h h h h h h h h h h h h h h h h h (1)We then applied Support Vector Machine learn-ing to the four resultlearn-ing disjoint semantic classes in a one-against-all strategy to learn how to classify into the different classes. We used C1.64103 based upon the size of the training set. As a test of this process we applied this same learning with 10-fold cross validation on the training data and the results are given in the last row of Table 2.
[image:3.612.329.520.439.503.2]depend-ent-word combinations. Since gene names likely appear in describing a relationship with other enti-ties, a name indicating a gene mention will be mostly placed in a dependent position. Thus, we first apply the C&C CCG parser (Curran et al., 2007), and evaluate words in dependent positions only.
2.4 Priority Model
The Semantic Model detects four different catego-ries for a single word. However, the Priority Model captures gene name patterns by analyzing the order of words and the character strings making up words. Since gene names are noun phrases in gen-eral, we parse sentences and identify noun phrases first. These phrases are then evaluated using the Priority Model.
The Priority Model is a statistical language model for named entity recognition (Tanabe and Wilbur, 2006). For named entities, a word to the right is more likely to be the word determining the nature of the entity than a word to the left in gen-eral.
Let T1 be the set of training data for class C1 and
T2 for class C2. Let
t A denote the set of allto-kens used in names contained in T1T2. For each token tα, A, it is assumed that there are
associ-ated two probabilities pα and qα, where pα is the
probability that the appearance of the token tα in a
name indicates that name belongs to class C1 and
qα is the probability that tα is a more reliable
indi-cator of the class of a name than any token to its left. Let nt(1)t(2)t(k) be composed of the
tokens on the right in the given order. Then the probability of n belonging to class C1 can be
com-puted as follows.
k
i
k
i j
j i
i k
j
j q p q
q p
n C p
2 1
) ( )
( ) ( 2
) ( )
1 (
1| 1 1 (2)
A limited memory BFGS method (Nash and Nocedal, 1991) and a variable order Markov model (Tanabe and Wilbur, 2006) are used to obtain pα
and qα. An updated version of SemCat (Tanabe and
Wilbur, 2006) was used to learn gene names.
2.5 Semantic and Priority Models for
High-Precision Scores
The Semantic and Priority Models learn gene names and other necessary information from the SemCat database, where names are semantically categorized based on UMLS○R (Unified Medical Language System) Semantic Network. Even though the Semantic and Priority Models show good performance on names in SemCat, they can-not avoid noise obtained from incorrect pre-processing, e.g., parsing errors. The use of a gen-eral category for training may also limit perfor-mance. To obtain high-precision scores for our ensemble approach, it is important to reduce the number of false positives from predictions. Hence, we apply the Semantic and Priority Models on training sets, and mark false positive cases. These false positives are automatically removed from predictions on test sets. These false positive cases tend to be terms for entities too general to warrant annotation.
Table 3 shows the classification performance with and without false positive corrections on training data. For both Semantic and Priority Mod-els, precision rates are increased by removing false positives. Even though recall drops drastically, this does not cause a big problem in our setup since these models try to detect gene names which are not identified by BANNER.
SEM SEMFP PM PMFP
Accuracy 0.7907 0.7773 0.7805 0.8390 Precision 0.7755 0.8510 0.7405 1.0000
Recall 0.8323 0.6852 0.8799 0.6856
F1 0.8029 0.7592 0.8042 0.8135
Table 3. Performance changes on training set for the Semantic Model (SEM) and the Priority Model (PM). FP indicates that learned false positives were removed from predictions.
3
Datasets
For experiments, we rigorously tested the proposed method on gene mention gold-standard sets and newly annotated sets. GENETAG (Smith et al., 2008) is the dataset released for BioCreative I and BioCreative II workshops. Since it is well-known for a gene mention gold-standard set, we used GENETAG as training data.
both related to GENIA corpus, a well-known gold-standard set. However, Disease, Cell Line and Reptiles are considered as more difficult tasks be-cause they represent new areas and contain recent-ly published articles. The annotation guideline for new test sets basically followed those used in GENETAG (Tanabe et al., 2005), however do-mains, complexes, subunits and promoters were not included in new sets.
(1) “Disease” Set: This set of 60 PubMed docu-ments was obtained from two sources. Fifty of the documents were obtained from the 793 PubMed documents used to construct the AZDC (Leaman et al., 2009). They are the fifty most recent among these records. In addition to these fifty documents, ten documents were selected from PubMed on the topic of maize to add variety to the set and because one of the curators who worked with the set had experience studying the maize genome. These ten were chosen as recent documents as of early March 2012 and which contained the text word maize and discussed genetics. The whole set of 60 docu-ments were annotated by WJW to produce a gold standard.
(2) “CellLine” Set: This set comprised the most recent 50 documents satisfying the query “cell line[MeSH]” in PubMed on March 15, 2012. This query was used to obtain documents which discuss cell lines, but most of these documents also discuss genes and for this reason the set was expected to be challenging. The set was annotated by WJW and DC and after independently annotating the set they reconciled differences to produce a final gold standard.
(3) “Reptiles” Set: This set comprised the most recent 50 documents satisfying the query “reptiles AND genes [text]” in PubMed on March 15, 2012. This set was chosen because it would have little about human or model organisms and for this rea-son it was expected to be challenging. The set was annotated by WJW and DC and after independent-ly annotating the set they reconciled differences to produce a final gold standard.
For both “CellLine” and “Reptiles” Sets, the most recent data was chosen in an effort to make the task more challenging. Presumably such docu-ments will contain more recently created names
and phrases that do not appear in the older training data. This will then pose a more difficult test for NER systems.
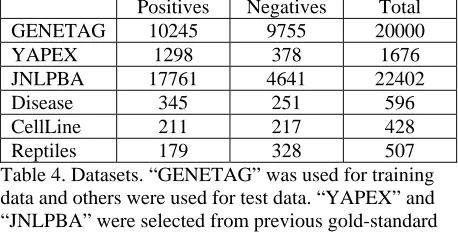
Table 4 shows all datasets used for training and testing. The new sets, “Disease”, “CellLine” and “Reptiles” are also freely available at http://www.ncbi.nlm.nih.gov/CBBresearch/Wilbur/ IRET/bionlp.zip
Positives Negatives Total
GENETAG 10245 9755 20000
[image:5.612.313.542.182.298.2]YAPEX 1298 378 1676 JNLPBA 17761 4641 22402 Disease 345 251 596 CellLine 211 217 428 Reptiles 179 328 507 Table 4. Datasets. “GENETAG” was used for training data and others were used for test data. “YAPEX” and “JNLPBA” were selected from previous gold-standard corpora. “Disease”, “Cell Line” and “Reptiles” are new-ly created from recent publications and considered as difficult sets.
4
Results and Discussion
In this paper, our goal is to achieve higher-prediction performance on a wide range of gene sentences by combining multiple gene mention identifiers. The basic assumption here is that there is a strong predictor that performs well for previ-ously known gold-standard datasets. For this strong predictor, we selected BANNER since it includes basic features that are known to give good performance.
Accuracy Precision Recall F1
GENETAG 0.9794 0.9817 0.9779 0.9799
YAPEX 0.9051 0.9304 0.9483 0.9392
JNLPBA 0.8693 0.9349 0.8976 0.9159
Disease 0.8591 0.9223 0.8261 0.8716
Cell Line 0.8925 0.9146 0.8626 0.8878
Reptiles 0.8994 0.8478 0.8715 0.8595
Table 5. Performance of BANNER on training and test datasets.
Unigrams Substrings BANNER Ensemble Uni+Ensemble Sub+Ensemble
YAPEX 0.9414 0.9491 0.9685 0.9704 0.9624 0.9678
JNLPBA 0.9512 0.9504 0.9584 0.9651 0.9625 0.9619
Disease 0.8255 0.8852 0.9238 0.9501 0.9573 0.9610
CellLine 0.8174 0.9004 0.9281 0.9539 0.9429 0.9496
Reptiles 0.6684 0.7360 0.8696 0.9049 0.9001 0.8937
Table 6. Average precision results on test sets for different feature combinations.
Unigrams Substrings BANNER Ensemble Uni+Ensemble Sub+Ensemble
YAPEX 0.8735 0.8819 0.9321 0.9196 0.9298 0.9336
JNLPBA 0.8902 0.8938 0.9111 0.9197 0.9262 0.9264
Disease 0.7449 0.7884 0.8479 0.8894 0.8957 0.9043
CellLine 0.7346 0.8057 0.8698 0.9017 0.9052 0.8957
Reptiles 0.6257 0.6816 0.8499 0.8199 0.8547 0.8547
Table 7. Breakeven results on test sets for different feature combinations.
Just one fiber gene was revealed in this strain.
This transcription factor family is characterized by
a DNA-binding alpha-subunit harboring the Runt domain and a secondary subunit, beta, which binds to the Runt domain and enhances its interaction with DNA.
Figure 2. False positive examples including misleading words.
YAPEX and JNLPBA are gold-standard sets that partially overlap the GENIA corpus. Since BANNER utilizes features from previous research on GENETAG, YAPEX and JNLPBA, we expect good performance on these data sets. For that rea-son, we created the three additional gold-standard sets to use in this study, and we believe the per-formance on these sets is more representative of what could be expected when our method is ap-plied to cases recently appearing in the literature.
Table 6 show average precision results for the different methods and all the test sets. GENETAG is left out because BANNER is trained on GENETAG. We observe improved performance of the ensemble methods over unigrams, substrings and BANNER. The improvement is small on YAPEX and JNLPBA, but larger for Disease, CellLine and Reptiles. We see that unigrams and substrings tend to add little to the plain ensemble.
The MAP (Mean Average Precision) values in Table 6 are in contrast to the breakeven results in Table 7, where we see that unigrams and sub-strings included with the ensemble generally give improved results. Some of the unigrams and sub-strings are specific enough to detect gene/protein
names with high accuracy, and improve precision in top ranks in a way that cannot be duplicated by the annotations coming from Semantic or Priority Models or BANNER. In addition, substrings may capture more information than unigrams because of their greater generality.
Some of our errors are due to false positive NER identifications. By this we mean a token was clas-sified as a gene/protein by BANNER or the Se-mantic or Priority Models. This often happens when the name indeed represents a gene/protein class, which is too general to be marked positive (Figure 2). A general way in which this problem could be approached is to process a large amount of literature discussing genes or proteins and look for names that are marked as positives by one of the NER identifiers, and which appear frequently in plural form as well as in the singular. Such names are likely general class names, and have a high probability to be false positives.
Another type of error will arise when unseen to-kens are encountered. If such toto-kens have string similarity to gene/protein names already encoun-tered in the SemCat data, they may be recognized by the Priority Model. But there will be completely new strings. Then one must rely on context and this may not be adequate. We think there is little that can be done to solve this short of better lan-guage understanding by computers.
ma-chine learning methods. We believe it beneficial that human users are directed to sentences that con-tain the entities they seek without necessity of viewing the less accurate entity specific tagging which they may then have to correct.
5
Conclusions
We defined a new task for classifying gene/protein sentences as an aid to human curation and infor-mation retrieval. An ensemble approach was used to combine three different NER identifiers for im-proved gene/protein sentence recognition. Our ex-periments show that one can indeed find improved performance over a single NER identifier for this task. An additional advantage is that performance at this task is significantly more accurate than gene/protein NER. We believe this improved accu-racy may benefit human users of this technology. We also make available to the research community three gold-standard gene mention sets, and two of these are taken from the most recent literature ap-pearing in PubMed.
Acknowledgments
This work was supported by the Intramural Re-search Program of the National Institutes of Health, National Library of Medicine.
References
R. B. Altman, C. M. Bergman, J. Blake, C. Blaschke, A. Cohen, F. Gannon, L. Grivell, U. Hahn, W. Hersh, L. Hirschman, L. J. Jensen, M. Krallinger, B. Mons, S. I. O'donoghue, M. C. Peitsch, D. Rebholz-Schuhmann, H. Shatkay, and A. Valencia. 2008. Text mining for biology - the way forward: opinions from
leading scientists. Genome Biol, 9 Suppl 2:S7.
C. N. Arighi, Z. Lu, M. Krallinger, K. B. Cohen, W. J. Wilbur, A. Valencia, L. Hirschman, and C. H. Wu. 2011. Overview of the BioCreative III workshop.
BMC Bioinformatics, 12 Suppl 8:S1.
J. R. Curran, S. Clark, and J. Bos. 2007. Linguistically motivated large-scale NLP with C&C and boxer. In
Proceedings of the 45th Annual Meeting of the ACL on Interactive Poster and Demonstration Sessions,
pages33-36.
K. Franzen, G. Eriksson, F. Olsson, L. Asker, P. Liden, and J. Coster. 2002. Protein names and how to find
them. Int J Med Inform, 67:49-61.
Z. S. Harris. 1954. Distributional structure. Word,
10:146-162.
M. Huang, S. Ding, H. Wang, and X. Zhu. 2008. Mining physical protein-protein interactions from the
literature. Genome Biol, 9 Suppl 2:S12.
J.-D. Kim, T. Ohta, Y. Tateisi, and J. Tsujii. 2003. GENIA corpus - semantically annotated corpus for
bio-textmining. Bioinformatics, 19 Suppl
1:i180-i182.
J.-D. Kim, T. Ohta, Y. Tsuruoka, Y. Tateisi, and N. Collier. 2004. Introduction to the bio-entity
recognition task at JNLPBA. In Proceedings of the
International Joint Workshop on Natural Language Processing in Biomedicine and its Applications,
pages70-75.
S. Kim and W. J. Wilbur. 2011. Classifying protein-protein interaction articles using word and syntactic
features. BMC Bioinformatics, 12 Suppl 8:S9.
R. Leaman and G. Gonzalez. 2008. BANNER: an executable survey of advances in biomedical named
entity recognition. In Proceedings of the Pacific
Symposium on Biocomputing,pages652-663.
R. Leaman, C. Miller, and G. Gonzalez. 2009. Enabling recognition of diseases in biomedical text with
machine learning: corpus and benchmark. In 2009
Symposium on Languages in Biology and Medicine. Z. Lu, H. Y. Kao, C. H. Wei, M. Huang, J. Liu, C. J.
Kuo, C. N. Hsu, R. T. Tsai, H. J. Dai, N. Okazaki, H. C. Cho, M. Gerner, I. Solt, S. Agarwal, F. Liu, D. Vishnyakova, P. Ruch, M. Romacker, F. Rinaldi, S. Bhattacharya, P. Srinivasan, H. Liu, M. Torii, S. Matos, D. Campos, K. Verspoor, K. M. Livingston, and W. J. Wilbur. 2011. The gene normalization task
in BioCreative III. BMC Bioinformatics, 12 Suppl
8:S2.
S. G. Nash and J. Nocedal. 1991. A numerical study of the limited memory BFGS method and the
truncated-Newton method for large scale optimization. SIAM
Journal on Optimization, 1:358-372.
P. Pantel and D. Lin. 2002. Discovering word senses
from text. In Proceedings of the Eighth ACM
SIGKDD International Conference on Knowledge Discovery and Data Mining,pages613-619.
L. Smith, L. K. Tanabe, R. J. Ando, C. J. Kuo, I. F. Chung, C. N. Hsu, Y. S. Lin, R. Klinger, C. M. Friedrich, K. Ganchev, M. Torii, H. Liu, B. Haddow, C. A. Struble, R. J. Povinelli, A. Vlachos, W. A. Baumgartner, Jr., L. Hunter, B. Carpenter, R. T. Tsai, H. J. Dai, F. Liu, Y. Chen, C. Sun, S. Katrenko, P. Adriaans, C. Blaschke, R. Torres, M. Neves, P. Nakov, A. Divoli, M. Mana-Lopez, J. Mata, and W. J. Wilbur. 2008. Overview of BioCreative II gene
mention recognition. Genome Biol, 9 Suppl 2:S2.
L. Tanabe, L. H. Thom, W. Matten, D. C. Comeau, and W. J. Wilbur. 2006. SemCat: semantically
categorized entities for genomics. In AMIA Annu
L. Tanabe and W. J. Wilbur. 2006. A priority model for
named entities. In Proceedings of the Workshop on
Linking Natural Language Processing and Biology: Towards Deeper Biological Literature Analysis,
pages33-40.
L. Tanabe, N. Xie, L. H. Thom, W. Matten, and W. J. Wilbur. 2005. GENETAG: a tagged corpus for
gene/protein named entity recognition. BMC
Bioinformatics, 6 Suppl 1:S3.
P. D. Turney and P. Pantel. 2010. From frequency to
meaning: vector space models of semantics. Journal
of Artificial Intelligence Research, 37:141-188. Z. Yang, H. Lin, and Y. Li. 2008. Exploiting the
contextual cues for bio-entity name recognition in