An Unsupervised Approach to User Simulation: toward Self-Improving
Dialog Systems
Sungjin Lee1,2 and Maxine Eskenazi1
1Language Technologies Institute, Carnegie Mellon University, Pittsburgh, Pennsylvania 2Computer Science and Engineering, Pohang University of Science and Technology, South Korea
{sungjin.lee, max}@cs.cmu.edu1, [email protected]2
Abstract
This paper proposes an unsupervised ap-proach to user simulation in order to automati-cally furnish updates and assessments of a de-ployed spoken dialog system. The proposed method adopts a dynamic Bayesian network to infer the unobservable true user action from which the parameters of other components are naturally derived. To verify the quality of the simulation, the proposed method was applied to the Let’s Go domain (Raux et al., 2005) and a set of measures was used to analyze the simulated data at several levels. The results showed a very close correspondence between the real and simulated data, implying that it is possible to create a realistic user simulator that does not necessitate human intervention.
1 Introduction
For the past decade statistical approaches to dialog modeling have shown positive results for optimizing a dialog strategy with real data by applying well-understood machine learning methods such as rein-forcement learning (Henderson et al., 2008; Thom-son and Young, 2010; Williams and Young, 2007b). User simulation is becoming an essential component in developing and evaluating such systems. In this paper we describe an unsupervised process to au-tomatically develop user simulators. The motiva-tion for this comes from the fact that many systems are presently moving from being simple lab simu-lations to actual deployed systems with real users. These systems furnish a constant flow of new data that needs to be processed in some way. Our goal is to minimize human intervention in processing this
data. Previously, data had to be hand-annotated, a slow and costly process. Recently crowdsourcing has made annotation faster and less expensive, but all of the data still has to be processed and time must be spent in creating the annotation interface and tasks, and in quality control. Our goal is to pro-cess the metadata (e.g. user actions, goals, error ty-pology) in an unsupervised manner. And our method eliminates the need for human transcription and an-notation by inferring the user goal from grounding information. We also consider user actions as la-tent variables which are inferred based on observa-tions from Automatic Speech Recognition (ASR). We used the above inferred user actions paired with the observed actions to build an error model. Since the focus of this work is placed on improving and evaluating the dialog strategy, error simulation can be carried out at the semantic level. This eliminates the need for transcription, which would have neces-sitated an error simulation at the surface level. The end result here will be a system that has as little hu-man intervention as possible.
This paper is structured as follows. Section 2 de-scribes previous research and the novelty of our ap-proach. Section 3 elaborates on our proposed un-supervised approach to user simulation. Section 4 explains the experimental setup. Section 5 presents and discusses the results. Finally, Section 6 con-cludes with a brief summary and suggestions for fu-ture research.
2 Related Work
Previous user simulation studies can be roughly cat-egorized into rule-based methods (Chung, 2005;
Lopez-Cozar et al., 2006; Schatzmann et al., 2007a) and data-driven methods (Cuayahuitl et al., 2005; Eckert et al., 1997; Jung et al., 2009; Levin et al., 2000; Georgila et al., 2006; Pietquin, 2004). Rule-based methods generally allow for more control over their designs for the target domain while data-driven methods afford more portability from one domain to another and are attractive for modeling user behav-ior based on real data. Although development costs for data-driven methods are typically lower than those of rule-based methods, previous data-driven approaches have still required a certain amount of human effort. Most intention-level models take a semantically annotated corpus to produce user in-tention without introducing errors (Cuayahuitl et al., 2005; Jung et al., 2009). Surface-level approaches need transcribed data to train their surface form and error generating models (Jung et al., 2009; Schatz-mann et al., 2007b). A few studies have attempted to directly simulate the intention, surface, and error by applying their statistical methods on the recognized data rather than on the transcribed data (Georgila et al., 2006; Schatzmann et al., 2005). Although such approaches can avoid human intervention, the sole incorporation of erroneous user action can propa-gate those errors to the higher-level discourse fea-tures which are computed from them, and thus could result in less realistic user behavior. In this work, the true user action is treated as a hidden variable and, further, its associated dialog history is also viewed as latent so that the uncertainty of the true user action is properly controlled in a principled manner. Syed and Williams (2008) adopted theExpectation Max-imizationalgorithm for parameter learning for a la-tent variable model. But their method still requires a small amount of transcribed data to learn the obser-vation confusability, and it suffers from overfitting as a general property of maximum likelihood. To address this problem, we propose a Bayesian learn-ing method, which requires no transcribed data.
3 Unsupervised Approach to User Simulation
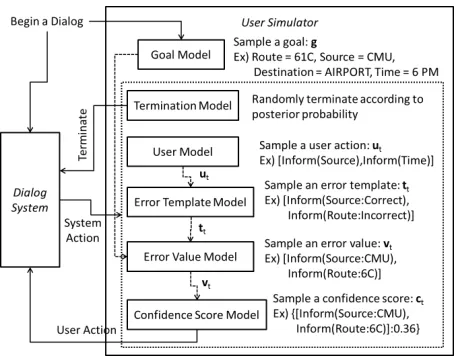
[image:2.612.313.541.55.233.2]Before describing each component in detail, we present the overall process of user simulation with an example in the Let’s Go domain in Figure 1. To begin a dialog, the user simulator first sets the user
Figure 1: The overall process of user simulation in the Let’s Go domain, where users call the spoken dialog sys-tem to get bus schedule information for Pittsburgh
goal by sampling the goal model. Then the user sim-ulator engages in a conversation with the dialog sys-tem until the termination model ends it. At each turn, the termination model randomly determines whether the dialog will continue or not. If the dia-log continues, the user model generates user actions at the predicate level with respect to the given user goal and system action. Having the user actions, the error template model transforms some user actions into other actions if necessary and determines which action will receive an incorrect value. After that, the error value model substantiates the values by draw-ing a confusable value if specified to be incorrect or by using the goal value. Finally, a confidence score will be attached to the user action by sampling the confidence score model which conditions on the cor-rectness of the final user action.
3.1 Goal Model
The goal model is the first component to be de-fined in terms of the working flow of the user sim-ulator. In order to generate a plausible user goal in accordance with the frequency at which it ap-pears in a real situation, the dialog logs are parsed to look for the grounding information1that the users have provided. Since the representation of a user goal in this study is a vector of constraints required by a user, for example [Route:61C, Source:CMU, 1Specifically, we used explicitly confirmed information by
Destination:AIRPORT, Time:6 PM], each time we encounter grounding information that includes the constraints used in the backend queries, this is added to the user goal. If two actions contradict each other, the later action overwrites the earlier one. Once all of the user goals in the data have been gathered, a discrete distribution over the user goal is learned using a maximum likelihood estimation. Because many variables later in this paper are discrete, a gen-eral notation of a conditional discrete distribution is expressed as follows:
p(xi|xpa(i),θ) =
Y
k,k0
θkδ(,kpa0(i),k)δ(xi,k0) (1)
wherekrepresents the joint configuration of all the
parents ofiandδ(·,·)denotesKroneckerdelta. Note that Pk0θk,k0 = 1. Given this notation, the goal
modelΛcan be written in the following form:
g∼p(g|Λ) =Y k
λδk(g,k) (2)
3.2 User Model
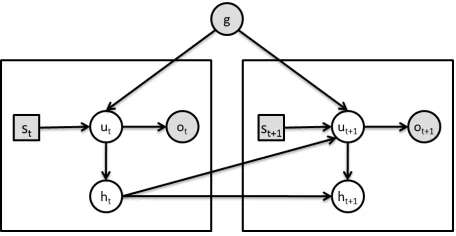
Having generated a user goal, the next task is to infer an appropriate user action for the given goal and sys-tem action. This is what the user model does. Since one of key properties of our unsupervised approach is that the true user actions are not observable, the user model should maintain a belief over the dia-log state by taking into consideration the observed user actions. Inspired by (Williams et al., 2005), to keep the complexity of the user model tractable, a dynamic Bayesian network is adopted with sev-eral conditional independence assumptions, giving rise to the graphical structure which is shown in Fig-ure 2. Unlike belief tracking in a dialog system, the user goal in a user simulation is pre-determined be-fore the beginning of the dialog. As with most pre-vious studies, this property allows the user model to deal with a predicate-level action consisting of a speech act and a concept (e.g. [Inform(Source), In-form(Time)]) and is only concerned about whether a given field is specified or not in the user goal (e.g.
Bus:Unspecified, Source:Specified). This abstract-level handling enables the user model to employ ex-act inference algorithms such as the junction tree
algorithm (Lauritzen and Spiegelhalter, 1988) for more efficient reasoning over the graphical structure.
Figure 2: The graphical structure of the dynamic Bayesian network for the user model.gdenotes the user goal andst,ut,ht,ot represents the system action, the
user action, the dialog history, and the observed user ac-tion for each time slice, respectively. The shaded items are observable and the transparent ones are latent.
The joint distribution for this model is given by
p(g,S,H,U,O|Θ)
=p(h0|π)Y t
p(ut|g,st,ht−1,φ)
·p(ht|ht−1,ut,η)p(ot|ut,ζ)
(3)
where a capital letter stands for the set of corresponding random variables, e.g., U =
{u1, . . . ,uN}, and Θ = {π,φ,η,ζ} denotes the set of parameters governing the model2.
For a given user goal, the user model basically performs an inference to obtain a marginal distribu-tion over ut for each time step from which it can sample the probability of a user action in a given context:
ut∼p(ut|g,st1,ut1−1,Θ) (4)
wherest
1denotes the set of system actions from time
1to timetandut1−1is the set of previously sampled
user actions from time1to timet−1.
3.2.1 Parameter Estimation
As far as parameters are concerned,ζis a determin-istic function that yields a fraction of an observed confidence score in accordance with the degree of agreement betweenutandot:
p(ot|ut) =CS(ot)·
|ot∩ut|
|ot∪ut|
p
+ (5)
[image:3.612.313.541.57.175.2]whereCS(·)returns the confidence score of the as-sociated observation andpis a control variable over the strength of disagreement penalty3. In addition,π andηare deterministically set by simple discourse rules, for example:
p(ht=Informed|ht−1,ut) =
(
1 ifht−1=Informedorut=Inform(·), 0 otherwise.
(6)
The only parameter that needs to be learned in the user model, therefore, isφand it can be estimated by maximizing the likelihood function (Equation 7). The likelihood function is obtained from the joint distribution (Equation 3) by marginalizing over the latent variables.
p(g,S,O|Θ) =X
H,U
p(g,S,H,U,O|Θ) (7)
Since direct maximization of the likelihood func-tion will lead to complex expressions with no closed-form solutions due to the latent variables, the
Expectation-Maximization(EM) algorithm is an ef-ficient framework for finding maximum likelihood estimates.
As it is well acknowledged, however, that over-fitting can arise as a general property of maximum likelihood, especially when only a small amount of data is available, a Bayesianapproach needs to be adopted. In a Bayesian model, any unknown pa-rameter is given a prior distribution and is absorbed into the set of latent variables, thus it is infeasible to directly evaluate the posterior distribution of the latent variables and the expectations with respect to this distribution. Therefore a deterministic approx-imation, called mean field theory (Parisi, 1988), is applied.
Inmean fieldtheory, the family of posterior distri-butions of the latent variables is assumed to be par-titioned into disjoint groups:
q(Z) = M
Y
i=1
qi(Zi) (8)
whereZ={z1, . . . ,zN}denotes all latent variables including parameters and Zi is a disjoint group.
3For this study,pwas set to1.0
Amongst all distributions q(Z) having the form of Equation 8, we then seek the member of this family for which the divergence from the true posterior dis-tribution is minimized. To achieve this, the follow-ing optimization with respect to each of theqi(Zi) factors is to be performed in turn (Bishop, 2006):
lnqj∗(Zj) =Ei6=jlnp(X,Z)+const (9)
whereX={x1, . . . ,xN}denotes all observed vari-ables andEi6=jmeans an expectation with respect to theqdistributions over all groupsZifori6=j.
Now, we apply the mean fieldtheory to the user model. Before doing so, we need to introduce the prior over the parameter φ which is a product of
Dirichletdistributions4. p(φ) =Y
k
Dir(φk|α0k)
=Y
k
C(α0k)Y l
φα0k−1
k,l
(10)
wherekrepresents the joint configuration of all of the parents andC(α0k)is the normalization constant for theDirichletdistribution. Note that for symme-try we have chosen the same parameterα0
kfor each
of the components.
Next we approximate the posterior distribution, q(H,U,φ) using a factorized form, q(H,U)q(φ). Then we first apply Equation 9 to find an expression for the optimal factorq∗(φ):
lnq∗(φ) =EH,Ulnp(g,S,H,U,O,Θ)+const
=EH,U
X
t
lnp(ut|g,st,ht−1,φ)
+ lnp(φ) +const
=X t
X
i,j,k,l
EH,Uδi,j,k,llnφi,j,k,l
+ X i,j,k,l
(αoi,j,k,l−1) lnφi,j,k,l+const
= X i,j,k,l
EH,U[ni,j,k,l] + (αoi,j,k,l−1)
·lnφi,j,k,l
+const
(11)
4Note that priors over parameters for deterministic
where δi,j,k,l denotes δ(g, i)δ(st, j)δ(ht−1, k)
δ(ut, l) and ni,j,k,l is the number of times where
g = i,st = j,ht−1 = k, andut = l. This leads to a product ofDirichletdistributions by taking the exponential of both sides of the equation:
q∗(φ) =Y i,j,k
Dir(φi,j,k|αi,j,k),
αi,j,k,l=α0i,j,k,l+EH,U[ni,j,k,l] (12)
To evaluate the quantityEH,U[ni,j,k,l], Equation 9 needs to be applied once again to obtain an op-timal approximation of the posterior distribution q∗(H,U).
lnq∗(H,U) =Eφlnp(g,S,H,U,O,Θ)+const
=Eφ X
t
lnp(ut|g,st,ht−1,φ)
+ lnp(ht|ht−1,ut)
+ lnp(ot|ut)
+const
=X t
Eφ
lnp(ut|g,st,ht−1,φ)
+ lnp(ht|ht−1,ut)
+ lnp(ot|ut)
+const
(13)
where Eφlnp(ut|g,st,ht−1,φ) can be obtained
using Equation 12 and properties of the Dirichlet
distribution:
Eφ
lnp(ut|g,st,ht−1,φ)
= X i,j,k,l
δi,j,k,lEφlnφi,j,k,l
= X i,j,k,l
δi,j,k,l(ψ(αi,j,k,l)−ψ( ˆαi,j,k)) (14)
where ψ(·) is the digamma function withαˆi,j,k =
P
lαi,j,k,l. Because computing EH,U[ni,j,k,l] is equivalent to summing each of the marginal poste-rior probabilities q∗(ht−1,ut) with the same con-figuration of conditioning variables, this can be done efficiently by using thejunction treealgorithm. Note that the expression on the right-hand side for bothq∗(φ)andq∗(H,U) depends on expectations
computed with respect to the other factors. We will therefore seek a consistent solution by cycling through the factors and replacing each in turn with a revised estimate.
3.3 Error Model
The purpose of the error model is to alter the user action to reflect the prevalent speech recognition and understanding errors. The error generation process consists of three steps: the error model first gen-erates an error template then fills it with erroneous values, and finally attaches a confidence score.
Given a user action, the error model maps it into a distorted form according to the probability distribu-tion of the error template modelΩ:
T(u)∼p(T(u)|u) =Y k,k0
ωk,kδ(u,k0 )δ(T(u),k0) (15)
whereT(·)is a random function that maps a pred-icate of the user action to an error template, e.g.
T(Inform(Time)) → Inform(Route:incorrect). To learn the parameters, the hidden variableutis sam-pled using Equation 4 for each observationotin the training data and the value part of each observation is replaced with a binary value representing its cor-rectness with respect to the user goal. This results in a set of complete data on which the maximum like-lihood estimates ofΩare learned.
With the error template provided, next, the error model fills it with incorrect values if necessary fol-lowing the distribution of the error value model Λ
which is separately defined for each concept, other-wise it will keep the correct value:
C(v)∼p(C(v)|v) =Y k,k0
λδ(v,k)δ(C(v),k0) (16)
whereC(·)is a random function which maps a cor-rect value to a confusable value, e.g. C(Forbes) → Forward. As with the error template model, the pa-rameters of the error value model are also easily trained on the dataset of all pairs of a user goal value and the associated observed value. Because no er-ror values can be observed for a given goal value, an unconditional probability distribution is also trained as a backoff.
which is separately defined for each concept:
s∼p(s|c) =Y k,k0
γδ(c,k)δ(s,k0) (17)
where sdenotes the confidence score and c repre-sents the correctness of the value of the user action which is previously determined by the error tem-plate model. Since two decimal places are used to describe the confidence score, the confidence score model is represented with a discrete distribution. This lends itself to trivial parameter learning similar to other models by computing maximum likelihood estimates on the set of observed confidence scores conditioned on the correctness of the relevant val-ues.
In sum, for example, having a user action
[Inform(Source:Forbes), Inform(Time:6 PM)] go through the sequence of aforementioned models possibly leads to [Inform(Source:Forward), In-form(Route:6C)].
3.4 Termination Model
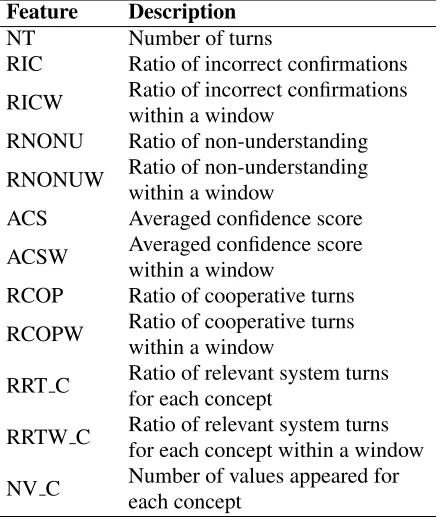
Few studies have been conducted to estimate the probability that a dialog will terminate at a certain turn in the user simulation. Most existing work attempts to treat a termination initiated by a user as one of the dialog actions in their user models. These models usually have a limited dialog history that they can use to determine the next user action. This Markovassumption is well-suited to ordinary dialog actions, each generally showing a correspon-dence with previous dialog actions. It is not diffi-cult, however, to see that more global contexts (e.g., cumulative number of incorrect confirmations) will help lead a user to terminate a failed dialog. In ad-dition, the termination action occurs only once at the end of a dialog unlike the other actions. Thus, we do not need to put the termination action into the user model. In order to easily incorporate many global features involving an entire dialog (Table 1) into the termination model, the logistic regression
model is adapted. At every turn, before getting into the user model, we randomly determine whether a dialog will stop according to the posterior probabil-ity of the termination model given the current dialog context.
Feature Description
NT Number of turns
RIC Ratio of incorrect confirmations RICW Ratio of incorrect confirmationswithin a window RNONU Ratio of non-understanding RNONUW Ratio of non-understandingwithin a window ACS Averaged confidence score ACSW Averaged confidence scorewithin a window RCOP Ratio of cooperative turns RCOPW Ratio of cooperative turnswithin a window
RRT C Ratio of relevant system turnsfor each concept
RRTW C Ratio of relevant system turnsfor each concept within a window
[image:6.612.319.539.58.318.2]NV C Number of values appeared foreach concept
Table 1: A description of features used for a logistic regression model to capture the termination probability. The window size was set to 5 for this study.
4 Experimental Setup
4.1 Data
To verify the proposed method, three months of data from the Let’s Go domain were split into two months of training data and one month of test data. Also, to take the error level into consideration, we classi-fied the data into four groups according to the aver-aged confidence score and used each group of data to build a different error model for each error level. For comparison purposes, simulated data was gen-erated for both training and test data by feeding the same context of each piece of data to the proposed method. Due to the characteristics of the bus sched-ule information domain, there are a number of cases where no bus schedule is available, such as requests for uncovered routes and places. Such cases were excluded for clearer interpretation of the result, giv-ing us the data sets described in Table 2.
4.2 Measures
Training data Test data Number of dialogs 1,275 669
[image:7.612.315.536.55.115.2]Number of turns 9,645 5,103
Table 2: A description of experimental data sets.
Hastie, 2011; Schatzmann et al., 2005; Williams, 2007a). Nevertheless, it remains difficult to find a suitable set of evaluation measures to assess the quality of the user simulation. We have chosen to adopt a set of the most commonly used mea-sures. Firstly, expected precision (EP), expected re-call (ER) and F-Score offer a reliable method for comparing real and simulated data even though it is not possible to specify the levels that need to be satisfied to conclude that the simulation is realistic. These are computed by comparison of the simulated and real user action for each turn in the corpus:
EP= 100∗ Number of simulated actionsNumber of identical actions (18)
ER= 100∗Number of identical actions
Number of real actions (19)
F-Score= 100∗ 2EP∗EP∗ER
+ER (20) Next, several descriptive statistics are employed to show the closeness of the real and simulated data in a statistical sense. The distribution of different user action types, turn length and confidence score can show constitutional similarity. It is still possible, however, to be greatly different in their interdepen-dence and cause quite different behavior at the dia-log level even though there is a constitutional sim-ilarity. Therefore, the dialog-level statistics such as dialog completion rate and averaged dialog length were also computed by running the user simulator with the Let’s Go dialog system.
5 Results
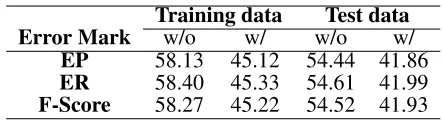
As mentioned in Section 4.2, expected precision and recall were measured. Whereas previous studies only reported the scores computed in the predicate level, i.e. speech act and concept, we also measured the scores based on the output of the error template model which is the predicate-level action with an indicator of the correctness of the associated value (Figure 1). The result (Table 3) shows a moderate
Training data Test data Error Mark w/o w/ w/o w/
EP 58.13 45.12 54.44 41.86
ER 58.40 45.33 54.61 41.99
F-Score 58.27 45.22 54.52 41.93
Table 3: Expected precision, expected recall and F-Score
balance between agreement and variation which is a very desirable characteristic of a user simulator since a simulated user is expected not only to resem-ble real data but also to cover diverse unseen behav-ior to a reasonable extent. As a natural consequence of the increased degree of freedom, the scores con-sidering error marking are consistently lower. In ad-dition, the results of test data are slightly lower than those of training data, as expected, yet a suitable bal-ance remains.
Next, the comparative distributions of different actions between real and simulated data are pre-sented for both training and test data (Figure 3). The results are also based on the output of the er-ror template model to further show how erer-rors are distributed over different actions. The distributions of simulated data either from training or test data show a close match to the corresponding real dis-tributions. Interestingly, even though the error ratio of the test data is noticeably different from that of the training data, the proposed method is still able to generate similar results. This means the vari-ables and their conditional probabilities of the pro-posed method were designed and estimated properly enough to capture the tendency of user behavior with respect to various dialog contexts. Moreover, the comparison of the turn length distribution (Figure 4) indicates that the simulated data successfully repli-cated the real data for both training and test data. The results of confidence score simulation are pre-sented in Figure 55. For both training and test data, the simulated confidence score displays forms that are very similar to the real ones.
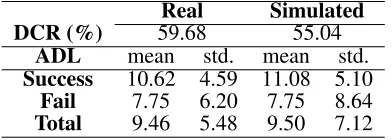
Finally, to confirm the resemblance on the dialog level, the comparative results of dialog completion rate and averaged dialog length are summarized in Table 4. As shown in the dialog completion result, the simulated user is a little harder than the real user
5Due to the space limitation, the detailed illustrations for
Figure 3: A comparison of the distribution of different actions between real and simulated data for both training and test data
Figure 4: A comparison of the distribution of turn length between real and simulated data for both training and test data
to accomplish the purpose. Also, the variation of the simulated data as far as turn length is concerned was greater than that of the real data, although the aver-aged lengths were similar to each other. This might indicate the need to improve the termination model. The proposed method for the termination model is confined to incorporating only semantic-level fea-tures but a variety of different feafea-tures would, of course, cause the end of a dialog, e.g. system de-lay, acoustic features, spatial and temporal context, weather and user groups.
6 Conclusion
[image:8.612.82.295.57.274.2]In this paper, we presented a novel unsupervised ap-proach for user simulation which is especially de-sirable for real deployed systems. The proposed
Figure 5: A comparison of the distribution of confidence score between real and simulated data for both training and test data
Real Simulated DCR (%) 59.68 55.04
ADL mean std. mean std.
Success 10.62 4.59 11.08 5.10
Fail 7.75 6.20 7.75 8.64
Total 9.46 5.48 9.50 7.12
Table 4: A comparison of dialog completion rate (DCR) and averaged dialog length (ADL) which is presented ac-cording to the dialog result.
[image:8.612.330.526.331.401.2] [image:8.612.88.298.338.418.2]Acknowledgments
We would like to thank Alan Black for helpful com-ments and discussion. This work was supported by the second Brain Korea 21 project.
References
C. Bishop, 2006. Pattern Recognition and Machine Learning. Springer.
G. Chung, 2004. Developing a Flexible Spoken Dialog System Using Simulation.In Proceedings of ACL. H. Cuayahuitl, S. Renals, O. Lemon, H. Shimodaira,
2005. Humancomputer dialogue simulation using hid-den Markov models. In Proceedings of ASRU. W. Eckert, E. Levin, R. Pieraccini, 1997. User modeling
for spoken dialogue system evaluation. In Proceed-ings of ASRU.
K. Georgila, J. Henderson, O. Lemon, 2006. User simu-lation for spoken dialogue systems: Learning and eval-uation. In Proceedings of Interspeech.
J. Henderson, O. Lemon, K. Georgila, 2008. Hybrid Re-inforcement / Supervised Learning of Dialogue Poli-cies from Fixed Datasets. Computational Linguistics, 34(4):487-511
S. Jung, C. Lee, K. Kim, M. Jeong, G. Lee, 2009. Data-driven user simulation for automated evaluation of spoken dialog systems. Computer Speech and Lan-guage, 23(4):479–509.
S. Lauritzen and D. J. Spiegelhalter, 1988. Local Com-putation and Probabilities on Graphical Structures and their Applications to Expert Systems. Journal of Royal Statistical Society, 50(2):157–224.
E. Levin, R. Pieraccini, W. Eckert, 2000. A stochastic model of humanmachine interaction for learning di-alogstrategies. IEEE Transactions on Speech and Au-dio Processing, 8(1):11-23.
R. Lopez-Cozar, Z. Callejas, and M. McTear, 2006. Test-ing the performance of spoken dialogue systems by means of an articially simulated user. Articial Intel-ligence Review, 26(4):291-323.
G. Parisi, 1988. Statistical Field Theory. Addison-Wesley.
O. Pietquin, 2004. A Framework for Unsupervised Learning of Dialogue Strategies. Ph.D. thesis, Faculty of Engineering.
O. Pietquin and H. Hastie, 2011. A survey on metrics for the evaluation of user simulations. The Knowledge Engineering Review.
A. Raux, B. Langner, D. Bohus, A. W Black, and M. Eskenazi, 2005. Let’s Go Public! Taking a Spoken Dialog System to the Real World. In Proceedings of Interspeech.
J. Schatzmann, K. Georgila, S. Young, 2005. Quantita-tive evaluation of user simulation techniques for spo-ken dialogue systems. In Proceedings of SIGdial. J. Schatzmann, B. Thomson, K. Weilhammer, H. Ye, S.
Young, 2007. Agenda-based user simulation for boot-strapping a POMDP dialogue system. In Proceedings of HLT/NAACL.
J. Schatzmann, B. Thomson, S. Young, 2007. Error simulation for training statistical dialogue systems. In Proceedings of ASRU.
U. Syed and J. Williams, 2008. Using automatically transcribed dialogs to learn user models in a spoken dialog system. In Proceedings of ACL.
B. Thomson and S. Young, 2010. Bayesian update of dialogue state: A POMDP framework for spoken dialogue systems. Computer Speech & Language, 24(4):562-588.
J. Williams, P. Poupart, and S. Young, 2005. Factored Partially Observable Markov Decision Processes for Dialogue Management. In Proceedings of Knowledge and Reasoning in Practical Dialogue Systems. J. Williams, 2007. A Method for Evaluating and
Com-paring User Simulations: The Cramer-von Mises Di-vergence. In Proceedings of ASRU.
J. Williams and S. Young, 2007. Partially observable Markov decision processes for spoken dialog systems.
Appendices
[image:10.612.96.507.125.317.2]Appendix A. Distribution of confidence score for each concept
Figure 6: A comparison of the distribution of confidence score between real and simulated data for the training data
[image:10.612.95.508.386.581.2]