Automating Second Language Acquisition Research:
Integrating Information Visualisation and Machine Learning
Helen Yannakoudakis Computer Laboratory University of Cambridge
United Kingdom
Ted Briscoe Computer Laboratory University of Cambridge
United Kingdom [email protected]
Theodora Alexopoulou DTAL
University of Cambridge United Kingdom
Abstract
We demonstrate how data-driven ap-proaches to learner corpora can support Second Language Acquisition research when integrated with visualisation tools. We present a visual user interface support-ing the investigation of a set of lsupport-inguistic features discriminating between pass and fail ‘English as a Second or Other Lan-guage’ exam scripts. The system displays directed graphs to model interactions between features and supports exploratory search over a set of learner scripts. We illustrate how the interface can support the investigation of the co-occurrence of many individual features, and discuss how such investigations can shed light on understanding the linguistic abilities that characterise different levels of attainment and, more generally, developmental aspects of learner grammars.
1 Introduction
The Common European Framework of Reference for Languages (CEFR)1is an international bench-mark of language attainment at different stages of learning. The English Profile (EP)2research pro-gramme aims to enhance the learning, teaching and assessment of English as an additional lan-guage by creating detailed reference level descrip-tions of the language abilities expected at each level. As part of our research within that frame-work, we modify and combine techniques devel-oped for information visualisation with method-ologies from computational linguistics to support a novel and more empirical perspective on CEFR
1
http://www.coe.int/t/dg4/linguistic/cadre en.asp 2
http://www.englishprofile.org/
levels. In particular, we build a visual user in-terface (hereafter UI) which aids the develop-ment of hypotheses about learner grammars us-ing graphs of lus-inguistic features discriminatus-ing pass/fail exam scripts for intermediate English.
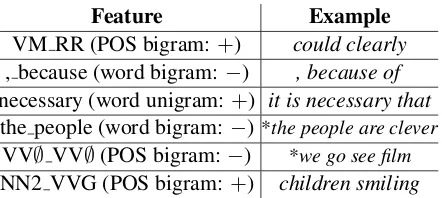
Briscoe et al. (2010) use supervised discrimi-native machine learning methods to automate the assessment of ‘English as a Second or Other Lan-guage’ (ESOL) exam scripts, and in particular, the First Certificate in English (FCE) exam, which assesses English at an upper-intermediate level (CEFR level B2). They use a binary discrimina-tive classifier to learn a linear threshold function that best discriminates passing from failing FCE scripts, and predict whether a script can be sified as such. To facilitate learning of the clas-sification function, the data should be represented appropriately with the most relevant set of (lin-guistic) features. They found a discriminative fea-ture set includes, among other feafea-ture types, lexi-cal and part-of-speech (POS) ngrams. We extract the discriminative instances of these two feature types and focus on their linguistic analysis3. Ta-ble 1 presents a small subset ordered by discrimi-native weight.
The investigation of discriminative features can offer insights into assessment and into the linguis-tic properties characterising the relevant CEFR level. However, the amount and variety of data potentially made available by the classifier is con-siderable, as it typically finds hundreds of thou-sands of discriminative feature instances. Even if investigation is restricted to the most discrim-inative ones, calculations of relationships
be-3
Briscoe et al. (2010) POS tagged and parsed the data using the RASP toolkit (Briscoe et al., 2006). POS tags are based on the CLAWS tagset.
tween features can rapidly grow and become over-whelming. Discriminative features typically cap-ture relatively low-level, specific and local prop-erties of texts, so features need to be linked to the scripts they appear in to allow investigation of the contexts in which they occur. The scripts, in turn, need to be searched for further linguistic prop-erties in order to formulate and evaluate higher-level, more general and comprehensible hypothe-ses which can inform reference level descriptions and understanding of learner grammars.
The appeal of information visualisation is to gain a deeper understanding of important phe-nomena that are represented in a database (Card et al., 1999) by making it possible to navigate large amounts of data for formulating and testing hy-potheses faster, intuitively, and with relative ease. An important challenge is to identify and assess the usefulness of the enormous number of pro-jections that can potentially be visualised. Explo-ration of (large) databases can lead quickly to nu-merous possible research directions; lack of good tools often slows down the process of identifying the most productive paths to pursue.
In our context, we require a tool that visu-alises features flexibly, supports interactive inves-tigation of scripts instantiating them, and allows statistics about scripts, such as the co-occurrence of features or presence of other linguistic proper-ties, to be derived quickly. One of the advantages of using visualisation techniques over command-line database search tools is that Second Lan-guage Acquisition (SLA) researchers and related users, such as assessors and teachers, can access scripts, associated features and annotation intu-itively without the need to learn query language syntax.
We modify previously-developed visualisation techniques (Di Battista et al., 1999) and build a visual UI supporting hypothesis formation about learner grammars. Features are grouped in terms of their co-occurrence in the corpus and directed graphs are used in order to illustrate their rela-tionships. Selection of different feature combi-nations automatically generates queries over the data and returns the relevant scripts as well as as-sociations with meta-data and different types of errors committed by the learners4. In the next
sec-4
Our interface integrates a command-line Lucene search tool (Gospodnetic and Hatcher, 2004) developed by Gram and Buttery (2009).
Feature Example
VM RR (POS bigram:+) could clearly
, because (word bigram:−) , because of
necessary (word unigram:+) it is necessary that
the people (word bigram:−) *the people are clever
VV∅ VV∅(POS bigram: −) *we go see film
[image:2.595.306.527.70.169.2]NN2 VVG (POS bigram: +) children smiling
Table 1: Subset of features ordered by discriminative weight; +and −show their association with either passing or failing scripts.
tions we describe in detail the visualiser, illustrate how it can support the investigation of individual features, and discuss how such investigations can shed light on the relationships between features and developmental aspects of learner grammars.
To the best of our knowledge, this is the first attempt to visually analyse as well as perform a linguistic interpretation of discriminative fea-tures that characterise learner English. We also apply our visualiser to a set of 1,244 publically-available FCE ESOL texts (Yannakoudakis et al., 2011) and make it available as a web service to other researchers5.
2 Dataset
We use texts produced by candidates taking the FCE exam, which assesses English at an upper-intermediate level. The FCE texts, which are part of the Cambridge Learner Corpus6, are pro-duced by English language learners from around the world sitting Cambridge Assessment’s ESOL examinations7. The texts are manually tagged with information about linguistic errors (Nicholls, 2003) and linked to meta-data about the learners (e.g., age and native language) and the exam (e.g., grade).
3 The English Profile visualiser
3.1 Basic structure and front-end
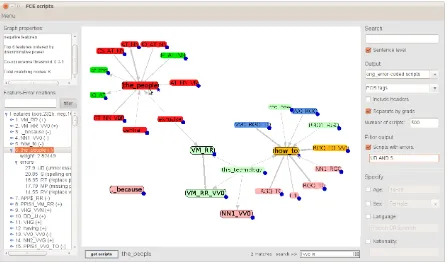
The English Profile (EP) visualiser is developed in Java and uses the Prefuse library (Heer et al., 2005) for the visual components. Figure 1 shows its front-end. Features are represented
5Available by request: http://ilexir.co.uk/applications/ep-visualiser/
6
http://www.cup.cam.ac.uk/gb/elt/catalogue/subject/ custom/item3646603/
7
Figure 1: Front-end of the EP visualiser.
by a labelled node and displayed in the central panel; positive features (i.e., those associated with passing the exam) are shaded in a light green colour while negative ones are light red8. A field at the bottom right supports searching for fea-tures/nodes that start with specified characters and highlighting them in blue. An important aspect is the display of feature patterns, discussed in more detail in the next section (3.2).
3.2 Feature relations
Crucial to understanding discriminative features is finding the relationships that hold between them. We calculate co-occurrences of features at the sentence-level in order to extract ‘meaningful’ relations and possible patterns of use. Combi-nations of features that may be ‘useful’ are kept while the rest are discarded. ‘Usefulness’ is mea-sured as follows:
Consider the set of all the sentences in the cor-pusS={s1, s2, ..., sN}and the set of all the
fea-turesF = {f1, f2, ..., fM}. A featurefi ∈ F is
associated with a feature fj ∈ F, where i 6= j
and1 ≤i, j ≤M, if their relative co-occurrence score is within a predefined range:
score(fj, fi) = PN
k=1exists(fj, fi, sk) PN
k=1exists(fi, sk)
(1)
8
Colours can be customised by the user.
where sk ∈ S, 1 ≤ k ≤ N, exists() is a
binary function that returns 1 if the input fea-tures occur in sk, and 0 ≤ score(fj, fi) ≤ 1.
We group features in terms of their relative co-occurrence within sentences in the corpus and dis-play these co-occurrence relationships as directed graphs. Two nodes (features) are connected by an edge if their score, based on Equation (1), is within a user-defined range (see example below). Givenfiandfj, the outgoing edges offiare
mod-elled using score(fj, fi)and the incoming edges
using score(fi, fj). Feature relations are shown
via highlighting of features when the user hovers the cursor over them, while the strength of the re-lations is visually encoded in the edge width.
syntactic environments of the feature (i) or its characteristic lexicalisations (ii).
3.3 Dynamic creation of graphs via selection criteria
Questions relating to a graph display may include information about the most connected nodes, sep-arate components of the graph, types of intercon-nected features, etc. However, the functionality, usability and tractability of graphs is severely lim-ited when the number of nodes and edges grows by more than a few dozen (Fry, 2007). In order to provide adequate information, but at the same time avoid overly complex graphs, we support dy-namic creation and visualisation of graphs using a variety of selection criteria. The EP visualiser supports the flexible investigation of the top 4,000 discriminative features and their relations.
TheMenuitem on the top left of the UI in Fig-ure 1 activates a panel that enables users to select the topN features to be displayed. The user can choose whether to display positive and/or neg-ative features and set thresholds for, as well as rank by discriminative weight, connectivity with other features (i.e., the number of features it is connected to), and frequency. For instance, a user can choose to investigate features that have a connectivity between 500 and 900, rank them by frequency and display the top 100. Highly-connected features might tell us something about the learner grammar while infrequent features, al-though discriminative, might not lead to useful linguistic insights. Additionally, users can in-vestigate feature relations and set different score ranges according to Equation (1), which controls the edges to be displayed.
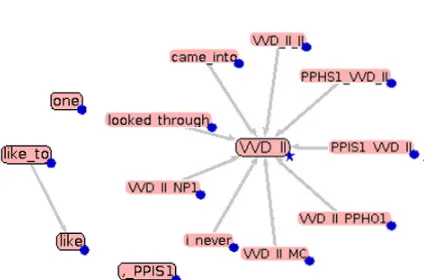
Figure 2(a) presents the graph of the 5 most frequent negative features, using a score range of 0.8–1. The system displays only one edge, while the rest of the features are isolated. How-ever, these features might be related to other fea-tures from the list of 4,000 (which are not dis-played since they are not found in the top N
list of features). Blue aggregation markers in the shape of a circle, located at the bottom right of each node, are used to visually display that in-formation. When a node with an aggregation marker is selected, the system automatically ex-pands the graph and displays the related features. The marker shape of an expanded node changes to a star, while a different border stroke pattern
(a) Graph of the top 5 most fre-quent negative features using a score range of 0.8–1.
[image:4.595.308.521.188.328.2](b) Expanded graph when the aggregation marker for the feature VVD II is selected.
Figure 2: Dynamic graph creation.
is used to visually distinguish the revealed nodes from the top N. Figure 2(b) presents the ex-panded graph when the aggregation marker for the feature VVD II is selected. If the same aggrega-tion marker is selected twice, the graph collapses and returns to its original form.
3.4 Feature–Error relations
The FCE texts have been manually error-coded (Nicholls, 2003) so it is possible to find associa-tions between discriminative features and specific error types. TheFeature–Error relations compo-nent on the left of Figure 1 displays a list of the features, ranked by their discriminative weight, together with statistics on their relations with er-rors. Feature–error relations are computed at the sentence level by calculating the proportion of sentences containing a feature that also contain a specific error (similar to Equation (1)). In the example in Figure 1, we see that 27% of the sen-tences that contain the feature bigram the people also have an unnecessary determiner (UD) error, while 14% have a replace verb (RV) error9.
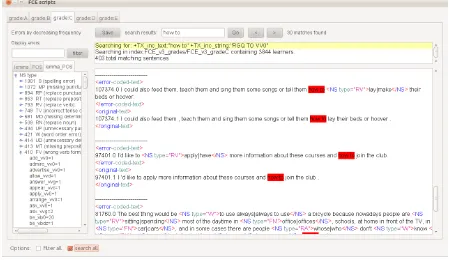
Figure 3: Sentences, split by grade, containing occurrences of how to and RGQ TO VV∅. The list on the left gives error frequencies for the matching scripts, including the frequencies of lemmata and POSs inside an error.
3.5 Searching the data
In order to allow the user to explore how fea-tures are related to the data, the EP visualiser supports browsing operations. Selecting multiple features – highlighted in yellow – and clicking on the button get scriptsreturns relevant scripts. The right panel of the front-end in Figure 1 dis-plays a number of search and output options. Users can choose to output the original/error-coded/POS-tagged text and/or the grammatical relations found by the RASP parser (Briscoe et al., 2006), while different colours are used in or-der to help readability. Data can be retrieved at the sentence or script level and separated accord-ing to grade. Additionally, Boolean queries can be executed in order to examine occurrences of (se-lected features and) specific errors only10. Also, users can investigate scripts based on meta-data information such as learner age.
Figure 3 shows the display of the system when the features how to and RGQ TO VV∅ (how to
followed by a verb in base form) are selected. The text area in the centre displays sentences instanti-ating them. A search box at the top supports
nav-10
For example, users can activate theScripts with errors: option and type ‘R OR W’. This will return sentences con-taining replace or word order errors.
igation, highlighting search terms in red, while a small text area underneath displays the current search query, the size of the database and the num-ber of matching scripts or sentences. TheErrors by decreasing frequency pane on the left shows a list of the errors found in the matching scripts, ordered by decreasing frequency. Three different tabs (lemma, POS and lemma POS) provide in-formation about and allow extraction of counts of lemmata and POSs inside an error tag.
3.6 Learner native language
Research on SLA highlights the possible effect of a native language (L1) on the learning process. Using the Menu item on the top left corner of Figure 1, users can select the language of inter-est while the system displays a new window with an identical front-end and functionality. Feature– error statistics are now displayed per L1, while selecting multiple features returns scripts written by learners speaking the chosen L1.
4 Interpreting discriminative features: a case study
the 18th most discriminative (negative) feature. It corresponds to a sequence of a degree adverb fol-lowed by an adjective and a singular noun as in
very good boy. The question is why such a fea-ture is negative since the string is not ungrammat-ical. Visualisation of this feature using the ‘dy-namic graph creation’ component of the visualiser allows us to see the features it is related to. This offers an intuitive and manageable way of inves-tigating the large number of underlying discrimi-native features.
We find that RG JJ NN1 is related to its dis-criminative lexicalisation, very good (−), which is the 513th most discriminative feature. Also, it is related to JJ NN1 II (−) (e.g.,difficult sport at), ranked 2,700th, which suggests a particular context for RG JJ NN1 when the noun is fol-lowed by a preposition. Searching for this con-junction of features in scripts, we get production examples like1a,b,c. Perhaps more interestingly, RG JJ NN1 is related to VBZ RG (−) (ranked 243rd): is followed by a degree adverb. This relation suggests a link with predicative struc-tures since putting the two ngrams together yields strings VBZ RG JJ NN1 corresponding to exam-ples like1c,d; if we also add II we get examples like1c.
1a It might seem to bevery difficult sport atthe beginning.
1b We know a lot aboutvery difficult situation inyour country.
1c I think it’s very good idea tospending vaca-tion together.
1d Unixis very powerful systembut there is one thing against it.
The associations between features already give an idea of the source of the problem. In the se-quences including the verb be the indefinite ar-ticle is omitted. So the next thing to investigate is if indeed RG JJ NN1 is associated with ar-ticle omission, not only in predicative contexts, but more generally. TheFeature–Error relations
component of the UI reveals an association with MD (missing determiner) errors: 23% of sen-tences that contain RG JJ NN1 also have a MD error. The same holds for very good, JJ NN1 II and VBZ RG with percentages 12%, 14% and
Language f1 f2 f3 f4
[image:6.595.321.508.70.225.2]all 0.26 0.40 0.02 0.03 Turkish 0.29 0.48 0.04 0.03 Japanese 0.17 0.39 0.02 0.02 Korean 0.30 0.58 0.06 0.03 Russian 0.35 0.52 0.03 0.03 Chinese 0.25 0.56 0.02 0.03 French 0.21 0.41 0.00 0.03 German 0.19 0.41 0.00 0.02 Spanish 0.27 0.32 0.00 0.03 Greek 0.30 0.35 0.02 0.02
Table 2:f1/2/3/4:doc ratios for different L1s.
15% respectively. We then compared the num-ber of MD errors per script across different types of scripts. Across all scripts the ratio MD:doc is 2.18, that is, approximately 2 MD errors per script; in RG JJ NN1 scripts this ratio goes up to 2.75, so that each script has roughly 3 MD errors. VBZ RG follows with 2.68, JJ NN1 II with 2.48, and very good with 2.32. In scripts containing all features the ratio goes up to 4.02 (3.68 without very good), and in scripts contain-ing VBZ RG JJ the ratio goes up to 2.73. Also, in most of these scripts the error involves the in-definite article. The emerging picture then is that there is a link between these richer nominal struc-tures that include more than one modifier and the omission of the article. Two questions arise: (i) why these richer nominals should associate with article omission and (ii) why only singular nouns are implicated in this feature.
Article omission errors are typical of learn-ers coming from L1s lacking an article sys-tem (Robertson, 2000; Ionin and Montrul, 2010; Hawkins and Buttery, 2010). Trenkic (2008) pro-poses that such learners analyse articles as adjecti-val modifiers rather than as a separate category of determiners or articles. When no adjective is in-volved, learners may be aware that bare nominals are ungrammatical in English and provide the ar-ticle. However, with complex adjectival phrases, learners may omit the article because of the pres-ence of a degree adverb. In order to evaluate this hypothesis further we need to investigate if arti-cle omission is indeed more pronounced in our data with more complex adjectival phrases e.g.,
very difficult situationthan with simpler ones e.g.,
learners from L1s lacking articles.
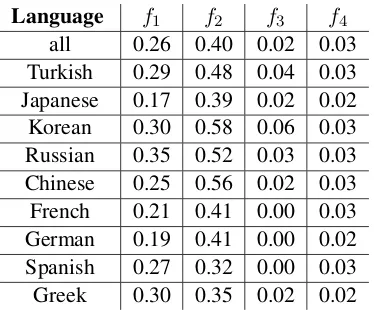
Again, using the Errors by decreasing fre-quency pane we found that the MD:doc ratio in scripts containing the bigram JJ NN1 is 2.20. Ad-ditionally, in scripts containing JJ NN1 and not RG JJ NN1 it goes down to 2.04. These results are much lower compared to the MD:doc ratio in scripts containing RG JJ NN1 and/or the fea-tures with which it is related (see above), fur-ther supporting our hypothesis. We also found the ratio of RG JJ NN1 (f1) occurrences per
doc-ument across different L1s, as well as the ratio of VBZ RG JJ (f2), VBZ RG JJ NN1 (f3) and
RG JJ NN1 II (f4). As shown in Table 2 there
is no correlation between these features and the L1, with the exception of f1 and f2 which are
more pronounced in Korean and Russian speak-ers, and of f3 which seems completely absent
from French, German and Spanish which all have articles. The exception is Greek which has articles but uses bare nominals in predicative structures.
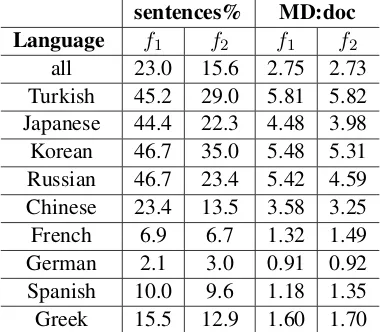
However, a more systematic pattern is revealed when relations with MD errors are considered (us-ing theFeature–Error relationsandErrors by de-creasing frequencycomponents for different L1s). As shown in Table 3, there is a sharp contrast be-tween L1s with articles (French, German, Spanish and Greek) and those without (Turkish, Japanese, Korean, Russian, Chinese), which further sup-ports our hypothesis. A further question is why only the singular article is implicated in this fea-ture. The association with predicative contexts may provide a clue. Such contexts select nomi-nals which require the indefinite article only in the singular case; compareUnix is (a) very powerful systemwithMacs are very elegant machines.
In sum, navigating the UI, we formed some initial interpretations for why a particular feature is negatively discriminative. In particular, nomi-nals with complex adjectival phrases appear par-ticularly susceptible to article omission errors by learners of English with L1s lacking articles. The example illustrates not just the usefulness of visu-alisation techniques for navigating and interpret-ing large amounts of data, but, more generally the relevance of features weighted by discrimina-tive classifiers. Despite being superficial in their structure, POS ngrams can pick up syntactic envi-ronments linked to particular phenomena. In this case, the features do not just identify a high rate of article omission errors, but, importantly, a
partic-sentences% MD:doc Language f1 f2 f1 f2
[image:7.595.318.509.72.238.2]all 23.0 15.6 2.75 2.73 Turkish 45.2 29.0 5.81 5.82 Japanese 44.4 22.3 4.48 3.98 Korean 46.7 35.0 5.48 5.31 Russian 46.7 23.4 5.42 4.59 Chinese 23.4 13.5 3.58 3.25 French 6.9 6.7 1.32 1.49 German 2.1 3.0 0.91 0.92 Spanish 10.0 9.6 1.18 1.35 Greek 15.5 12.9 1.60 1.70
Table 3: f1/2 relations with MD errors for different
L1s, where sentences% shows the proportion of sen-tences containingf1/2that also contain a MD.
ular syntactic environment triggering higher rates of such errors.
5 Previous work
To the best of our knowledge, this is the first at-tempt to visually analyse as well as perform a linguistic interpretation of discriminative features that characterise learner English.
Collins (2010) in his dissertation addresses vi-sualisation for NLP research. TheBubble Sets vi-sualisation draws secondary set relations around arbitrary collections of items, such as a linguis-tic parse tree. VisLink provides a general plat-form within which multiple visualisations of lan-guage (e.g., a force-directed graph and a radial graph) can be connected, cross-queried and com-pared. Moreover, he explores the space of content analysis.DocuBurstis an interactive visualisation of document content, which spatially organizes words using an expert-created ontology (e.g., WordNet).Parallel Tag Cloudscombine keyword extraction and coordinated visualisations to pro-vide comparative overviews across subsets of a faceted text corpus. Recently, Rohrdantz et al. (2011) proposed a new approach to detecting and investigating changes in word senses by visually modelling and plotting aggregated views about the diachronic development in word contexts.
et al. (2010a) present a system that supports the inspection and curation of data sets showing gene expression over time, in conjunction with the spa-tial location of the cells where the genes are ex-pressed.
Graph layouts have been effectively used in the analysis of domains such as social networks (e.g., terrorism network) to allow for a system-atic exploration of a variety of Social Network Analysis measures (e.g., Gao et al. (2009) and Perer and Shneiderman (2006)). Heer and Boyd (2005) have implementedVizster, a visualisation system for the exploration of on-line social net-works (e.g., facebook) designed to facilitate the discovery of people, promote awareness of com-munity structure etc. Van Ham et al. (2009) intro-ducePhrase Net, a system that analyses unstruc-tured text by taking as input a predefined pattern and displaying a graph whose nodes are words and whose edges link the words that are found as matches.
We believe our integration of highly-weighted discriminative features identified by a supervised classifier into a graph-based visualiser to support linguistic SLA research is, however, novel.
6 Conclusions
We have demonstrated how a data-driven ap-proach to learner corpora can support SLA re-search when guided by discriminative features and augmented with visualisation tools. We de-scribed a visual UI which supports exploratory search over a corpus of learner texts using di-rected graphs of features, and presented a case study of how the system allows SLA researchers to investigate the data and form hypotheses about intermediate level learners. Although the use-fulness of the EP visualiser should be con-firmed through more rigorous evaluation tech-niques, such as longitudinal case studies (Shnei-derman and Plaisant, 2006; Munzner, 2009) with a broad field of experts, these initial explorations are encouraging. One of the main advantages of using visualisation techniques over command-line database search tools is that SLA researchers can start developing and testing hypotheses without the need to learn a query syntax first.
We would also like to point out that we adopted a user-driven development of the visualiser based on the needs of the third author, an SLA re-searcher who acted as a design partner during
the development of the tool and was eager to use and test it. There were dozens of meetings over a period of seven months, and the feedback on early interfaces was incorporated in the version described here. After the prototype reached a sat-isfactory level of stability, the final version overall felt enjoyable and inviting, as well as allowed her to form hypotheses and draw on different types of evidence in order to substantiate it (Alexopoulou et al., 2012). Future work will include the devel-opment, testing and evaluation of the UI with a wider range of users, as well as be directed to-wards investigation and evaluation of different vi-sualisation techniques of machine learned or ex-tracted features that support hypothesis formation about learner grammars.
Acknowledgments
We are grateful to Cambridge ESOL for support-ing this research. We would like to thank Marek Rei, Øistein Andersen, Paula Buttery and Ange-liki Salamoura for fruitful discussions and feed-back, Tim Parish for making the tool available on the web, as well as the anonymous reviewers for their valuable comments and suggestions.
References
Theodora Alexopoulou, Helen Yannakoudakis, and Angeliki Salamoura. 2012. Classifying interme-diate Learner English: a data-driven approach to learner corpora.to appear.
Ted Briscoe, John Carroll, and Rebecca Watson. 2006. The second release of the RASP system. In Pro-ceedings of the COLING/ACL, volume 6.
Ted Briscoe, Ben Medlock, and Øistein Andersen. 2010. Automated Assessment of ESOL Free Text Examinations. University of Cambridge, Computer Laboratory, TR-790.
Stuart K. Card, Jock D. Mackinlay, and Ben Shneider-man. 1999. Readings in information visualization: using vision to think. Morgan Kaufmann.
Christopher M. Collins. 2010. Interactive Visualiza-tions of natural language. Ph.D. thesis, University of Toronto.
Giuseppe Di Battista, Peter Eades, Roberto Tamassia, and Ioannis G. Tollis. 1999. Graph Drawing: Al-gorithms for the Visualization of Graphs. Prentice Hall Press.
Proceedings of the sixteenth ACM conference on in-formation and knowledge management, pages 213– 222. ACM.
Ben Fry. 2007. Visualizing Data: Exploring and Explaining Data with the Processing Environment. O’Reilly Media.
Jie Gao, Kazuo Misue, and Jiro Tanaka. 2009. A Multiple-Aspects Visualization Tool for Exploring Social Networks. Human Interface and the Man-agement of Information, pages 277–286.
Otis Gospodnetic and Erik Hatcher. 2004. Lucene in Action. Manning Publications.
Lu Gram and Paula Buttery. 2009. A tutorial intro-duction to iLexIR Search. unpublished.
John Hawkins and Paula Buttery. 2010. Criterial fea-tures in Learner Corpora: theory and illustrations.
English Profile Journal, 1(1):1–23.
Jeffrey Heer and Danah Boyd. 2005. Vizster: visual-izing online social networks. IEEE Symposium on Information Visualization (INFOVIS), pages 32–39. Jeffrey Heer, Stuart K. Card, and James A. Landay. 2005. Prefuse: a toolkit for interactive informa-tion visualizainforma-tion. InProceedings of the SIGCHI conference on Human factors in computing systems, pages 421–430, New York, USA. ACM.
Tania Ionin and Silvina Montrul. 2010. The role of l1 transfer in the interpretation of articles with definite plurals in l2 english. Language Learning, 60(4):877–925.
Miriah Meyer, Tamara Munzner, Angela DePace, and Hanspeter Pfister. 2010a. MulteeSum: a tool for comparative spatial and temporal gene expression data. IEEE transactions on visualization and com-puter graphics, 16(6):908–17.
Miriah Meyer, Bang Wong, Mark Styczynski, Tamara Munzner, and Hanspeter Pfister. 2010b. Pathline: A tool for comparative functional genomics. Com-puter Graphics, 29(3).
Tamara Munzner. 2009. A Nested Model for Visual-ization Design and Validation. IEEE Transactions on Visualization and Computer Graphics, 15(6). Diane Nicholls. 2003. The Cambridge Learner
Corpus-error coding and analysis for lexicography and ELT. InProceedings of the Corpus Linguistics 2003 conference, pages 572–581.
Adam Perer and Ben Shneiderman. 2006. Balanc-ing Systematic and Flexible Exploration of Social Networks.IEEE Transactions on Visualization and Computer Graphics, 12(5):693–700.
Catherine Plaisant, James Rose, Bei Yu, Loretta Auvil, Matthew G. Kirschenbaum, Martha N. Smith, Tanya Clement, and Greg Lord. 2006. Exploring erotics in Emily Dickinson’s correspondence with text mining and visual interfaces. InProceedings of the 6th ACM/IEEE-CS joint conference on Digital libraries, pages 141–150. ACM.
Daniel Robertson. 2000. Variability in the use of the English article system by Chinese learners of En-glish.Second Language Research, 2:135–172. Christian Rohrdantz, Annette Hautli, Thomas Mayer,
and Miriam Butt. 2011. Towards tracking seman-tic change by visual analyseman-tics. Proceedings of the 49th Meeting of the Association for Computational Linguistics, pages 305–310.
Ben Shneiderman and Catherine Plaisant. 2006. Strategies for evaluating information visualization tools: multi-dimensional in-depth long-term case studies. InProceedings of the 2006 AVI workshop on BEyond time and errors: novel evaluation meth-ods for information visualization. ACM.
Danijela Trenkic. 2008. The representation of English articles in second language grammars: Determiners or adjectives? Bilingualism: Language and Cogni-tion, 11(01):1–18.
Frank Van Ham, Martin Wattenberg, and Fernanda B. Vi´egas. 2009. Mapping text with phrase nets.
IEEE Transactions on Visualization and Computer Graphics, 15(6):1169–76.