Experimental Design to Improve Topic Analysis Based Summarization
John E. Miller
Computer & Information Sciences University of Delaware
Newark, DE 19711
Kathleen F. McCoy Computer & Information Sciences
University of Delaware Newark, DE 19711
Abstract
We use efficient screening experiments to investigate and improve topic analysis based multi-document extractive summa-rization. In our summarization process, topic analysis determines the weighted topic content vectors that characterize the corpora, and then Jensen-Shannon diver-gence extracts sentences that best match the weighted content vectors to assemble the summaries. We use screening experi-ments to investigate several control param-eters in this process, gaining better under-standing of and improving the topic anal-ysis based summarization process.
1 Introduction
We use efficient experimental design to investi-gate and improve topic analysis based multiple document extractive summarization. Our process proceeds in two steps: Latent Dirichlet Anal-ysis (LDA) topic analAnal-ysis determines the top-ics that characterize the multi-document corpus, and Jensen-Shannon divergence selects sentences from the corpus. This process offers many poten-tial control settings for understanding and improv-ing the summarization process.
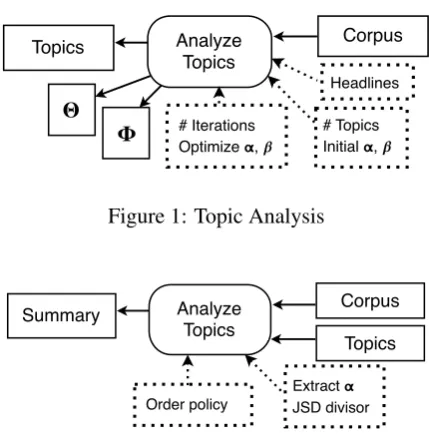
Figure 1 shows topic analysis with corpus input, control settings, and product outputs of topics and probability estimates of topic compositions and document mixtures. There are controls for doc-ument preparation (headlines) and analysis (num-ber of topics, initialαandβ, number of iterations, and whether to optimizeαandβin process).
Figure 2 shows summarization with corpus and topic inputs, control settings, and the text summa-rization product. There are controls for extraction of sentences (Extractα and JSD Divisor) and for composing the summary (Order policy).
Topic analysis has become a popular choice for text summarization as seen in Text Analysis
Con-Corpus Analyze
Topics
# Iterations!
Optimize 𝝰, 𝜷
# Topics!
Initial 𝝰, 𝜷 Topics
𝚽 𝚯
Headlines
Figure 1: Topic Analysis
Corpus Analyze
Topics
Order policy
Extract 𝝰!
JSD divisor
Summary
[image:1.595.308.523.200.420.2]Topics
Figure 2: Text Summarization
ferences (TAC, 2010; TAC, 2011) with individual team reports (Delort and Alfonseca, 2011; Lui et al., 2011; Mason and Charniak, 2011). Nenkova and McKeown (2012; 2011) included topic anal-ysis among standard methods in their surveys of text summarization methodologies. Haghighi and Vanderwende (2009) explored extensions of LDA topic analysis for use in multiple document sum-marization tasks. Yet there are many control set-tings that can affect summarization that have not been explicitly studied or documented, and that are important for reproducing research results.
In this text summarization pilot study, we exper-iment with several control settings. As in Mason and Charniak (2011) we do a general rather than guided summarization. Our primary contribution is illustrating the use of efficient experimental de-sign on control settings to help understand and im-prove the text summarization process. We enjoy some success in this endeavor even as we are sur-prised by some of our results.
2 Technical Background
2.1 LDA Topic Analysis
LDA topic analysis uses a per document bag of words approach to determine topic compositions of words and document mixtures of topics. Anal-ysis constructs topic compositions and document mixtures by assigning words to topics within doc-uments. Weighted topic compositions can then be used as a basis for selecting the most informative text to include in summarizations.
LDA topic analysis is based on a generative probabilistic model. Document mixtures of top-ics are generated by a multinomial distribution,
Θ, and topic compositions of words are
gener-ated by a multinomial distribution,Φ. BothΘand Φin turn are generated by Dirichlet distributions
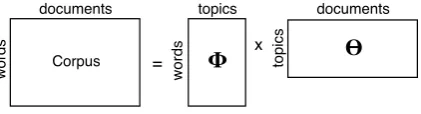
with parameters α and β respectively. Figure 3 (Steyvers and Griffiths, 2007) shows a corpus ex-plained as the product of topic word compositions (Φ) and document topic mixtures (Θ).
Corpus
w
o
rd
s
documents
w
o
rd
s
topics documents
to
p
ics
=
x 𝚹
[image:2.595.77.288.356.413.2]𝚽
Figure 3: Topic Model
The joint distribution of words and topics (Grif-fiths and Steyvers (2004)) is given byP(w,z) =
P(w|z)P(z)where in generating a document the
topics are generated with probabilityP(z)and the
words given the topics are generated with proba-bilityP(w|z). Here
P(w|z) = Γ (β•) Γ (β)V
!Z Z Y
z=1 Q
vΓ (nzv+β) Γ (nz•+β•)
,
(1) wherenzvis the number of times wordvoccurs in
topicz,nz•is the number of times topiczoccurs,
β• is the sum of theβ scalar over all word types,
and Γ ( ) is the gamma function (Knuth, 2004),
and
P(z) = Γ (α•) Γ (α)Z
!D D Y
d=1 Q
zΓ (nzd+α) Γ (n•d+α•)
, (2)
wherenzdis the number of times topiczoccurs in
documentd,n•dis the number of times document
doccurs, andα•is the sum ofαs over topics.
Analysis reverses the generative model. Given a corpus, topic analysis identifies weighted topic word compositions and document topic mixtures from the corpus. We assign topics to words in the training corpus using Gibbs sampling (Gel-man et al., 2004) where each word is considered in turn in making the topic assignment. We monitor training progress bylogP(w,z)where a greater logP(w,z)indicates better fit. After sufficient
it-erations through the corpus thelogP(w,z)
typi-cally converges to steady state.
Analysis products are topic determinations for the corpus as well as weighted estimates of topic word compositions Φ and document topic
mix-tures Θ. The α and β priors are optimized (re-estimated) during training and the asymmetric α which varies by topic can be used as a measure of topic importance in our summarization step.
The topic analysis implementation used in this pilot study borrows from the UMass Mallet topic analysis (McCallum, 2002).
2.2 Jensen-Shannon Divergence
From the topic word compositions and optimized αs, we form a weighted aggregate vector of the prominent topics, and select sentences from the corpus that have minimal divergence from the ag-gregate topic.The operating assumption is that the aggregate topic vector adequately represents the content of an ideal summary.So the closer tozero divergence from the aggregate topic, the closer we are to the ideal summary.
We seek to minimize the Jensen-Shannon Di-vergence, JSD(C||T), a symmetric
Kullback-Liebler (KL) divergence, between the extractive summary content, C, and the aggregate topic, T, using a greedy search method of adding at each pass through the corpus the sentence that most reduces the divergence. Haghighi and Vander-wende (2009) made similar use of KL divergence in theirTopic Summethod.
In preliminary studies, this minimize JSD cri-terion seemed to give overly long sentences be-cause the greedy method favored the greatest re-duction in JSD regardless of the length of the sen-tence. This affected readability and rapidly used up all available target document size. Therefore we modified the greedy search method to consider sentence length as well.1
1Global optimization ofJSD(C||T)could address both
In selecting each new sentence we seek to maxi-mize the reduction in divergence corrected for sen-tence length
(JSD(Ct−1||T)−JSD(St, Ct−1||T))
f unction(length(St))
, (3)
whereSt is the sentence under consideration and
Ct−1is the content from the previously completed
iterations, and the function of length ofSt, is
ei-ther the constant 1 (i.e. no correction for sentence length) orplength(St).
3 Pilot Study Using TAC 2010 Samples Our goal is to investigate and optimize factors that impact multi-document extractive summarization. We hope to subsequently extend our findings and experience to abstractive summarization as well.
For our pilot, we’ve chosen summarization of the 2010 Text Analysis Conference (2010) sam-ple themes, which are conveniently available and of a manageable size. The three sample themes are from different summarization categories out of a total of 46 news themes over five different cat-egories, with 10 original and 10 follow-up news reports each. In the original TAC 2010 task, par-ticipants were asked to do focused queries varying with the summarization category. In our pilot we perform an undirected summarization of the orig-inal news reports.
NIST provides 4 model summaries for each news theme annotated for the focused summary, and we use these model summaries in scoring our extractive summarizations.2 We also include a
measure of fluency in our assessment.
Our document summarization task is then: mul-tiple document extractive summarization using 10 documents of less than 250 words each to con-struct summaries of 100 words.
3.1 Preliminary Results of Topic Analysis
Topic analysis is such a complex methodology that it makes sense to fix some parameters before using it in the summarization process.
We use the commonly accepted initial αvalue of 1 for each topic giving a sum ofαvalues equal to the number of topics. Later, we experiment with a single individual topic initialαvalue, but we al-ways maintain an initialα sum equal to the num-ber of topics. Likewise we use the scalarβ value
2Comparison of our summarization results versus the
TAC 2010 task will necessarily be imprecise given the dif-ferences in focus of our pilot study from TAC 2010.
0.1 typical of a modest number of word types (less than 1000 in this study).
In prior studies, we found that re-estimating α andβ frequently adds little cost to topic analysis and drives better and more rapid convergence. We optimizeαandβ every 5 iterations, starting at it-eration 50.
How Many Topics to Use
The number of topics depends on the problem it-self. The problem of size of ≈ 2000 words per
news theme would indicate a number of topics be-tween 3 and 20 as adequate to explain document word use where the log(|Corpus|) is the
mini-mum andp|Corpus|is the maximum number of topics to use (Meil˘a, 2007).
A common way to select the correct number of topics is to optimizelogP(w) on held-out
doc-uments, where greater log likelihoods indicate a better number of topics. While it would be im-practical to do such a study for each news theme or each document summary, it is reasonable to do so on a few sample themes and then generalize to similar corpora. We look at log likelihood for 3, 5, and 10 topics using the TAC 2010 sample themes. As there are only 10 documents for each theme, we use the TAC 2010 update documents as held-out documents for calculating the log likelihoods. Topic word distributions, Φ, from training are
used to infer document mixtures,Θ, on the
held-out data, and the log P(w) is calculated (Teh et
al., 2007) as:
P(w) =Y d,i
X
z
nzwi+β
nz•+β•
nzd+α
n•d+α•
!
, (4)
where the sum is over all possible topics for a given word and the product is over all documents and words.
Table 1 shows mean log likelihoods for the news themes at 3, 5 and 10 topics each. There is lit-tle practical difference between the log likelihood measures even though the 3 topic model has a sig-nificantly lower log likelihood (p < 0.05) than
the 5 and 10 topic models. We assess topic quality more directly to see which model is better.
3 Topics 5 Topics 10 Topics -6.00 -5.97 -5.96
Useful topic quality measures are:
Importance measured by number of documents (or optimized αs). Low importance topics, with very few documents related to a topic, indicate that we have more topics than neces-sary. While not a fatal flaw, the topic model may be over fit.
Coherence measured as a log sum of co-occurrence proportions of each topic’s high frequency words across multiple docu-ments (Mimno et al., 2011). The more neg-ative the coherence measure, the poorer the coherence. A few poor coherence topics is not fatal, but the topic model may be over fit.
Similarity to other topics measured by cosine distance between topic vectors is undesirable. The more similar the topics, the more diffi-cult it is to distinguish between them. Many similar topics makes it difficult to discrimi-nate among topics over the corpus.
Reviewing the document quality for 3, 5 and 10 topics we find:
• More low importance topics in 10 versus 5 and 3 topic models,
• Somewhat better topic coherence in 3 and 5 topic models,
• Undesirable greater topic similarity for the 3 versus 5 versus 10 topic models.
We choose the 10 topic model giving higher pri-ority to the problem of undesirable topic similar-ity, recognizing that we may get some unimportant or less coherent topics. As our summarization pro-cess only uses the most important topics for the ag-gregate topic, the occasional unimportant and less coherent topic should not matter.
Document Preparation
Document cleaning removed all HTML, as well as all header information not related to the articles themselves; document dates, references, and head-lines were saved for use in the document summa-rization step. Document headlines were optionally folded into the document text. Stop words were re-moved and remaining words lemmatized for topic analysis.
4 Design of Experiments
As our information about the various controls in the process and the expected results is fairly rudi-mentary, we use efficient screening experimental
designs to evaluate several factors at the same time with a minimum number of trials. We define the factors (control parameters) in our experiment, the dependent variables we will measure, and finally select the screening design itself.
Most of the process of topic analysis will re-main fixed such as the use of 10 topics, initial α sum of 10, initial scalarβ of 0.1, optimization of αandβ every 5 iterations and 500 total iterations before saving the final topic vector weights and corresponding topic alphas.
From our experimentation we hope to find:
• Factors impacting dependent variables, • Gross magnitude of impact on dependent
variables,
• Factors to followup with in more detail.
4.1 Experimental Factors
In screening experiments, we chose factors about which we have crude information, and which we think could impact intermediate or final product results. To learn as much as possible about factor effects, we choose to vary them between default and extreme settings or between two extremes where we hope to see some positive impact.
Our experimental factors are:
Save headline text as part of document prepara-tion (Yes, No). Headlines often contain im-portant summary information. We test to see if such information improves summaries.
Single fixedα proportion of the α sum (*, 0.5). Topic analysis typically selects (weights) a few important topic vectors with substantial proportions of theαsum. We want to see if biasing selection of a single important vec-tor at a 0.5 proportion of theαsum improves summaries versus unbiasedαweighting (*).
Aggregate topic policy as a proportion of the α sum for selecting the topic aggregate used in summarization (0.5, 0.75). We order topics based on the optimized (re-estimated)αs and aggregate topics summing and weighting by theαs until we reach the aggregate topic pol-icy proportion. We want to see which polpol-icy (0.5 or 0.75) proportion of theα sum results in better summaries.
sentences selected. We test the impact on the summaries themselves.
Order policy for constructing the summary from selected sentences (DATE-DOC, SALIENCE-DOC). Ordering sentences by news report date or by salience as measured by reduction in JSD should impact the fluency of summaries.
4.2 Dependent Variables
We want readable and informative text that sum-marizes content of the input documents in the al-lowable space. We measure several intermedi-ate process variables as well as evaluintermedi-ate the sum-maries themselves.
Intermediate measures include:
• Initial selected sentence Jensen-Shannon di-vergence from the aggregate topic. The first sentence selected should substantially reduce divergence.
• Final selected sentence Jensen-Shannon di-vergence from the aggregate topic. Diver-gence close to zero would indicate broad cov-erage of the aggregate topic; it may be related to summary content.
• Number of topics in the aggregate topic. • Average sentence length. This should be
im-pacted by the JSD divisor; it may be related to summary fluency.
ROUGE (Lin, 2011) is a package for auto-matic evaluation of summaries that compares sys-tem produced summaries to model (gold stan-dard) summaries and reports statistics such as R-2, bi-gram co-occurrence statistics between sys-tem and model summaries, and SU4, skip bi-gram co-occurrence statistics where word pairs no more than 4 words apart may also be counted as bi-grams. The R-2 and SU4 are automated content measures reported for TAC 2010, and the gold standard summaries are readily available for the samples topics. We use ROUGE R-2 and SU4 as reliable dependent measures and for comparison to TAC 2010 results.
We add a simple measure of fluency focused on across sentence issues. The fluency score starts at a value of 5 and then subtracts: 1 for each non sequituror obvious out of order sentence,1/2
for each missing co-reference, non-informative, ungrammatical, or redundant sentence. For sen-tences of less than 20 words, when more than one
penalty applies only the most severe penalty is ap-plied, so as not to penalize the same short phrase multiple times. Scoring is done by one of the au-thors without knowing the combination of experi-mental factors of the summary (blind scoring).
Summary measures thus include: ROUGE R-2, ROUGE SU4, and Fluency.
4.3 Select Experimental Design
Screening designs focus on detecting and assess-ing main effects and optionally low order inter-action effects. When all experimental factors are continuous, center points may also be included in some designs. In subsequent stages of experimen-tation, when factors have been reduced to a min-imum, one can use more fine grained factor set-tings to better map the response surface for those factors. Two common families of screening de-signs (Montgomery, 1997) are:
Two level fractional factorial Uses a power of
1/2fraction of a full two level factorial design.
For example, instead of running all possible combinations of 5 factors (i.e. 32 trials), you could choose a1/2or even1/4fraction of the
design, based on how many experiments you can run and how much confounding you are willing to accept between main effects and various interaction effects. The1/2fraction of
a 5 factor design would result in 16 trials be-ing run with the main effects estimated clear of any 2-way or 3-way interactions.
Plackett-Burman These screening designs are available in multiples of 4 trials and can have as many factors as the number of trials less one. Main effects are confounded with all other effects in the Plackett-Burman design and so not estimable, but the confounding is spread evenly among all main effects rather than concentrated in specific interactions as in the fractional factorial.
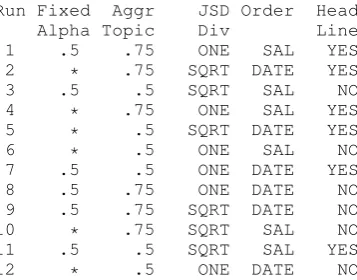
We’ve chosen the 12 run Plackett-Burman de-sign with 5 factors and 6 degrees of freedom from the unassigned (dummy) factors available to esti-mate error. Assuming sparsity of effects (or equiv-alently invoking the Pareto principal), there will likely only be a few critical factors explaining much of the variation in dependent variables.
Run Fixed Aggr JSD Order Head
Alpha Topic Div Line
1 .5 .75 ONE SAL YES
2 * .75 SQRT DATE YES
3 .5 .5 SQRT SAL NO
4 * .75 ONE SAL YES
5 * .5 SQRT DATE YES
6 * .5 ONE SAL NO
7 .5 .5 ONE DATE YES
8 .5 .75 ONE DATE NO
9 .5 .75 SQRT DATE NO
10 * .75 SQRT SAL NO
11 .5 .5 SQRT SAL YES
[image:6.595.75.254.61.201.2]12 * .5 ONE DATE NO
Table 2: Plackett-Burman 12 DOE.
5 Experimental Results
We analyze our experiment using conventional analysis of variance (ANOVA) and show tables of means for the various experimental conditions. As this is a screening experiment, we treat a p-value< 0.20 asinformative and consider the correspond-ing factor worth further consideration. To save space, only significant p-values are reported rather than the full ANOVAs.
5.1 Intermediate Measures
Number of topicsin the aggregate topic is directly impacted by the AggrTopic setting; we simply re-port the mean number of topics selected by Aggr-Topic value (Table 3). The 1.0 average number of topics for AggrTopic set to 0.5 indicates that only onetopic was ever selected for the aggregate topic at this setting. This implies that the most impor-tant topic always had an α proportion> 0.50 of
theαsum even when the FixedAlpha setting was * (for unbiasedαweighting). This is unexpected in that we thought the most important topicα de-termined by topic analysis would be more variable and show someαvalues with proportions less than 0.5 of theαsum.
Aggr Number Topic Topics
0.50 1.00
0.75 4.55
Table 3: Average Number Topics.
Average sentence lengthin the summary may be affected by any of the independent variables ex-cept sentence order policy. JSD Divisor has a dra-matic impact (p <0.0001) and AggrTopic a
mod-est impact (p <0.01) on average sentence length.
Using a divisor of ONE in the JSD based sentence selection results in much longer sentences while using AggrTopic of 0.5 results in shorter sentences (Table 4).
Aggr Sentence JSD Sentence Topic Length Divisor Length
0.5 20.3 ONE 26.8
0.75 23.9 SQRT 17.4
Standard Error of the mean = 0.78
Table 4: Average Sentence Length.
Initial selected sentence Jensen-Shannon diver-gence (JSD) should be affected directly by JSD Divisor in iterative sentence selection, but may also be affected by any of the other independent variables except for sentence order policy. Aggr-Topic and JSD Divisor strongly impact initial sen-tence JSD (p <0.00005).
The table of JSD initial sentence means by Ag-grTopic and JSD Divisor is revealing (Table 5). The JSD for the initial sentence selected is lower for AggrTopic of 0.5. We observed above that only onetopic is selected for the aggregate topic when AggrTopic is 0.5. Thus we achieve a lower di-vergence of the initial sentence from the aggregate topic when the aggregate is composed of onlyone topic. For initial sentence JSD, aggregating topics seems ineffective.
Similarly a JSD Divisor of ONE gives a lower initial divergence than using the SQRT as the di-visor. The interpretation is problematic here in that a divisor of ONE seems to give lower ini-tial divergence because it selects longer sentences, which means that less space remains in the sum-mary to select other sentences minimizing total di-vergence.
Aggr JSD JSD JSD
Topic Initial Divisor Initial 0.5 0.665 ONE 0.658 0.75 0.735 SQRT 0.742 Standard Error of the mean = 0.0056
Table 5: Average Initial JSD.
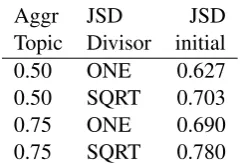
[image:6.595.324.508.127.183.2]Aggr JSD JSD Topic Divisor initial 0.50 ONE 0.627 0.50 SQRT 0.703 0.75 ONE 0.690 0.75 SQRT 0.780 Standard Error of the mean = 0.0080
Table 6: Average Initial JSD.
Final sentence Jensen-Shannon Divergence (JSD)may be affected by any but the sentence or-der policy variable. AggrTopic (p <0.00001) and
JSD Divisor (p <0.001) strongly impact the final
sentence JSD; there is also a possible effect from including headlines in the summary (p < 0.1).
The effect of the JSD Divisor has reversed from the initial JSD; using a divisor of ONE results here in aless desirable higher divergence for the final sentence. The AggrTopic effect is about the same as for initial JSD divergence; a single dominant topic seems more effective than using an aggre-gate topic.
Aggr JSD JSD JSD
Topic Final Divisor Final 0.5 0.422 ONE 0.487 0.75 0.513 SQRT 0.448 Standard Error of the mean = 0.0047
Table 7: Average Initial JSD.
Impact of AggrTopic and JSD Divisor together on the JSD for the initial sentence (Table 8) seems additive.
Aggr JSD JSD
[image:7.595.325.508.332.430.2]Topic Divisor final 0.50 ONE 0.437 0.50 SQRT 0.407 0.75 ONE 0.537 0.75 SQRT 0.490 Standard Error of the mean = 0.0066
Table 8: Average Final JSD.
5.2 Product Measures
Based on the analysis of intermediate measures, it would seem that using a JSD Divisor of the SQRT and selecting only the dominant topic gives less divergence from the aggregate topic. However,
we have to be careful here in drawing conclusions based on intermediate variables; selecting only the dominant topic may result in reduced divergence, but this does not necessarily mean that the domi-nant topic is representative of good summaries.
We examine product variables to provide direct support in our study, and so we ask how ROUGE R-2 and SU4, and fluency evaluations vary with the experimental factors. This pilot studies un-guided summarization of initial stories from the 3 sample news themes from 3 separate categories. While results are not directly comparable with those of the full TAC 2010 test corpus, we will use the TAC 2010 results as a reference point versus our own results. The average of all experiments are reported along with the TAC 2010 results (Ta-ble 9). Our ROUGE R-2 and SU4 performance seems reasonable showing results better than the baseline but not as good as the best system.
Reference System R-2 SU4 Baseline - Lead sentences 5.4 8.6 Baseline - MEAD† 5.9 9.1
Best System 9.6 13.0
Pilot Average 6.7 10.1
Pilot Minimum 5.6 8.7
Pilot Maximum 8.1 11.9
†Text summarization system (Radevet al., 2004)
Table 9: TAC 2010 ROUGE Scores.
ROUGE R-2results show no significant impact from our experimental factors. This is disappoint-ing as it gives us no handle on how to improve performance.
ROUGE SU4shows a modest impact for Aggr-Topic (p <0.025) and the possible impact of JSD
Divisor (p < 0.20). Note that we dropped
der and FixedAlpha factors from the model; Or-der because it can only effect sentence orOr-der and FixedAlpha because the most important α deter-mined automatically by topic analysis did not vary much from the 0.5 FixedAlpha. A benefit of drop-ping terms from the model is that we have more dummy factors to estimate error.
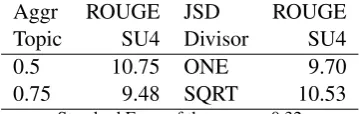
The ROUGE SU4 means (Table 10) show the same pattern as for the JSD final sentence, but the differences are not as clear cut. Box and whiskers plots for AggrTopic and JSD Divisor (Figures 4 and 5) offer more insight into the AggrTopic and JSD Divisor effects.
[image:7.595.122.242.549.629.2]Aggr ROUGE JSD ROUGE
Topic SU4 Divisor SU4
0.5 10.75 ONE 9.70
0.75 9.48 SQRT 10.53
[image:8.595.91.271.63.120.2]Standard Error of the mean = 0.32
Table 10: Average ROUGE SU4.
levels 0.5 and 0.75 with better results at the 0.5 level, except for an outlier value of 9.1. Investiga-tion shows no data coding error and nothing spe-cial about the experimental conditions other than if uses a JSD Divisor of ONE which also gives lower SU4 scores. The box and whiskers plots for JSD Divisor effects also suggest a positive effect for JSD Divisor of SQRT, but the whiskers over-lap the boxes indicating no strong effect.
●
0.5 0.75
9.0
9.5
10.0
10.5
11.0
11.5
12.0
Alpha Extract Proportion
R
[image:8.595.74.279.315.451.2]OUGE SU4
Figure 4: ROUGE SU4 by Aggr Topic
ONE SQRT
9.0
9.5
10.0
10.5
11.0
11.5
12.0
JSD Divisor
R
OUGE SU4
Figure 5: ROUGE SU4 by JSD Divisor
We had speculated that the final sentence diver-gence might be related to some of the end prod-uct measures. Indeed, we find that JSD final sen-tence is strongly inversely related to ROUGE SU4 as shown by regression analysis (Table 11). While the residual error of 0.73 indicates that we can only reliably predict ROUGE SU4 within 1.5 units (for averages of 3 trials), this is still important. A 0.1 reduction in final sentence divergence cor-responds on the average to a 1.4 unit increase in ROUGE SU4.
Estimate StdErr t Pr(>|t|)
Intercept 16.865 1.934 8.721 ˜0.0
JSDfinal -14.435 4.112 -3.510 0.006
Residual standard error: 0.73 on 10 degrees of freedom F-statistic: 12.32 on 1 and 10 DF, p-value: 0.0056
Table 11: Regression - ROUGE SU4.
We thoughtSimple Fluencywould show an ef-fect for sentence order policy and maybe other fac-tors. Analysis shows an effect for JSD Divisor
(p < 0.05) and possible effects of Order policy and Head lines (p <0.20).
Fluency means (Table 12) show that fluency is better for JSD Divisor ONE. From our experience of scoring Fluency, this would seem to be because the fewer and longer sentences with JSD Divisor of ONE offer fewer chances for disfluencies. The better Fluency with DATE ordering likely comes from fewer out of order ornon sequitursentences, and the better Fluency with NO headlines likely results from fewer short ungrammatical headlines as part of the text.
JSD Flu- Order Flu- Head
Flu-Div ency ency Lines ency
ONE 3.95 DATE 3.80 NO 3.80 SQRT 3.33 SAL 3.47 YES 3.47
Standard Error of the mean = 0.16
Table 12: Average Fluency.
6 Summary and Discussion
Our pilot studied topic analysis based multi-document extractive summarization using the 2010 TAC sample topics. Our experimental design process identified control factors with their default and extreme settings, defined intermediate and fi-nal product dependent measures, designed the ex-periment, ran, and analyzed the experiment.
We identified an intermediate variable, final se-lected sentence divergence, that could be used as a stand-in for the product content measure, ROUGE SU4. We found that using a single dominant topic, instead of an aggregate topic, and using a divisor of the square root of sentence length in sentence selection, improved final sentence divergence and ROUGE SU4. However, using a divisor of one in sentence selection improved fluency of summaries which is at odds with the benefit of using square root of sentence length to improve content.
References
Jean-Yves Delort and Enrique Alfonseca. 2011.
De-scription of the Google Update Summarizer. 2011
TAC Proceedings.
Andrew Gelman, John B. Carlin, Hal S. Stern, and
Donald B. Rubin. 2004. Bayesian Data Analysis.
Chapman and Hall/CRC, New York, USA.
Tom L. Griffiths and Mark Steyvers. 2004. Finding
Scientific Topics. PNAS, 101(Suppl. 1):5228-5235.
Aria Haghighi and Lucy Vanderwalde. 2009.
Exploring Content Models for Multi-Document
Summarization. 2009 NACL Conference, HLT
Proceedings:362-370.
Donald E. Knuth. 1997. The Art of Computer
Pro-gramming, Volume 1 (Fundamental Algorithms). Addison Wesley, New York, USA.
Chin-Yew Lin. 204. ROUGE: A Package for
Auto-matic Evaluation of Summaries. ACL 2004
Proceed-ings of Workshop: Text Summarization Branches Out.
Hongyan Liu, Pingan Liu, Wei Heng, and Lei Li. 2011. The CIST Summarization System at TAC
2011.2011 TAC Proceedings.
Dragomir Radev, Timothy Allison, Sasha
Blair-Goldensohn, John Blitzer, Arda Celebi,
Stanko Dimitrov, Elliott Drabek, Ali Hakim, Wai Lam, Danyu Liu, Jahna Otterbacher, Hong Qi, Horacio Saggion, Simone Teufel, Michael Topper, Adam Winkel, and Zhu Zhang. 2004. MEAD — A platform for multidocument multilingual
text summarization. Conference on Language
Resources and Evaluation LREC, Lisbon, Portugal, (May 2004).
Rebecca Mason and Eugene Charniak. 2011. BLLIP at TAC 2011: A General Summarization System for
a Guided Summarization Task. 2011 TAC
Proceed-ings.
Andres K. McCallum. 2002. MALLET: A
Machine Learning for Language Toolkit.
http://mallet.cs.umass.edu.
Marina Meil˘a. 2007. Comparing Clusterings – an
in-formation based distance. J. Multivariate Analysis,
98(5):873-895.
David Mimno, Hanna M. Wallach, Edmund Talley, Miriam Leenders, and Andrew McCallum. 2011. Optimizing Semantic Coherence in Topic Models.
2011 EMNLP Conference, Proceedings:262-272.
Douglas C. Montgomery. 1997. Design and Analysis
of Experiments. John Wiley and Sons, New York, USA.
Ani Nenkova and Kathleen McKeown. 2011.
Auto-matic Summarization. Foundations and Trends in
Information Retrieval, 5(2-3):1003-233.
Ani Nenkova and Kathleen McKeown. 2012. A
Sur-vey of Text Summarization Techniques. Mining Text
Data. In Charu C. Aggarwal and ChengXiang Zhai
(eds.) Springer.
Mark Steyvers and Tom Griffiths. 2007. Probabilisitic
Topic Models. Latent Semantic Analysis: A road to
Meaning. In T. Landauer, S. D. McNamara & W. Kintsch (eds.) Laurence Erlbaum.
Task Analysis Conference 2010 –
Summarization Track. 2010.
http://www.nist.gov/tac/2010/Summarization/.
Task Analysis Conference 2011 –
Summarization Track. 2011.
http://www.nist.gov/tac/2011/Summarization/.
Yee Whye Teh, Dave Newman, and Max Welling. 2007. Collapsed Variational Inference for HDP.