From Visualisation to Hypothesis Construction
for Second Language Acquisition
Shervin Malmasi
Centre for Language Technology
Macquarie University
Sydney, NSW, Australia
[email protected]
Mark Dras
Centre for Language Technology
Macquarie University
Sydney, NSW, Australia
[email protected]
Abstract
One research goal in Second Language Acqui-sition (SLA) is to formulate and test hypothe-ses about errors and the environments in which they are made, a process which often involves substantial effort; large amounts of data and computational visualisation techniques promise help here. In this paper we have defined a new task for finding contexts for errors that vary with the native language of the speaker that are potentially useful for SLA research. We pro-pose four models for approaching this task, and find that one based only on error-feature co-occurrence and another based on determining maximum weight cliques in a feature associ-ation graph discover strongly distinguishing contexts, with an apparent trade-off between false positives and very specific contexts.
1 Introduction
SLA researchers are interested in a wide variety of as-pects of humans learning a new language (L2) different from their native one (L1): cognitive issues and devel-opmental sequences for learners Pienemann (2005), so-ciocultural factors (Lantolf, 2001), and so on. One long-standing question, dating back to at least Lado (1957), is expressed by Ortega (2009) in the following way: “What is the role played by first language in L2 develop-ment,vis-`a-visthe role of other universal development forces?”
An example of SLA research that looks at this ques-tion is the study of Di´ez-Bedmar and Papp (2008), com-paring Chinese and Spanish learners of English with respect to the English article system (a,an,the) using corpora of essays by native and non-native speakers of English (Granger, 2011). Drawing on the 175 non-native texts, they take a particular theoretical analysis (the so-called Bickerton semantic wheel), use the simple Wordsmith tools designed to extract data for lexicogra-phers to identify errors in a semi-automatic way, and evaluate whether Chinese and Spanish L1 speakers do behave differently via hypothesis testing (ANOVA,
chi-square and z-tests, in their case). They conclude that Chinese and Spanish do have characteristic differences, with patterns of zero article and definite article use dif-fering according to semantic context. Such studies are typically carried out on relatively small datasets, and use fairly elementary tools. Sources such as Ellis (2008) and Ortega (2009) give good overviews of such studies and of SLA research in general.
A goal of this paper is to investigate a particular way in which Natural Language Processing (NLP) can use-fully contribute to SLA. In terms of existing work, the subfield of Native Language Identification (NLI) has been quite active recently, which looks at predicting the L1 of writers writing in a common L2 within a classification task framework; see for example the re-cent NLI shared task with 29 entrants (Tetreault et al., 2013).1 From within linguistics, there has been much interest in how data-driven approaches can contribute to SLA. Granger (2011) discusses a body of work based on the the methodology of carrying out corpus-based approaches to SLA with a focus on NLP tools; Jarvis and Crossley (2012) in an edited collection present re-cent work by linguists who extend the corpus-based setup by using a text classification approach, looking at what feature selection might say for SLA. From within NLP, Swanson and Charniak (2013) and Swanson and Charniak (2014) take a data-driven approach to SLA investigations much in the spirit of this work.
One particular approach to finding aspects of texts characteristic of their L1s that has motivated the present work is described in Yannakoudakis et al. (2012), the goal of which is to develop visualisation tools for SLA researchers. They present graphs of the relationships between errors and their contexts, such that SLA re-searchers can navigate through the graphs to find con-texts for particular errors that can lead to hypotheses like that of Di´ez-Bedmar and Papp (2008) above. In this paper, we look at approaches to finding such hypothesis candidates automatically in the context of L1–L2 inter-action by analysing the graphs used in the visualisations
1http://sites.google.com/site/
nlisharedtask2013/
of Yannakoudakis et al. (2012). Specifically, we do the following:
• We propose a new task that is more directly ori-ented to SLA research than NLI has been for the most part, with the goal of identifying error-related contexts that are characteristic of L1s.
• We evaluate a number of models for finding such contexts, ranging from a simple baseline to treat-ing the problem as a graph-theoretic maximum weighted clique one.
• We examine the results of some of the models to see how the task and the models might contribute to SLA research.
Because we draw heavily on the work of Yan-nakoudakis et al. (2012), we first review relevant aspects of that work in§2; we then present our task definition and experimental setup in§3; we give results along with a discussion in§4; we follow with some more detail on related work in§5; and we conclude in§6.
2 Developing Hypotheses: A
Visualisation Tool
The context of the Yannakoudakis et al. (2012) work is automated grading of English as a Second or Other Language (ESOL) exam scripts, as described in Briscoe et al. (2010). The automated grading takes a classifi-cation approach, using a binary discriminative learner, with useful features including lexical and part-of-speech (PoS) n-grams.
The publicly available dataset on which the work was carried out consists of texts from the First Certificate in English (FCE) exam, aimed at upper-intermediate stu-dents of English across various L1s, and was presented in Yannakoudakis et al. (2011). This FCE corpus2 con-sists of a subset of 1244 texts of the Cambridge Learner Corpus,3and is manually annotated with errors and their corrections, as well as a classification according to an error typology, as in Figure 1.
Yannakoudakis et al. (2012) present their English Profile (EP) visualiser as a way to “visually analyse as well as perform a linguistic interpretation of discrimi-native features that characterise learner English”, using the features of this essay classification task. They de-fine a measure of co-occurrence of features, among themselves and with errors, as a core part of their analysis. Given the set of all sentences in the corpus
S ={s1, s2, . . . , s|S|}and the set of all featuresF = {f1, f2, . . . , f|F|}, a featurefi∈Fis associated with
a featurefj ∈F (i6=j,1 ≤i, j ≤M) according to
the score given in Equation (1), forsk∈S,1≤k≤N 2http://ilexir.co.uk/applications/
ep-visualiser/
3http://www.cup.cam.ac.uk/gb/elt/
catalogue/subject/custom/item364603/
andexists()a binary function returning true if the input feature occurs insk.
scoreff(fj, fi) = P|S|
k=1exists(fj, fi, sk) P|S|
k=1exists(fi, sk)
(1)
They mention an analogous measure for feature-error co-occurrence; we assume given the set of all errors
E={e1, e2, . . . , e|E|}that this is defined as follows:
scoreef(fj, ei) = P|S|
k=1exists(fj, ei, sk) P|S|
k=1exists(ei, sk)
(2)
A graph is defined with features and errors as vertices; an edge between features (resp. features and errors) is established ifscoreff()(resp. scoreef) is within some
user-defined range. This graph of feature–feature (resp. feature–error) relationships is then presented visually.
The paper then presents a case study of how the EP vi-sualiser can be used to assist SLA researchers. The case study starts by noting thatRG_JJ_NN1is the 18th most discriminative negative feature from the essay classi-fier; then, further inspecting the graph of discriminative features, that it’s linked toJJ_NN1_IIandVBZ_RG. Then, looking at feature-error relations, it investigates an association with error MD (missing determiner), and presents some examples that match the features (e.g.
Unix is very powerful system but there is one thing against it), along with a discussion of relationships to various L1s. It is this process of finding interesting fea-tures and linking them to particular errors and L1s that we present an approach to automating in this paper.
3 Task Definition & Experimental Setup
At a general level, our goal is to find which kinds of constructions (in a loose sense) centred around errors are particularly characteristic of various L1s.
The specific task we define for this paper, then, is to select a set of features (in the terminology of Yan-nakoudakis et al. (2012))—which we refer to as the
ERROR CONTEXT—that, when combined with the
er-ror, show a strong association with L1, in a manner we describe below. So, for example, this may involve finding that an MD error in the context ofRG_JJ_NN1, JJ_NN1_IIandVBZ_RGshows a strong association with L1. We investigate a number of models for this selection process: the task then is the identification of which models produce poor error contexts (which will not rank highly in hypothesis testing) and which pro-duce good ones (potentially worth considering by an SLA researcher). Below we discuss the data we use, the measure of association for an error and its context, the set of errors chosen, and the models for selecting context.
3.1 Data
Verb Agreement <p>Some people <ns type="AGV"><i>says</i><c>say</c></ns> ...</p> Incorrect Verb <p>The day I <ns type="IV"><i>shaked</i><c>shook</c></ns> their Inflection hands,...</p>
[image:3.595.136.228.154.265.2]Missing Determiner <p>I am <ns type="MD"><c>a</c></ns> really good singer.</p>
Figure 1: FCE corpus examples. Error types indicated by<ns type>...</ns>; errors indicated by<i>...</i>; corrections indicated by<c>...</c>.
language size ChineseCHI 66 FrenchFRE 146
GermanGER 69
ItalianITA 76
JapaneseJAP 81
KoreanKOR 86
SpanishSPA 200
[image:3.595.367.468.155.292.2]TurkishTUR 75
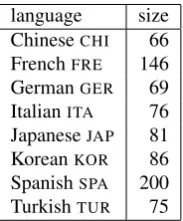
Table 1: FCESUB, broken down by language
(2012). The full FCE corpus consists of 1244 scripts over 16 languages; script counts range from 2 (Dutch) to 200 (Spanish).
The features used by Yannakoudakis et al. (2012) were derived from their essay classification task. As we are interested in associations with L1, we instead use features from a system submitted to the NLI shared task (Anonymous, 2013), which was applied to a dataset of Test of English as a Foreign Language (TOEFL) scripts: the task and its designated corpus are described in the task overview paper (Tetreault et al., 2013). In this work we use a system trained on the TOEFL11 corpus con-sisting of texts written in English from speakers of 11 different L1s, with 1100 essays per L1 and balanced across topic. We only use PoS n-grams (n= 1,2,3) as features in this work. Note that we use the terminology of Yannakoudakis et al. (2012) here: what had their origin as features in the essay classification task are still referred to as features in the visualisation tool, although the task carried out there is not a classification one. Sim-ilarly, we refer to our PoS n-grams as features, although we are not classifying errors using these features and so are not carrying out feature selection for the typical purpose of optimising classification performance.
For this, as did Yannakoudakis et al. (2012), we use the RASP parser (Briscoe et al., 2006) for tagging; the tags are consequently from the CLAWS2 tagset,4which are more fine-grained in terms of linguistic analysis than the more frequently used Penn Treebank tags.
For our task, we then used the subset of the FCE cor-pus where the languages overlapped with the TOEFL11 corpus: we refer to this as FCESUB. This gives 799
scripts over 8 languages, distributed as in Table 1; a positive byproduct is that the L1s are more similar in size than the full FCE corpus.
4http://ucrel.lancs.ac.uk/claws2tags.
html
language mean
CHI 0.885790
FRE 0.460894 GER 0.366587 ITA 0.581401 JAP 1.058159 KOR 1.067211 SPA 0.472253 TUR 1.014129
F-stat 18.031 sig. <0.001
Table 2: ANOVA results giving mean score (number of sentences with MD error per 10 sentences) for each language, the ANOVA F-statistic, and significance value
3.2 Association Measure
We noted in§1 that SLA studies such as Di´ez-Bedmar and Papp (2008) use standard hypothesis testing tech-niques. We take this as a starting point. We could, for example, evaluate whether a particular raw error (that is, without a feature context) is strongly associated with L1s by using a single factor ANOVA test.5The indepen-dent variable would be the L1. The depenindepen-dent variable could be one of a number of alternatives; we choose the number of sentences with a particular error per 10 sen-tences.6To illustrate, we give the ANOVA results from FCESUBfor the MD error in Table 2. The ANOVA
calculation is based on an F-statistic which compares variance between treatments against variance within treatments; this is compared against critical values for the F-statistic to determine statistical significance. The expected value of the F-statistic under the null hypoth-esis is 1, with values above 1 increasingly inconsistent with the null hypothesis. The data in Table 2 shows that the MD error does vary significantly with L1; a post-hoc Tukey HSD test lets us identify which specific languages exhibit this difference and shows that, for example (and as can be observed in the means), German L1 speakers are significantly different from Korean L1 speakers in the occurrence of MD errors.
For our task we are not interested in significance per se. Rather, we are interested in whether we can find oc-currences of errors plus contexts that are more strongly associated with, or that vary across, L1s, e.g. that an
5See, e.g., Jackson (2009).
6We note that the texts differ significantly in length by L1,
type name F-stat p-val N
DJ Wrong Derived 3.27 .002 332
Adjective
DN Wrong Derived 0.70 .671 294
Noun
MD Missing Determiner 18.03 .000 1702
MT Missing Preposition 2.81 .007 985
UD Unnecessary Determiner 1.20 .301 807
UT Unnecessary Preposition 0.26 .968 689
[image:4.595.72.292.61.164.2]UV Unnecessary Verb 0.78 .606 317
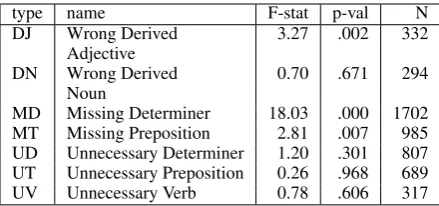
Table 3: Error types chosen for evaluation, including F-statistic, ANOVA p-value and corpus count of sentences containing error.
MD error in the context ofRG_JJ_NN1,JJ_NN1_II andVBZ_RGis more strongly associated with L1s; and we are also interested in which of our proposed methods for identifying an error’s feature context does this best. For this purpose, then, we use just the F-statistic from the ANOVA test, this time with the dependent variable as the ratio of occurrences of error plus error context per 10 sentences: a higher F-statistic shows a stronger association with L1s.7
We also consider theχ2-statistic from Pearson’s
chi-squared test, noting that it is also used in SLA hypothe-sis testing and that it was additionally found by Swanson and Charniak (2013) to be good at distinguishing inter-esting features in their related task (see§5 for more detail). The F-statistic andχ2-statistic are closely
re-lated: a random variate of the F-distribution is the ratio of two chi-squared variates scaled by their degrees of freedom. A difference is thatχ2compares observed
versus expected counts rather than proportions: to take account of the differing text lengths, our observed fre-quency is the number of sentences with error and error context per L1; our expected frequency is the total num-ber of sentences with that error and error context scaled according to the proportion of sentences labelled with that L1 relative to the corpus as a whole.
3.3 Errors Chosen
From the 74 error types in the FCE corpus, we select a subset to evaluate our models. In addition to the MD er-ror used in the case study of Yannakoudakis et al. (2012), we choose a subset which has a range of F-statistic val-ues as described above: some show very similar patterns across L1s (i.e. with low F-statistic), such as DN Wrong Derived Noun (e.g.hotvsheat); others do vary signif-icantly with L1, such as DJ Wrong Derived Adjective (e.g. reasonallyvsreasonable). Having errors with a range of F-statistic values lets us evaluate whether finding good error contexts works only for strongly L1-associated errors, weakly L1-L1-associated errors, or across
7As we are only using the F-statistic to evaluate ranks, we
do not need a multiple comparison adjustment such as the Bonferroni correction: this would only apply for comparisons to a significance threshold, and in any case the Bonferroni is monotonic and does not affect rankings.
the spectrum. Our subset is in Table 3, along with their F-statistic, ANOVA p-value and counts in FCESUB. 3.4 Models
We propose four models for choosing error contexts. These models rank error contexts; we evaluate the ranked error contexts by F-statistic andχ2-statistic
val-ues (§3.2).
ERRORCOOCC In this model we rank features by
error-feature co-occurrence scores given by Equation (2). The L1 is not taken into account, so this will just return common features which may be equally strongly associated with errors across all L1s. We look at results for whenk = 1..3features are chosen. Fork = 2,3, we add the individual error-feature scores together for the ranking.8It may be the case that interesting results could be obtained fork >3, but we only look at the
k = 1..3in this preliminary work to see if there are any discernible trends suggesting that larger values ofk
could help.
L1ASSOC Here we use features that are strongly
as-sociated with the L1s from the TOEFL11 corpus and NLI shared task. Specifically, we rank features by their Information Gain with respect to L1s as in the process of feature selection from the shared task.9 The relationship between errors and features (in the form of error-feature co-occurrence scores) is not taken into account here. Again, we look at results for whenk = 1..3features are chosen, and fork = 2,3, we add the individual error-feature scores together for the ranking.
MAXWEIGHTCLIQUE Both of the preceding
mod-els look only at one factor that might be relevant: error-feature scores (finding error-features that are related to the errors) and a measure of the association of features with L1s; but there is no link between them, and interaction of features is not taken into account. In Yannakoudakis et al. (2012), the visualiser provides to the SLA re-searcher a graph showing the relatedness of features, based on Equation (1), and the SLA researcher com-bines this with error-feature scores to find interesting candidate error contexts; we create a similar graph and aim to imitate the process by incorporating error-feature scores as follows.
We define a weighted undirected graphG= (V, A) such thatV is the set of features used in the above models (i.e. PoS n-grams from ERRORCOOCC);Ais
defined such that(vi, vj)∈Afor verticesvi, vj ∈V
if 0.8 ≤ scoreff(vi, vj) ≤ 1.0 wherescoreff()is as
defined as in Equation (1).10 Given our set of errors
Edefined at Equation (2) above, the weight of a ver-tex vi is defined as scoreef(vi, ej)for someej ∈ E.
8Fork= 2the combinations were made from the top 100
features fromk= 1, and fork= 3from the top 50.
9We recalculated this over the subset of eight languages
used in this paper.
10We choose this threshold value as it is the one used in the
model r
ERRORCOOCC 0.95
L1ASSOC 0.97
MAXWEIGHTCLIQUE 0.95
[image:5.595.106.258.60.124.2]MAXWEIGHTCLIQUE-L1 0.92
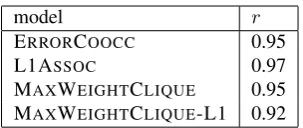
Table 4: Average correlation coefficientrbetween F-statistic andχ2-statistic for each model
Given this graph, it is possible to characterise the find-ing of related features with strong aggregate associations with errors as an instance of the MAXIMUM WEIGHT
CLIQUE PROBLEM(Bomze et al., 1999). As the name
suggests, this finds a clique of maximum weight, here the strongest aggregate feature–error association. While this is an NP-hard problem, there are quite efficient algo-rithms for solving it; we use one proposed by ¨Osterg˚ard (1999).11
MAXWEIGHTCLIQUE-L1 We also look at a
vari-ant of MAXWEIGHTCLIQUE where we construct the
graphs based only on relationships among features for a particular L1. That is, there will be eight weighted graphs per error of interest.
4 Results and Discussion
4.1 Overall Results
We only present the F-statistic results here; the χ2
-statistic showed very similar patterns. The average correlation between the two for each model shows the strong similarity (Table 4).
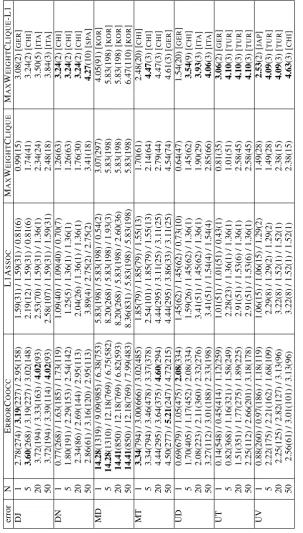
For the F-statistic results, presented in Table 5, we report the highest F-statistic in theN-best list (N = 1,5,20,50) for each model. For models ERRORCOOCC
and L1ASSOCwe report the highest F-statistic for each
value ofk(k = 1,2,3). The number of occurrences of the error context with the highest F-statistic is given in parentheses after the F-statistic; the highest value for eachN is in bold. For MAXWEIGHTCLIQUE-L1,
we also note the language of the graph from which the highest score was derived.
We note by comparing Table 5 with Table 3 that for each error type except for MD, it is possible to find an error context that is more strongly associated with L1s than is the raw error type alone. For MD this is not surprising, as its frequency of occurrence is very strongly linked to the L1, as noted in Table 2 and§3.2.12 (For the error type MT also, no model produces an error context more strongly associated with the L1 for the single best choice whereN = 1, but does for larger values ofN.)
11Code for the usedwcliqueis available athttp://tcs.
legacy.ics.tkk.fi/˜pat/wclique.html.
12The fact that determiner errors are very widely studied in
terms of analysing cross-linguistic influence suggests a broad consensus that they vary strongly with L1. In addition to Di´ez-Bedmar and Papp (2008), a sample of other studies includes Parrish (1987), Young (1996) and Ionin and Montrul (2010).
With respect to the individual models, the simple ER -RORCOOCCscores highly, giving the best result about
half the time, and the best results can occur for any ofk = 1,2,3. The number of instances returned for each error plus error context is larger than for the other models as well, which is not surprising as the model aims to find contexts strongly associated with the errors rather than with L1s. However, these are then likely to be features that are fairly common across L1s; we look at some examples in§4.2.
L1ASSOCperforms fairly poorly on our evaluation measure, although in many cases it does find an error context more strongly associated with the L1 than just the raw error type. Counts are also lower. Also, for this model,k= 2,3are always worse thank= 1: bringing in a second context feature reduces the number of oc-currences to such an extent that the F-statistic can drop dramatically. This is probably in part an artefact of the size of the FCE corpus (and particularly our FCESUB
subcorpus): these features derived from the TOEFL11 corpus just do not occur sufficiently often in our evalua-tion corpus (and in fact there are often large numbers of zero occurrences fork= 2,3).
MAXWEIGHTCLIQUE also performs fairly poorly.
However, in many cases it also finds an error context more strongly associated with L1 than the raw error type alone (DN, MT, UD, UT, UV), even if not always for
N = 1, and it has intermediate counts of occurrences. MAXWEIGHTCLIQUE-L1 gives the best results in
the other half of the cases where ERRORCOOCCdoes
not. The error contexts that it finds, however, are very specific, often to a single language (as might be expected by its definition) with very small numbers of counts.
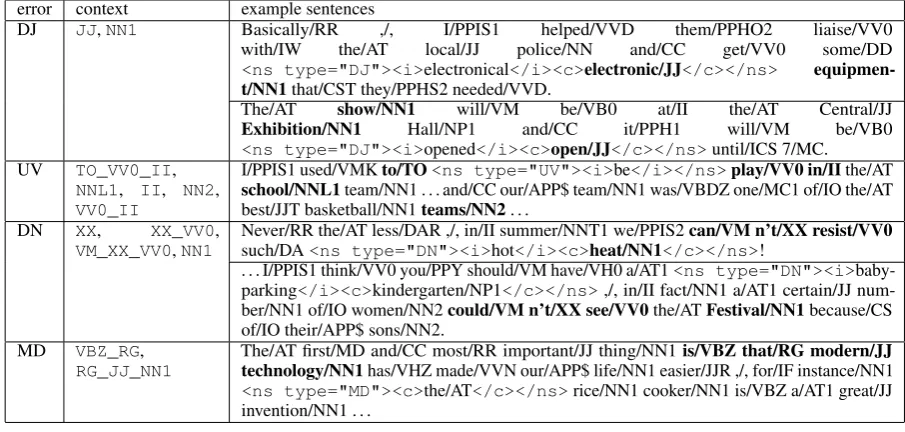
4.2 Some Examples
We look at some examples in Figure 2, to illustrate both interesting error contexts found and areas where the models do a poor job. In these sample sentences, only errors of interest are retained and highlighted.
The DJ error with context{JJ,NN1}illustrates the top result found under the ERRORCOOCC model for
N = 20. In the first sentence the model seems to find a useful pattern: the adjective that is at the centre of the error occurs in the context of a singular noun. On the other hand, the second sentence illustrates a problem: because the range of the context is the whole sentence, frequent features such asNN1will occur a lot in other parts of the sentence that have no apparent relation to the actual error. The ERRORCOOCCmodel is thus likely to be picking up false positives by virtue of the relatively high frequencies of its error contexts.
error context example sentences
DJ JJ,NN1 Basically/RR ,/, I/PPIS1 helped/VVD them/PPHO2 liaise/VV0
with/IW the/AT local/JJ police/NN and/CC get/VV0 some/DD
<ns type="DJ"><i>electronical</i><c>electronic/JJ</c></ns> equipmen-t/NN1that/CST they/PPHS2 needed/VVD.
The/AT show/NN1 will/VM be/VB0 at/II the/AT Central/JJ
Exhibition/NN1 Hall/NP1 and/CC it/PPH1 will/VM be/VB0 <ns type="DJ"><i>opened</i><c>open/JJ</c></ns>until/ICS 7/MC. UV TO_VV0_II,
NNL1, II, NN2, VV0_II
I/PPIS1 used/VMKto/TO<ns type="UV"><i>be</i></ns>play/VV0 in/IIthe/AT school/NNL1team/NN1 . . . and/CC our/APP$ team/NN1 was/VBDZ one/MC1 of/IO the/AT
best/JJT basketball/NN1teams/NN2. . .
DN XX, XX_VV0,
VM_XX_VV0,NN1 Never/RR the/AT less/DAR ,/, in/II summer/NNT1 we/PPIS2such/DA<ns type="DN"><i>hot</i><c>heat/NN1</c></ns>can/VM n’t/XX resist/VV0!
. . . I/PPIS1 think/VV0 you/PPY should/VM have/VH0 a/AT1<ns type="DN"><i>
baby-parking</i><c>kindergarten/NP1</c></ns>,/, in/II fact/NN1 a/AT1 certain/JJ
num-ber/NN1 of/IO women/NN2could/VM n’t/XX see/VV0the/ATFestival/NN1because/CS
of/IO their/APP$ sons/NN2. MD VBZ_RG,
[image:7.595.70.523.63.279.2]RG_JJ_NN1 The/AT first/MD and/CC most/RR important/JJ thing/NN1technology/NN1has/VHZ made/VVN our/APP$ life/NN1 easier/JJR ,/, for/IF instance/NN1is/VBZ that/RG modern/JJ <ns type="MD"><c>the/AT</c></ns>rice/NN1 cooker/NN1 is/VBZ a/AT1 great/JJ invention/NN1 . . .
Figure 2: Examples for sample error types and specific error contexts. Error contexts are bolded.
connection.
The DN error with context { XX, XX_VV0, VM_XX_VV0,NN1}illustrates the top result found un-der the MAXWEIGHTCLIQUE-L1 model forN = 50. A number of this reasonably sized set are similar to the first sentence, where the context appears interesting. In this example,hotis used forheat; the other examples of this type are from Spanish and Italian (similarly, e.g.,
liveforlife), where the error seems to be connected to words where the English derivational morphology is not simply affixation. However, there are some like the second sentence, where (as for the DJ error) the error context appears in a different clause, and likely irrelevant.
The MD error in the last row we examine because (a more complex version of) it was the focus of the case study in Yannakoudakis et al. (2012), which from the examples of that paper looked quite convincing as an error context of relevance to SLA research. However, it and the related examples of Yannakoudakis et al. (2012) were not in the publicly available corpus,13and in fact there is only one example of this error and context in the whole FCE corpus, illustrating the issue of data sparsity. Further, this example also illustrates the issue of tagging error: thatis tagged as RG(degree adverb) where it should beCST.
So as might be anticipated from the frequency num-bers in Table 5, the MAXWEIGHTCLIQUE-L1 model
produces context that looks interesting from an SLA per-spective, but is relatively limited in scope; the ERROR
-COOCCmodel produces a much larger set of candidates,
and can successfully find error context such that they behave differently with respect to the L1s according to the ANOVA F-statistic, but produces false positives. Overall, a recurring issue illustrated for all models by
13We assume that the multiple examples come from the
larger CLC corpus.
the examples is the proposal of error context far away from any likely relevance to SLA.
5 Related Work
While Native Language Identification (NLI) as a sub-field of NLP has seen much new work in the last few years — the papers from the shared task (Tetreault et al., 2013) provide a recent sample — the emphasis on optimising classification task results, for example by using classifier ensembles (Malmasi et al., 2013), ver-sus analysing features for relevance to other tasks has varied. Below we discuss works which directly look at how features might be related to language-learning tasks or SLA research.
The seminal work of Koppel et al. (2005) that pre-sented NLI as a classification task included, in addition to standard lexical and PoS n-gram features, errors made by the writers; these errors were automatically identi-fied using Microsoft Word grammar checker. Kochmar (2011) used the FCE corpus for NLI, including the man-ually annotated errors as features, and presented an anal-ysis of usefulness of features (including errors) with respect to L1.
Wong and Dras (2011) used syntactic features on the basis of SLA theory that posits that L1 constructions may be reflected in some form of characteristic errors or patterns in L2 constructions to some extent, or through overuse or avoidance of particular constructions in L2 (Lado, 1957; Ellis, 2008); they did note distributional differences of features related to L1. Wong et al. (2012) induced topic models over function words and PoS n-grams, where some of the topics appeared to reflect L1-specific characteristics. These works, while interested in the nature of the features, do not evaluate them except via classification accuracy.
for L1-specific constructions through Tree Substitution Grammar (TSG). Swanson and Charniak (2013) sub-sequently examine both relevancy and redundancy of features through a number of metrics (including the
χ2-statistic used in this paper). They then extend a
Bayesian induction model for TSG inference based on a supervised mixture of hierarchical grammars, in order to extract a filtered set of more linguistically informed features that could benefit both NLI and SLA research; an aim was to find relatively rare features that are nev-ertheless useful for L1 prediction. Swanson and Char-niak (2014) continue on from this with a data-driven approach to inferring possible relationships between L1 and L2 structures, again using TSGs. Malmasi and Dras (2014c) also propose a method for identifying potential language transfer effects by using additional linguistic features such as adaptor grammars and grammatical de-pendencies to analyse differences in learner language. This body of work thus shares some similarities with the present paper, but our focus is on errors rather than on the distributional differences, and we look at error con-texts that may not constitute a TSG tree or grammatical dependency.
Coming from a linguistic perspective, the works in Jarvis and Crossley (2012) use Linear Discriminant Analysis for classification of texts by L1, and identify interesting features by a stepwise feature selection pro-cess in the course of classification, rather than via the measurement of their variability across L1s as here.
More recently, several of these NLI techniques have been adapted and applied to languages other than En-glish, such as Arabic and Chinese (Malmasi and Dras, 2014a; Malmasi and Dras, 2014b).
6 Conclusion
In this paper, prompted by work on using computa-tional visualisation techniques to help SLA researchers form hypotheses about errors and the environments in which they are made, we have defined a new task for finding interesting contexts for errors that vary with the native language of the speaker. We proposed four models, ranging from one based on simple error-feature co-occurrence statistics to one based on the maximum weighted clique on an L1-specific feature association graph; these all managed to find contexts that were more strongly associated with L1s than the raw errors alone, and produced (albeit with many false positives in the case of the simple model) some error contexts that look potentially useful for SLA.
This paper is largely intended to prompt more work on applying NLP techniques to SLA more broadly. As such, there are many ways in which the work could be further developed. First, to get rid of obviously incor-rect cases, the size of the area over which the feature-feature and feature-feature-error scores are calculated could be restricted, perhaps to the relevant clause or a certain window size. Second, it may not be the case that the ANOVA F-statistic orχ2are the best evaluation
mea-sure: in medical work, for example, there is the notion of clinical significance, which takes effect size into ac-count and is often more relevant to the practitioner than statistical significance. Similarly, the current features may not be the most meaningful. As part of this, an im-portant step would be to bring in SLA researchers, to as-sess proposed error contexts and look at what evaluation measures best relate to this. The role of the present work would then be to rule out models for producing error contexts (like L1ASSOC) that produce weaker results in
hypothesis testing: it would thus be complementary to the visualisation work from which it stems, guiding SLA researchers away from unproductive areas of the space of possible hypotheses. And third, the size of the corpus is (as always) an issue: as these error-annotated corpora are few and far between, a semi-supervised approach or one that in some way incorporated unannotated data would be useful, perhaps using some of the extensive recent work on error annotation.
References
Immanuel M. Bomze, Marco Budinich, Panos Parda-los, and Marcello Pelillo. 1999. The Maximum Clique Problem. In D.-Z. Du and P. M. Pardalos, edi-tors,Handbook of Combinatorial Optimization (supp. Vol. A), pages 1–74. Kluwer Academic, Dordrecht, Netherlands.
Ted Briscoe, John Carroll, and Rebecca Watson. 2006. The second release of the RASP system. InProc. of the COLING/ACL Interactive Presentation Sessions, pages 77–80, Stroudsburg, PA, USA.
Ted Briscoe, Ben Medlock, and Øistein Andersen. 2010. Automated Assessment of ESOL Free Text Exami-nations. Technical Report TR-790, University of Cambridge, Computer Laboratory.
Mar´ıa Bel´en Di´ez-Bedmar and Szilvia Papp. 2008. The use of the English article system by Chinese and Span-ish learners. Language and Computers, 66(1):147– 176.
Rod Ellis. 2008.The Study of Second Language Acqui-sition, 2nd edition. Oxford University Press, Oxford, UK.
Sylviane Granger. 2011. How to Use Foreign and Sec-ond Language Learner Corpora. In Alison Mackey and Susan M. Gass, editors,Research Methods in Second Language Acquisition: A Practical Guide. Wiley-Blackwell.
Tania Ionin and Silvina Montrul. 2010. The role of L1 transfer in the interpretation of articles with definite plurals. Language Learning, 60(4):877–925. Sherri L. Jackson. 2009. Statistics: Plain and Simple.
Wadsworth, Cengage Learning, Belmont, CA, US. Scott Jarvis and Scott Crossley, editors. 2012.
Ekaterina Kochmar. 2011. Identification of a writer’s native language by error analysis. MPhil thesis, Uni-versity of Cambridge.
Moshe Koppel, Jonathan Schler, and Kfir Zigdon. 2005. Automatically determining an anonymous author’s native language. In Intelligence and Security In-formatics, volume 3495 ofLNCS, pages 209–217. Springer-Verlag.
Robert Lado. 1957. Linguistics Across Cultures: Ap-plied Linguistics for Language Teachers. Univ. of Michigan Press, Ann Arbor, MI, US.
James P. Lantolf. 2001. Sociocultural Theory and Second Language Learning. Oxford University Press, Oxford, UK.
Shervin Malmasi and Mark Dras. 2014a. Arabic Na-tive Language Identification. InProceedings of the Arabic Natural Language Processing Workshop (co-located with EMNLP 2014), Doha, Qatar, October. Association for Computational Linguistics.
Shervin Malmasi and Mark Dras. 2014b. Chinese Na-tive Language Identification. Proceedings of the 14th Conference of the European Chapter of the Associa-tion for ComputaAssocia-tional Linguistics.
Shervin Malmasi and Mark Dras. 2014c. Language Transfer Hypotheses with Linear SVM Weights. Pro-ceedings of the 2014 Conference on Empirical Meth-ods in Natural Language Processing (EMNLP). Shervin Malmasi, Sze-Meng Jojo Wong, and Mark Dras.
2013. NLI Shared Task 2013: MQ Submission. In
Proceedings of the Eighth Workshop on Innovative Use of NLP for Building Educational Applications, pages 124–133, Atlanta, Georgia, June. Association for Computational Linguistics.
Lourdes Ortega. 2009. Understanding Second Lan-guage Acquisition. Hodder Education, Oxford, UK. Patric ¨Osterg˚ard. 1999. A New Algorithm for the Maximum-Weight Clique Problem.Electronic Notes in Discrete Mathematics, 3:153–156, May.
Betsy Parrish. 1987. A New Look at Methodologies in the Study of Article Acquisition for Learners of ESL.
Language Learning, 37(3):361–384.
Manfred Pienemann. 2005. Cross-linguistic Aspects of Processability Theory. John Benjamins, Amsterdam, Netherlands.
Benjamin Swanson and Eugene Charniak. 2012. Native Language Detection with Tree Substitution Gram-mars. InProc. Meeting Assoc. Computat. Linguistics (ACL), pages 193–197.
Ben Swanson and Eugene Charniak. 2013. Extracting the native language signal for second language ac-quisition. InProc. Conf. North American Assoc. for Computat. Linguistics: Human Language Technolo-gies (NAACL-HLT), pages 85–94, Atlanta, Georgia, June.
Ben Swanson and Eugene Charniak. 2014. Data Driven Language Transfer Hypotheses. InProc. Conf. Euro-pean Assoc. for Computat. Linguistics (EACL), pages 169–173, Gothenburg, Sweden, April.
Joel Tetreault, Daniel Blanchard, and Aoife Cahill. 2013. A report on the first native language identi-fication shared task. InProceedings of the Eighth Workshop on Innovative Use of NLP for Building Ed-ucational Applications (BEA), pages 48–57, Atlanta, Georgia, June.
Sze-Meng Jojo Wong and Mark Dras. 2011. Exploiting parse structures for native language identification. In
Proc. Conf. Empirical Methods in Natural Language Processing (EMNLP), pages 1600–1610.
Sze-Meng Jojo Wong, Mark Dras, and Mark Johnson. 2012. Exploring Adaptor Grammars for Native Lan-guage Identification. InProc. Conf. Empirical Meth-ods in Natural Language Processing (EMNLP), pages 699–709.
Helen Yannakoudakis, Ted Briscoe, and Ben Medlock. 2011. A New Dataset and Method for Automatically Grading ESOL Texts. InProc. Meeting Assoc. Com-putat. Linguistics (ACL), pages 180–189.
Helen Yannakoudakis, Ted Briscoe, and Theodora Alex-opoulou. 2012. Automating Second Language Ac-quisition Research: Integrating Information Visualisa-tion and Machine Learning. InProc. EACL Workshop of LINGVIS & UNCLH, pages 35–43.