BioNLP shared Task 2013 – An Overview of the Bacteria Biotope Task
Robert Bossy
1, Wiktoria Golik
1, Zorana Ratkovic
1,2, Philippe Bessières
1, Claire Nédellec
11
Unité Mathématique, Informatique et Génome
MIG INRA UR1077 – F-78352 Jouy-en-Josas – France
2
LaTTiCe UMR 8094 CNRS, 1 rue Maurice Arnoux, F-92120 Montrouge – France
[email protected]
Abstract
This paper presents the Bacteria Biotope task of the BioNLP Shared Task 2013, which follows BioNLP-ST-11. The Bacteria Biotope task aims to extract the location of bacteria from scientific web pages and to characterize these locations with respect to the OntoBiotope ontology. Bacteria locations are crucial knowledge in biology for phenotype studies. The paper details the corpus specifications, the evaluation metrics, and it summarizes and discusses the participant results.
1
Introduction
The Bacteria Biotope (BB) task extends the BioNLP 2013 Shared Task molecular biology scope. It consists of extracting bacteria and their locations from web pages, and categorizing the locations with respect to the OntoBiotope1 ontology of microbe habitats. The locations denote the places where given species live. The bacteria habitat information is critical for the study of the interaction between the species and their environment, and for a better understanding of the underlying biological mechanisms at a molecular level. The information on bacteria biotopes and their properties is very abundant in scientific literature and in genomic databases and BRC (Biology Resource Center) catalogues. However, the information is highly diverse and expressed in natural language (Bossy et al., 2012). The two critical missing steps for population of biology databases and biotope knowledge modeling are (1) the automatic extraction of organism/location pairs and (2) the normalization of the habitat names with respect to biotope ontologies.
1
http://bibliome.jouy.inra.fr/MEM-OntoBiotope/OntoBiotope_BioNLP-ST13.obo
The aim of the previous edition of the BB task (BioNLP-ST’11) was to solve the first information extraction step. The results obtained by the participant systems reached 45 percent F-measure. These results showed both the feasibility of the task, as well as a large room for improvement (Bossy et al., 2012).
The 2013 edition of the BB task maintains the primary objective of event extraction, and introduces the second issue of biotope normalization. It is handled through the categorization of the locations into a large set of types defined in the OntoBiotope ontology. Bacteria locations range from hosts, plant and animals, to natural environments (e.g. water, soil), including industrial environments. BB’11 set of categories contained 7 types. This year, entity categorization has been enriched to better answer the biological needs, as well as to contribute to the general problem of automatic semantic annotation by ontologies.
BB task is divided into three sub-tasks. Entity detection and event extraction are tackled by two distinct sub-tasks, so that the contribution of each method could be assessed. A third sub-task conjugates the two in order to measure the impact of the method interactions.
2
Context
Biological motivation.
Today, new sequencing methods allow biologists to study complex environments such as microbial ecosystems. Therefore, the sequence annotation process is facing radical changes with respect to the volume of data and the nature of the annotations to be considered. Not only do biochemical functions still need to be assigned to newly identified genes, but biologists have to take into account the conditions and the properties of the ecosystems in which microorganisms are living and are identified, as well as the interactions and relationships developed with their environment and other
living organisms (Korbel et al., 2005). Metagenomic studies of ecosystems yield important information on the phylogenetic composition of the microbiota. The availability of bacteria biotope information represented in a formal language would then pave the way for many new environment-aware bioinformatic services. The development of methods that are able to extract and normalize natural language information at a large scale would allow us to rapidly obtain and summarize information that the bacterial species or genera are associated with in the literature. In turn, this will allow for the formulation of hypotheses regarding properties of the bacteria, the ecosystem, and the links between them.
The pioneering work on EnvDB (Pignatelli et al., 2009) aimed to link GenBank sequences of microbes to biotope mentions in scientific papers. However, EnvDB was affected by the incompleteness of the GenBank isolation source field, the low number of related bibliographic references, the bag-of-words extraction method and the small size of its habitat classification.
Habitat categories.
The most developed classifications of habitats are EnvO, the Metagenome classification supported by the Genomics Standards Consortium (GSC), and the OntoBiotope ontology developed by our group. EnvO (Environment Ontology project) targets a Minimum Information about a Genome Sequence (MIGS) specification (Field et al., 2008) of mainly Eukaryotes. This ambitious detailed environment ontology aims to support standard manual annotations of all types of organism environments and biological samples. However, it suffers from some limitations for bacterial biotope descriptions. A large part of EnvO is devoted to environmental biotopes and extreme habitats, whilst it fails to finely account for the main trends in bacteria studies, such as their technological use for food transformation and bioremediation, and their pathogenic or symbiotic properties. Moreover, EnvO terms are often poorly suited for bacteria literature analysis (Ratkovic et al., 2012).
The Metagenome Classification from JGI of DOE (Joint Genome Institute, US Department Of Energy) is intended to classify metagenome projects and samples according to a mixed typology of habitats (e.g. environmental, host) and their physico-chemical properties (e.g. pH, salinity) (Ivanova et al., 2010). It is a valuable
source of vocabulary for the analysis of bacteria literature, but its structure and scope are strongly biased by the indexing of metagenome projects. The OntoBiotope ontology is appropriate for the categorization of bacteria biotopes in the BB task because its scope and its organization reflect the scientific subject division and the microbial diversity. Its size (1,756 concepts) and its deep hierarchical structure are suitable for a fine-grained normalization of the habitats. Its vocabulary has been selected after a thorough terminological analysis of relevant scientific documents, papers, GOLD (Chen et al., 2010) and GenBank, which was partly automated by term extraction. Related terms are attached to the OntoBiotope concept labels (i.e. 383 synonyms), improving OntoBiotope coverage of natural language documents.
Its structure and a part of its vocabulary have been inspired by EnvO, the Metagenome classification and the small ATCC (American Type Collection Culture) classification for microbial collections (Floyd et al., 2005). Explicit references to 34 EnvO terms are given in the OntoBiotope file. Its main topics are:
- « Artificial » environments (industrial and domestic), Agricultural habitats, Aquaculture habitats, Processed food;
- Medical environments, Living organisms, Parts of living organisms, Bacteria-associated habitats;
- « Natural » environment habitats, Habitats wrt physico-chemical property (including extreme ones);
- Experimental medium (i.e. experimental biotopes designed for studying bacteria). The structure, the comprehensiveness and the detail of the habitat classification are critical factors for research in biology. Biological investigations involving the habitats of bacteria are very diverse and still unanticipated. Thus, shallow and light classifications are insufficient to tackle the full extent of the biological questions. Indexing genomic data with a hierarchical fine-grained ontology such as OntoBiotope allows us to obtain aggregated and adjusted information by selecting the right level or axis of abstraction.
Bacteria Biotope Task.
in PubMed abstracts. These features make the task both useful and feasible with a reduced investment in biology. Its linguistic characteristics, high frequency of anaphora, entities denoted by complex nominal expressions raised interesting question for BioNLP that have been treated for a long time in the general and the biomedical domains.
3
Task description
The BB Task is split into two secondary goals: 1. The detection of entities and their
categorization(s) (Sub-task 1).
2. The extraction of Localization relations given the entities (sub-task 2)
Sub-task 1 involves the prediction of habitat entities and their position in the text. The participant also has to assign each entity to one or more concepts of the OntoBiotope ontology: the categorization task. For instance, in the excerpt Isolated from the water of abalone farm, the entity abalone farm should be assigned the OntoBiotope category fish farm.
Sub-task 2 is a relation extraction task. The schema of this task contains three types of entities:
- The Habitat type is the same as in sub-task 1.
- Geographical entities represent location and organization named entities.
- Bacteria entities are bacterial taxa.
Additionally, there are two types of relations illustrated by Figure 1.
- Localization relations link Bacteria to the place where they live (either a Habitat or a Geographical).
- PartOf relations relate couples of Habitat entities, a living organism, which is a host (e.g. adult human), and a part of this living organism (e.g. gut).
Bifidobacterium longum. This organism is
found in adult humans and formula fed infants
as a normal component of gut flora.
Figure 1. Example of a localization event in the BB Task.
Sub-task 2 participants are provided with document texts and entities, and should predict the relations between the candidate entities.
Sub-task 3 is the combination of these two sub-tasks. It consists of predicting both the entity positions and the relations between entities. Compared to sub-task 1, the systems have to predict Habitat entities, but also Geographical and Bacteria entities. It is similar to the BB task of BioNLP-ST’11, except that no categorization of the entities is required.
4
Corpus description
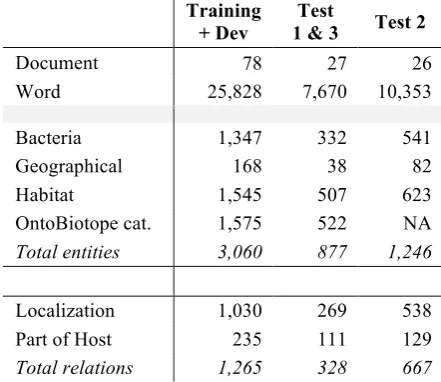
The BB corpus document sources are web pages from bacteria sequencing projects, (EBI, NCBI, JGI, Genoscope) and encyclopedia pages from MicrobeWiki. The documents are publicly available. Table 1 gives the distribution of the entities and relations in the corpora per sub-task.
Training + Dev
Test
1 & 3 Test 2
Document 78 27 26
Word 25,828 7,670 10,353
Bacteria 1,347 332 541
Geographical 168 38 82
Habitat 1,545 507 623
OntoBiotope cat. 1,575 522 NA
Total entities 3,060 877 1,246
Localization 1,030 269 538
Part of Host 235 111 129
[image:3.595.304.525.289.480.2]Total relations 1,265 328 667
Table 1. BB’13 corpus figures.
The categorization of entities by a large ontology (sub-task 1) offers a novel task to the BioNLP-ST community; a close examination of the annotated corpus allowed us to anticipate the challenges for participating teams. A total of 2,052 entities have been manually annotated for sub-task 1 (training, development and test sets together). These entities have 1,036 distinct surface forms, which means that an entity surface form is repeated a little less than twice, on average. However, only a quarter of the surface forms are actually repeated; three quarters are unique in the corpus. Moreover, 60% of habitat entities have a surface form that does not match one of the synonyms of their ontology concept. This configuration suggests that methods that simply propagate surface forms and concept attributions from ontology synonyms and from training entities would be inefficient. We have developed a baseline prediction that projects the ontology synonyms and the training corpus
Localization Localization
habitat surface forms onto the test. This prediction scores a high Slot Error Rate of 0.74. We also note there are a few ambiguous forms (i.e. 112 forms) that are synonyms in several different concepts or that do not always denote a habitat, and a few entities are assigned more than one concept (i.e. 42 of them). These are difficult cases that require prediction methods capable of word sense disambiguation. The low number of ambiguous occurrences has a low impact on the participant scores, although their presence may motivate more sophisticated methods.
5
Annotation methodology
The methodology of entity position and relations annotation is similar to BB Task’11. It involved seven scientists who participated in a double-blind annotation (each document was annotated twice), followed by a conflict resolution phase. They used the AlvisAE annotation editor (Papazian et al., 2012). The guidelines included some improvements that are detailed below.
Boundaries.
Habitat entities may be either names or adjective. In the case of adjectives, the head is included in the entity span if it denotes a location (e.g. intestinal sample) and is excluded otherwise (e.g. hospital epidemic). The entity spans may be discontinuous, which is relevant for overlapping entities like ground water and surface water in ground and surface water. The major change is the inclusion of all modifiers that describe the location in the habitat entity span. This makes the entity more informative and the entity boundaries easier to predict, and less subject to debate. For instance, in the example,
isolated from the water of an abalone farm, the water entity extends from water to farm. Note that in sub-task 1, all entities have to be predicted, even when not involved in a relation. This led to the annotation of embedded entities as potential habitats for bacteria, such as abalone farm and abalone in the above example.
Equivalent sets of entities.
As in BB’11, there are many equivalent mentions of the same bacteria in the documents that play a similar role with respect to the Localization relation. Selecting only one of them as the gold reference would have been arbitrary. When this is the case, the reference annotation includes equivalent sets of entities that convey the same information(e.g. Borrelia garinii vs. B. garinii, but not Borrelia).
Category assignment.
The assignment of categories to habitat entities has been done in two steps: (i) an automatic pre-annotation by the method of Ratkovic et al., (2012) and (ii) a manual double-blind revision followed by a conflict resolution phase.
In the manual annotation phase, the most frequent conflicts between annotators were the same as in the previous edition. They involved the assignment of entities to either the living organism category, organic matter or food. An example is the cane entity in cane cuttings. To handle these cases, the guidelines assert that a dead organism cannot be assigned to a living organism category.
The high quality of the pre-annotation and its visualization and revision using the AlvisAE annotation editor notably sped-up the annotation process. Table 2 summarizes the figures of the annotation. For sub-task 1, the pre-annotation consisted of assigning OntoBiotope categories to entities for the whole corpus (train+dev+test). The pre-annotation yielded very high results with an F-measure of almost 90%. The pre-annotation was also useful to assess the relevance of the OntoBiotope ontology for the BB task. For sub-task 2, the pre-annotation consisted of the detection of entities in the test set, where no categorization is needed. The second line in Table 2 shows that the recall of entity detection affects the F-score, but that it still made the prediction helpful for the annotators. Further data analysis revealed that the terminology-based approach of the pre-annotation poorly detected the correct boundaries of embedded entities, thereby decreasing the recall of the entity recognition.
Recall Precision F1 Corpus sub-task1 89.7% 90.1% 89.9% Test sub-task 2 47.3% 95.7% 63.3%
Table 2. Pre-annotation scores.
6
Evaluation procedure
The evaluation procedure was similar to the previous edition in terms of resources, schedule and metrics except that an original relevant metric was developed for the new problem of entity categorization in a hierarchy.
6.1
Campaign organizationthe test sets. Participating teams then had ten days to submit their predictions. As with all BioNLP-ST tasks, each participant submitted a single final prediction for each BB sub-task. The detailed evaluation results were computed, provided to the participants and published on the BioNLP website two days after the submission deadline.
6.2
Evaluation metrics Sub-task 1.In this sub-task participants were given only the document texts. They had to predict habitat entities along with their categorization with the OntoBiotope ontology. The evaluation of sub-task 1 takes into account the accuracy of the boundaries of the predicted entities as well as of the ontology category.
Entity pairing.
The evaluation algorithm performs an optimal pairwise matching between the habitat entities in the reference and the predicted entities. We defined a similarity between two entities that takes into account the boundaries and the categorization. Each reference entity is paired with the predicted entity for which the similarity is the highest among non-zero similarities. If the boundaries of a reference entity do not overlap with any predicted entity, then it is a false negative, or a deletion. Conversely, if the boundaries of a predicted entity do not overlap with any reference entity, then it is a false positive, or an insertion.
If the similarity between the entities is 1, then it is a perfect match. But if the similarity is lower than 1, then it is a substitution.
Entity similarity.
The similarity M between two entities is defined as:
M = J . W
J measures the accuracy of the boundaries between the reference and the predicted entities. It is defined as a Jaccard Index adapted to segments (Bossy et al., 2012). For a pair of entities with the exact same boundaries, J equals to 1.
W measures the accuracy between the ontology concept assignment of the reference entity and the predicted concept assignment of the predicted entity. We used the semantic similarity proposed by Wang, et al. (2007). This similarity compares the set of all ancestors of the concept assigned to the reference entity and the set of all ancestors of
the concept assigned to the predicted entity. The similarity is the Jaccard Index between the two sets of ancestors; however, each ancestor is weighted with a factor equal to:
dw
where d is the number of steps between the attributed concept and the ancestor. w is a constant greater than zero and lower than or equal to 1. If both the reference and predicted entities are assigned the same concept, then the sets of ancestors are equal and W is equal to 1. If the pair of entities has different concept attributions, W is lower than 1 and depends on the relative depth of the lowest common ancestor. The lower the common ancestor is, the higher the value of W. The exponentiation by the w constant ensures that the weight of the ancestors decreases non-linearly. This similarity thus favors predictions in the vicinity of the reference concept. Note that since the ontology root is the ancestor of all concepts, W is always strictly greater than zero.
(Wang et al., 2007) showed experimentally that a value of 0.8 for the w constant is optimal for clustering purposes. However we noticed that w high values tend to favor sibling predictions over ancestor/descendant predictions that are preferable here, whilst low w values do not penalize enough ontology root predictions. We settled w with a value of 0.65, which ensures that ancestor/descendant predictions always have a greater value than sibling predictions, while root predictions never yield a similarity greater than 0.5.
As specified above, if the similarity M < 1, then the entity pair is a substitution. We define the importance of the substitution S as:
S = 1 - M
Prediction score.
Most IE tasks measure the quality of a prediction with Precision and Recall, eventually merged into an F1. However the pairing detects false positives and false negatives, but also substitutions. In such cases, the Recall and Precision factor the substitutions twice, and thus underestimate false negatives and false positives. We therefore used the Slot Error Rate (SER) that has been devised to undertake this shortcoming (Makhoul et al., 1999):
SER = (S + I + D) / N where:
- I represents the total number of insertions. - D represents the total number of deletions. - N is the number of entities in the reference. The SER is a measure of errors, so the lower it is the better. A SER equal to zero means that the prediction is perfect. The SER is unbound, though a value greater than one means that there are more mistakes in the prediction than entities in the reference.
We also computed the Recall, the Precision and F1 measures in order to facilitate the interpretation of results:
Recall =M / N Precision = M / P
where M is the sum of the similarity M for all pairs in the optimal pairing, N is the number of entities in the reference, and P the number of entities in the prediction.
Sub-task 2.
In sub-task 2, the participants had to predict relations between candidate arguments, which are Bacteria, Habitat and Geographical entities. This task can be viewed as a categorization task of all pairs of entities. Thus, we evaluate submissions with Recall, Precision and F1.
Sub-task 3.
Sub-task 3 is similar to sub-task 2, but it includes entity prediction. This is the same setting as the BB task in BioNLP-ST 2011, except for entity categorization. We used the same evaluation metrics based on Recall, Precision and F1 (Bossy et al., 2012).
The highlights of this measure are:
− it is based on the pairing between reference
and predicted relations that maximizes a similarity;
− the similarity of the boundaries of Habitat
and Geographical entities is relaxed and defined as the Jaccard Index (in the same way as in sub-task 1);
− the boundaries of Bacteria is strict: the evaluation rejects all relations where the Bacteria has incorrect boundaries.
7
Results
7.1
Participating systemsFive teams submitted ten predictions to the three BB sub-tasks. LIMSI (CNRS, France), see (Grouin, 2013) is the only team that submitted to the three sub-tasks. LIPN (U. Paris-Nord, France), (Bannour et al., 2013) only submitted to
sub-task 1. TEES (TUCS, Finland), (Björne and Salakoski, 2013) only submitted to sub-task 2. Finally, IRISA (INRIA, France), (Claveau, 2013))) and Boun (U. Boğaziçi, Turkey), (Karadeniz and Özgür), submitted to sub-tasks 1 and 2. The scores of the submissions according to the official metrics are shown in decreasing rank order in Tables 3 to 6.
Participant Rank SER F1
IRISA 1 0.46 0.57
Boun 2 0.48 0.59
LIPN 3 0.49 0.61
[image:6.595.309.519.187.259.2]LIMSI 4 0.66 0.44
Table 3. Scores for Sub-task 1 of the BB Task.
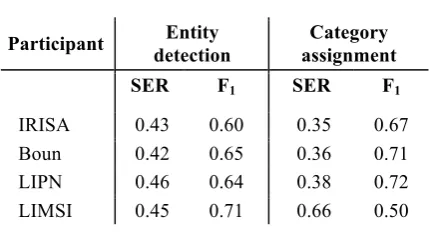
Participant Entity
detection
Category assignment
SER F1 SER F1
IRISA 0.43 0.60 0.35 0.67
Boun 0.42 0.65 0.36 0.71
LIPN 0.46 0.64 0.38 0.72
LIMSI 0.45 0.71 0.66 0.50
Table 4. Detailed scores for Sub-task 1 of the BB Task.
Participant systems to sub-task 1 obtained high scores despite the novelty of the task (0.46 SER for the 1st, IRISA). The results of the first three systems are very close despite the diversity of the methods. The decomposition of the scores of the predictions of entities with correct boundaries and their assignment to the right category are shown in Table 4. They are quite balanced with a slightly better rate for category assignment, with the exception of the LIMSI system, which is notably better in entity detection. This table also shows the dependency of the two entity detection and categorization steps. Errors in the entity boundaries affect the quality of categorization.
[image:6.595.305.520.282.398.2]a recall much lower than the precision, which may be interpreted training data overfitting.
Participant Rec. Prec. F1 PartOf F1 Loc.F1
TEES 2.1 0.28 0.82 0.42 0.22 0.49 IRISA 0.36 0.46 0.40 0.2 0.45 Boun 0.21 0.38 0.27 0.2 0.29 LIMSI 0.4 0.19 0.6 0.0 0.7
Table 5. Scores of Sub-task 2 for the BB Task. The second challenge is the high frequency of anaphora, especially with a bacteria antecedent. For BioNLP-ST 2011, we already pointed out that coreference resolution is critical in order to capture all relations that are not expressed inside a sentence.
Participant Rec. Prec. F1
TEES 2.1 0.12
(0.41)
0.18 (0.61)
0.14 (0.49)
LIMSI 0.4
(0.9)
0.12 (0.82)
0.6 (0.15)
Table 6. Scores of Sub-task 3 for the BB Task. (the relaxed scores are given in parentheses.) The results of sub-task 3 (Table 6) may appear disappointing compared to the first two sub-tasks and BB’11. Further analysis shows that the system scores were affected by their poor entity boundary detection and the PartOf relation predictions. In order to demonstrate this we computed a relaxed score that differs from the primary score by:
- removing PartOf relations from the reference and the prediction;
- accepting Localization relations even if the Bacteria entity boundaries do not match; - removing the penalty for the incorrect
boundaries of Habitat entities.
This relaxed score is equivalent to ignoring PartOf relations and considering the boundaries of predicted entities as perfect. The result is exhibited in Table 6 between parentheses. The most determinant factor is the relaxation of Bacteria entity boundaries because errors are severely penalized. An error analysis of the submitted predictions revealed that more than half of the rejected Localization predictions had a Bacteria argument with incorrect boundaries.
7.2
Systems description and result analysisThe participants deployed various assortments of methods ranging from linguistics and machine learning to hand-coded pattern-matching.
Sub-task 1 was handled in two successive steps, candidate entity detection and category assignment.
Entity detection.
The approaches combine
(1) the use of lexicons (IRISA and LIMSI), (2) then text analysis by chunking (IRISA),
noun phrase analysis (Boun), term analysis by BioYaTeA (LIPN) and Cocoa entity detection (LIMSI),
(3) with additional rules (TextMarker by LIPN) or machine learning (CRF by LIMSI) for the adaptation to the corpus.
The LIMSI system combining Cocoa entity detection (BioNLP supporting resource) with CRF obtained the best result, 11 points over the less linguistics-based approach of IRISA as shown in Table 4.
Assignment of categories to entities.
It was mainly realized using hand-coded rules (LIMSI, Boun), machine learning with Whisk (LIPN) or a similarity between ontology labels and the text entities (IRISA). It is interesting to note that although the approaches are very different, the three types of methods obtained close results ranging from 0.35 to 0.38 SER, apart one outlier.
Prediction of relations.
Sub-task 2 was completed by applying hand-coded rules (LIMSI, Boun), that were much less successful than the two machine-learning-based approaches, i.e. kNN by IRISA and multi-step SVM by TEES-2.1. In the case of TEES-2.1 attributes were generated by McCCJ parses, which may explain its success in the prediction of PartOf relations that is 20 point over the second method that did not use any parsing.
Prediction of entities and relations.
Sub-task 3 was completed by LIMSI using the successive application of its methods from sub-tasks 1 and 2. TEES-2.1 applied its multi-step SVM classification of sub-task 2 for relation prediction completed by additional SVM steps for candidate entity detection.
domains, the availability of relevant resources and the potential for improvement.
8
Conclusion
After BioNLP-ST’11, the second edition of the Bacteria Biotope Task provides a wealth of new information on the generalization of the entity categorization methods to a large set of categories. The final submissions of the 5 teams show very promising results with a broad variety of methods. The introduction of new metrics appeared appropriate to reveal the quality of the results and to highlight relevant contrasts. The prediction of events still remains challenging in documents where the candidate arguments are very dense, and where most relations involve several sentences. A thorough analysis of the results indicates clear directions for improvement.
Acknowledgments
This work has been partially supported by the Quaero program, funded by OSEO, the French state agency for innovation and the INRA OntoBiotope Network.
References
Sondes Bannour, Laurent Audibert, Henry Soldano. 2013. Ontology-based semantic annotation: an automatic hybrid rule-based method. Present volume.
Jari Björne, Tapio Salakoski. 2013. TEES 2.1: Automated Annotation Scheme Learning in the BioNLP 2013 Shared Task. Present volume. Robert Bossy, Julien Jourde, Alain-Pierre Manine A.,
Philippe Veber, Erick Alphonse, Maarten van de Guchte, Philippe Bessières, Claire Nédellec. 2012. BioNLP Shared Task - The Bacteria Track. BMC Bioinformatics 13(Suppl 11):S3, June .
Vincent Claveau. 2013. IRISA participation to BioNLP-ST 2013: lazy-learning and information retrieval for information extraction tasks. Present volume.
Liolios K., Chen I.M., Mavromatis K., Tavernarakis N., Hugenholtz P., Markowitz V.M., Kyrpides N.C. (2010). The Genomes On Line Database (GOLD) in 2009: status of genomic and metagenomic projects and their associated metadata. Nucleic Acids Res., 38(Database issue):D346-54.
EnvDB database. http://metagenomics.uv.es/envDB/
EnvO Project. http://environmentontology.org
Dawn Field et al. 2008. Towards a richer description of our complete collection of genomes and metagenomes: the “Minimum Information about a Genome Sequence” (MIGS) specification. Nature Biotechnology. 26: 541-547.
Cyril Grouin. 2013. Building A Contrasting Taxa Extractor for Relation Identification from Assertions: BIOlogical Taxonomy & Ontology Phrase Extraction System. Present volume.
İlknur Karadeniz, Arzucan Özgür. 2013. Bacteria Biotope Detection, Ontology-based Normalization, and Relation Extraction using Syntactic Rules. Present volume.
Korbel J.O., Doerks T., Jensen L.J., Perez-Iratxeta C., Kaczanowski S., Hooper S.D., Andrade M.A., Bork P. (2005). Systematic association of genes to phenotypes by genome and literature mining. PLoS Biol., 3(5):e134.
Melissa M. Floyd, Jane Tang, Matthew Kane and David Emerson. 2005. Captured Diversity in a Culture Collection: Case Study of the Geographic and Habitat Distributions of Environmental Isolates Held at the American Type Culture Collection. Applied and Environmental Microbiology. 71(6):2813-23.
GenBank. http://www.ncbi.nlm.nih.gov/ GOLD.
http://www.genomesonline.org/cgi-bin/GOLD/bin/gold.cgi
Ivanova N., Tringe S.G., Liolios K., Liu W.T., Morrison N., Hugenholtz P., Kyrpides N.C. (2010). A call for standardized classification of metagenome projects. Environ. Microbiol.,
12(7):1803-5.
John Makhoul, Francis Kubala, Richard Schwartz, and Ralph Weischedel. 1999. Performance measures for information extraction, in
Proceedings of DARPA Broadcast News
Workshop, Herndon, VA, February.
von Mering C., Hugenholtz P., Raes J., Tringe S.G., Doerks T., Jensen L.J., Ward N., Bork P. (2007). Quantitative phylogenetic assessment of microbial communities in diverse environments. Science, 315(5815):1126-30.
Metagenome Classification.
/metagenomic_classification_tree.cgi MicrobeWiki.
http://microbewiki.kenyon.edu/index.php/Microbe Wiki
Microbial Genomics Program at JGI. http://genome.jgi-psf.org/programs/bacteria-archaea/index.jsf
Miguel Pignatelli, Andrés Moya, Javier Tamames. (2009). EnvDB, a database for describing the environmental distribution of prokaryotic taxa.
Environmental Microbiology Reports. 1:198-207. Frédéric Papazian, Robert Bossy and Claire Nédellec.
2012. AlvisAE: a collaborative Web text annotation editor for knowledge acquisition. The 6th Linguistic Annotation Workshop (The LAW VI), Jeju, Korea.
Prokaryote Genome Projects at NCBI. http://www.ncbi.nlm.nih.gov/genomes/lproks.cgi Zorana Ratkovic, Wiktoria Golik, Pierre Warnier. 2012. Event extraction of bacteria biotopes: a knowledge-intensive NLP-based approach. BMC Bioinformatics 2012, 13(Suppl 11):S8, 26June. .
Javier Tamames and Victor de Lorenzo. 2010. EnvMine: A text-mining system for the automatic extraction of contextual information. BMC Bioinformatics. 11:294.