R E S E A R C H
Open Access
Adjusting tidal volume to stress index in an open
lung condition optimizes ventilation and prevents
overdistension in an experimental model of lung
injury and reduced chest wall compliance
Carlos Ferrando
1*, Fernando Suárez-Sipmann
2,3, Andrea Gutierrez
1, Gerardo Tusman
4, Jose Carbonell
1,
Marisa García
1, Laura Piqueras
5, Desamparados Compañ
6, Susanie Flores
7, Marina Soro
1, Alicia Llombart
8and Francisco Javier Belda
1Abstract
Introduction:The stress index (SI), a parameter derived from the shape of the pressure-time curve, can identify injurious mechanical ventilation. We tested the hypothesis that adjusting tidal volume (VT) to a non-injurious SI in an open lung condition avoids hypoventilation while preventing overdistension in an experimental model of combined lung injury and low chest-wall compliance (Ccw).
Methods: Lung injury was induced by repeated lung lavages using warm saline solution, and Ccw was reduced by controlled intra-abdominal air-insufflation in 22 anesthetized, paralyzed and mechanically ventilated pigs. After injury animals were recruited and submitted to a positive end-expiratory pressure (PEEP) titration trial to find the PEEP level resulting in maximum compliance. During a subsequent four hours of mechanical ventilation, VT was adjusted to keep a plateau pressure (Pplat) of 30 cmH2O (Pplat-group, n = 11) or to a SI between 0.95 and 1.05 (SI-group, n = 11). Respiratory rate was adjusted to maintain a‘normal’PaCO2 (35 to 65 mmHg). SI, lung mechanics, arterial-blood gases haemodynamics pro-inflammatory cytokines and histopathology were analyzed. In addition Computed Tomography (CT) data were acquired at end expiration and end inspiration in six animals.
Results:PaCO2 was significantly higher in the Pplat-group (82 versus 53 mmHg,P= 0.01), with a resulting lower pH (7.19 versus 7.34,P= 0.01). We observed significant differences in VT (7.3 versus 5.4 mlKg−1,P= 0.002) and Pplat values (30 versus 35 cmH2O,P= 0.001) between the Pplat-group and SI-group respectively. SI (1.03 versus 0.99,P= 0.42) and end-inspiratory transpulmonary pressure (PTP) (17 versus 18 cmH2O,P= 0.42) were similar in the Pplat- and
SI-groups respectively, without differences in overinflated lung areas at end- inspiration in both groups. Cytokines and histopathology showed no differences.
Conclusions:Setting tidal volume to a non-injurious stress index in an open lung condition improves alveolar ventilation and prevents overdistension without increasing lung injury. This is in comparison with limited Pplat protective ventilation in a model of lung injury with low chest-wall compliance.
* Correspondence:cafeoranestesia@gmail.com
1
Anesthesiology and Critical Care Department, Hospital Clínico Universitario of Valencia, Av. Blasco Ibañez, 17, Valencia CP: 46010, Spain
Full list of author information is available at the end of the article
Introduction
Lung protective ventilation limiting airway plateau pres-sure (Pplat) ≤30 cmH2O minimizes alveolar overdisten-sion and reduces mortality in acute respiratory distress syndrome (ARDS) patients [1,2]. However, alveolar over-distension is more directly dependent on transpulmon-ary pressure (PTP), that is, the distending force in the lung. This means that the same Pplat can result in sub-stantially lower PTP in conditions of increased pleural pressure such as ARDS patients with reduced chest wall compliance (Ccw) or intra-abdominal hyperten-sion (IAH). In those conditions several methods to individualize open-lung positive end-expiratory pres-sure (OL-PEEP) have been proposed to optimize lung mechanics and to improve gas exchange while redu-cing lung injury [3-5]. However, once OL-PEEP is ad-justed, limiting Pplat may be challenging and often requires a tidal volume (VT) restriction that may in-duce hypoventilation and respiratory acidosis and on the other hand Pplat >30 cmH2O theoretically pro-duces overdistension and lung injury. Apart from lim-iting Pplat, there is no validated simple clinical tool for detecting lung overdistension at the bedside. Hence, there is need for alternative methods for indi-vidualizing VT. The stress index (SI), assessed during constant inspiratory flow, analyzes the shape of the pressure-time curve. It can indicate tidal overdisten-sion when displaying an upward concavity, tidal re-cruitment when displaying a downward concavity and non-injurious ventilation when the shape follows a straight line [6]. Several experimental and clinical studies have shown that when ventilatory parameters are ad-justed to a non-injurious SI (0.95 to 1.05) [7] there is a decrease in lung inflammation and lung injury [6-8]. Until now the SI has been mainly evaluated to guide either PEEP alone or VT and PEEP simultaneously but not in conditions of reduced Ccw [6,8,9].
Furthermore, it is unclear whether SI can be useful for guiding VT selection together with OL-PEEP during lung protective ventilation as it has never been evaluated in this context. This could be helpful in clinical practice as OL-PEEP levels are generally higher, especially in the context of reduced chest wall compliance [10]. In this condition even protective tidal volumes may result in higher than recommended plateau pressures whereas limiting VT to a protective plateau pressure may result in hypoventilation. We hypothesized that individualizing VT to a non-injurious SI could be useful to avoid hypoventilation while preventing overdistension despite a Pplat >30 cmH2O. To test our hypothesis we com-pared in an animal model of lung injury and reduced Ccw, in an open lung condition, the individualized VT to a non-injurious SI with the limited Pplat protective ventilation.
Materials and methods
This experimental study was approved by the Ethics Committee of Animal Experimentation of the Valencia University, Valencia, Spain (trial registration code A13291133306734). We studied 22 Landrace/Large white crossbred pigs weighing 30 to 40 kg.
An additional file shows the experimental protocol [see Additional file 1].
Anesthesia management
Animals were premedicated with ketamine (15 mg), mede-tomidine (2 mg), and azaperone (2 mg). Anesthesia was in-duced by midazolam (20 mg) and fentanyl (0.03 mg kg−1) and maintained with midazolam (3 mg kg−1 min−1), remifentanil (0.15 μg kg−1 min−1) and cisatracurium (0.08 mg kg−1 h−1). Mechanical ventilation using a Servo-i ventilator (Maquet Critical Care AB, Solna, Sweden) was delivered with a cuffed tube in the supine position in a volume-controlled (VCV) mode with constant in-spiration flow (square wave), expiratory VT of 8 ml kg−1, PEEP 5 cmH2O inspiratory/expiratory ratio 1:2 with an inspiratory pause of 10%, FIO21, and respiratory rate (RR) adjusted to a PaCO2 of 35 to 65 mmHg. Body temperature was maintained at 36°C to 37°C with heated blankets.
Instrumentation
A 3-Fr thermodilution catheter (PV2013L07-A, Pulsion Medical Systems AG, Munich, Germany) was placed in the right femoral artery for cardiac output monitoring. A 7-Fr double-lumen catheter (AK-22702-P1A, ARROW International, Inc., Morrisville, NC, USA) was inserted into the right or left internal jugular vein for drugs and fluid in-fusion and transpulmonary thermodilution (TPTD).
Experimental model
Lung injury was induced through repeated lung la-vages with 30 ml kg−1 of warm (37°C) normal saline while the animals were maintained in a supine pos-ition. Lavages were repeated until a PaO2/FIO2 ratio of <200 mmHg was reached. As previous studies have demonstrated, this model of lung injury pro-motes lung collapse in gravity-dependent regions [11] but has little effect on lung permeability or inflam-mation [12-14], although cytokines are usually de-tected in the lavage fluid.
Respiratory monitoring
Respiratory parameters, expiratory VT and minute venti-lation (VE), RR, airway pressures (Paw), Pplat, PTP, pleural pressure, PEEP and SI were obtained from a FluxMed monitor (MBMed, Buenos Aires, Argentina) that includes a pneumotachograph placed between the endotracheal tube and the ‘Y’ piece of the breathing circuit. End-inspiratory and end-expiratory pressures were obtained after a pause of three seconds.
Esophageal pressure was measured by an esophageal catheter (MBMed) inserted following the manufacturer’s recommendations. The catheter’s optimal position was confirmed by a positive occlusion test [17]. During mea-surements, the esophageal balloon was inflated with 1 ml of air. PTP was calculated using the standard for-mula as: PTP= Pplat - pleural pressure. Static respiratory system compliance was calculated as Crs = VT/(Pplat – PEEP). Lung compliance was calculated as CL= VT/ (end-inspiratory PTP – end-expiratory PTP), and Ccw was calculated as VT (end-inspiratory pleural pressure– end-expiratory pleural pressure). The presence of auto-PEEP was evaluated in real-time by observing the flow-volume curves on the FluxMed monitor [18]. In the presence of an interrupted expiratory flow, that is, when inspiratory flow began before expiratory flow ceased (that is, reached zero), auto PEEP was assumed to be present.
SI was measured every 30 seconds during the study period as previously described [8]. During the constant flow portion, the inspiratory pressure-time relation can be described by a power equation:
PTP¼ a x tbþ c
where the coefficient a represents the slope of the pressure-time relationship in the time 0 to time 1 inter-val, and the coefficient c is the value of pressure at time 0. The coefficient b (SI) is a dimensionless number that describes the shape of the pressure-time curve.
A pressure-time curve displaying an upward concavity (SI >1.05) indicates tidal overdistension, a downward concavity (SI <0.95) tidal recruitment, whereas a straight line (0.95 > SI <1.05) is indicative of less injurious ventilation.
Arterial blood gases were taken at each measurement time-point (i-STAT Analyzer, Abbott Laboratories, East Windsor, NJ, USA).
Hemodynamic monitoring and management
A PiCCO monitor (Pulsion Medical Systems AG) was used for hemodynamic monitoring. The cardiac index (CI) was obtained by triple TPTD using 10 ml of cold saline, which also provided the following derived parameters: intra-thoracic blood volume index (ITBVI) extravascular lung
water index (EVLWI) and pulmonary vascular permeability index (PVPI). The mean arterial pressure (MAP) and heart rate (HR) were recorded continuously.
Hemodynamic stability was maintained following a standard protocol as previously described [19] prior to the start of the experimentation.
Throughout the study, animals received a continuous crystalloid (4 to 6 ml kg−1h−1Ringer’s-Lactate solution) infusion.
Experimental protocol
The experimental protocol is described in Additional file 1. The experimental protocol lasted a total of 340 minutes. Ventilatory parameters were adjusted ac-cording to the described baseline ventilation but limit-ing RR to a maximum of 35 bpm again assurlimit-ing a PaCO2between 35 and 65 mmHg. After thirty minutes stabilization after inducing lung injury and IAH, the ex-perimental protocol was performed as follows.
PEEP adjustment: recruitment maneuver and PEEP titration
The recruitment maneuver (RM) was performed as fol-lows. The ventilator was switched to pressure-control ventilation (PCV) with a driving pressure of 20 cmH2O, a PEEP of 5 cmH2O and 10 bpm. PEEP was then in-creased in 5-cmH2O steps, each lasting 10 breaths, until reaching an inspiratory opening pressure of 50 cmH2O (that is, 20 cmH2O of driving pressure and 30 cmH2O of PEEP). This opening pressure was then maintained for 20 breaths (that is, two minutes) [20,21]. The RM was immediately followed by a decremental PEEP trial for PEEP titration. The ventilator was switched to VCV with 6 ml kg−1, a RR of 20 bpm and a PEEP of 30 cmH2O. PEEP was decreased in 2-cmH2O steps, each maintained for two minutes, until the best Crs was detected. There-after, a new RM was performed as described above to re-open alveoli collapsed during the decremental PEEP titration. The ventilator was switched back to VCV, and the open-lung PEEP level (PEEP with best Crs + 2 cmH20) [21] was established and maintained during the rest of the experimental period. Ventilation ac-cording to each randomly assigned group then proceeded for a four-hour period and a full set of measurements was taken at the beginning (baseline, T0), and at 60 (T1), 120 (T2), 180 (T3) and 240 (T4) minutes. [see Additional file 1].
Tidal volume adjustment
VT adjustment was initiated one minute after open lung PEEP. For the adjustment of tidal volume, animals were then randomly assigned to a Pplat-group or a SI-group.
1 ml kg−1 every five minutes during the experiment if needed to maintain the target Pplat.
In the SI-group, VT was adjusted to maintain the SI between 0.95 and 1.05. The VT was readjusted in steps of 1 ml kg−1every five minutes during the experiment if needed to maintain the target SI.
VT and RR were not modified for pH management unless pH ≤7.15. When pH was ≤7.15 and RR <35, RR was increased in steps of 1 bpm to maintain a pH >7.15. When pH was≤7.15 and RR = 35 rpm, VT was increased in steps of 1 ml kg−1irrespective of Pplat or SI.
Computed tomography scanning and analysis
At the end of the experimental protocol six animals (three of the Pplat-group and three of the SI-group) were transferred to the computed tomography (CT) scanner without interrupting ventilation. Spiral CT scans (120 kV, 110 mA) of the total lungs were performed dur-ing end-expiration and end-inspiration holds usdur-ing a Discovery CT750 HD (GE Healthcare). Images were re-constructed in 3-mm slices using a standard filter for lung parenchyma for the CT-image edition. Four sec-tions of the thorax to be imaged were selected on the scout view: level 1: aortic arch, level 2: heart, level 3: main bronchi and level 4: just above the diaphragm. Each level was divided in two regions of interest (ROI): V: ventral and D: dorsal. Lung aeration was assessed by a radiologist who was blinded to group identity by meas-uring normally aerated, poorly aerated, nonaerated, and overinflated lung volumes as previously described [22]. Nonaerated lung was defined by lung densities ranging between -100 and +100 Hounsfield Units (HU), poorly aerated lung by lung densities ranging between -100 and -500 HU, normally aerated lung by lung densities ranging between -500 and -900 HU and overinflated lung by lung densities ranging between -900 and -1000 HU. The amount of the different densities was expressed as a percentage of the total lung parenchyma in the re-gion analyzed. The threshold of a clinical significant per-cent of a lung density compartment over the total lung parenchyma in the region analyzed was 10% [21].
Inflammation and histopathology
An additional file shows the description of Material and methods for the determination of inflammatory markers and histopathology [see Additional file 2].
Statistical analysis
Data were entered into the statistical package SPSS version 15.0 (IBM, Chicago, IL, USA). The Kolmogorov-Smirnov and Levene’s test were used to determine normality and homogeneity, respectively. When the homogeneity hypothesis was rejected (testP-value <0.05), the Mann Whitney U test and a Friedman test were
applied. If not rejected, a Student’s t-test and analysis of variance (ANOVA) were performed. For multiple comparisons, the Bonferroni correction was used to fit a type I risk to the chosen significance level (α= 5%). Data are presented as the mean (standard deviation, SD) if normally distributed and as median (interquartile range, IQR) otherwise.
Results
The mean (SD) animal weight was 32 (2) kg for the SI-group and 31 (2) kg for the Pplat-SI-group. The open-lung PEEP level was found to be 17 (2) cmH2O for the SI-group and to be 18 (2) cmH2O for the Pplat-SI-group (P= 0.69). Temperature was maintained between 36°C and 37°C in all animals.
The animal model of lung injury and IAH as previ-ously described [10,21] reduced Crs by 33% (P <0.001; 95% confidence interval (CI) 2 to 11), Ccw by 57% (P<0.001; 95% CI 41 to 49) and CLby 62% (P<0.001; 95% CI 10 to 18). Also, Pplat was increased by 56% (P<0.001; 95% CI 9 to 17) together with an increase of 40% of the PTPEI (P <0.001; 95% CI 6 to 11) and 47% of the EVLWI (P <0.001; 95% CI 3 to 14). The oxygenation decreased by 66% (P <0.001; 95% CI 235 to 422). The changes in the respiratory mechanics, oxygenation and extravascular lung water produced by the saline lavage and air-insufflation remained constant during the ex-perimentation ensuring a stable experimental model.
Effects of ventilatory strategy on gas exchange and ventilatory mechanics
PaCO2was significantly higher in the Pplat-group result-ing in a lower pH (Table 1). In the Plat-group, the PaCO2 remained >65 mmHg during the entire experi-mental period despite reaching the maximum per-protocol allowed RR since T1. In the SI-group, PaCO2 was <65 mmHg and pH remained >7.15 in all animals during the experimentation. In the SI-group, the RR was readjusted every hour after arterial blood gases but max-imum RR allowed was not reached. In two animals of the Pplat-group, VT had to be increased starting at T2 to try to reach the target pH >7.15 resulting in a Pplat >30 cmH20, but in only one animal was SI >1.05, suggesting tidal overdistension. In all the SI-group animals, Pplat was >30 cmH2O. Oxygenation was similar in both groups during the experimental period (Table 1, Figure 1).
2 ml kg−1. No significant differences between groups were found in the SI, end-expiratory, end-inspiratory and delta PTP and for Crs, Ccw and CL (Table 1, Figure 2). None of the study animals developed auto-PEEP during the study period.
Effects of ventilatory strategy on lung densities
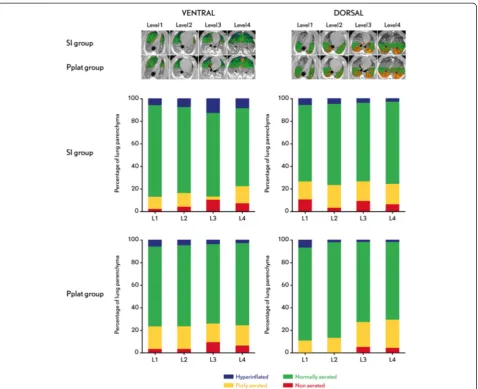
There were no differences in lung aeration between the SI- and Pplat-groups at the four lung levels analyzed. No differences were found between the two ROIs in the four levels analyzed. There were no hyperinflated and non-aerated lung areas in any of the four levels analyzed in the two ROIs, except in the SI-group in level 3 ventral ROIs that presented 12% of non-aerated lung areas (Figure 3).
Effects of ventilatory strategy on hemodynamics
Animals remained hemodynamically stable. The CI, ITBVI, PAM and FC did not differ between groups. The alveolar recruitment maneuver and PEEP titration did not produce a CI decrease in any pig (Table 2).
Effects of ventilatory strategy on inflammatory markers
[image:5.595.304.537.101.272.2] [image:5.595.56.290.102.729.2]No differences were found in the concentrations of TNF-α and IL-8 between the SI-group and Pplat-group. There were no histopathological differences between the groups. In both groups, the lung damage score was Table 1 Respiratory parameters
Parameters T0 T1 T2 T3 T4
VT
Pplat-group 8 (0) 5.8 (1.1)* 5.7 (0.9)* 5.6 (0.8)* 5.4 (0.8)*
SI-group 7.2 (0.2) 7.2 (0.2) 7.2 (0.8) 7.3(0.7)
P-value 8 (0) 0.02 0.04 0.3 0.002
RR
Pplat-group 22 (2) 32 (3) 35 (0) 35 (0)* 35 (0)*
SI-group 22 (2) 31 (3) 33 (2) 32 (1) 31 (1)
P-value 0.79 0.07 0.10 0.04 <0.001
VE
Pplat-group 5.4 (0.2) 5.8 (0.2)* 5.9 (0.2)* 6.2 (0.2)* 6.4 (0.2)*
SI-group 5.5 (0.2) 6.1 (0.2) 6.8 (0.1) 7.3 (0.3) 7.3 (0.2)
P-value 0.48 0.001 0.001 0.001 0.001
SI
Pplat-group 1.05 (0.08) 0.90 (0.12) 0.95 (0.13) 0.97 (0.13) 1.03 (0.12)
SI-group 1.01 (0.04) 1.01 (0.06) 0.99 (0.06) 0.98 (0.05) 0.99 (0.07)
P-value 0.58 0.29 0.66 0.95 0.42
Pplat
Pplat-group 18 (2) 29 (3)* 31 (2)* 30(1)* 30 (1)*
SI-group 18 (3) 35 (3) 35 (2) 36 (2) 35 (2)
P-value 0.91 0.001 0.002 0.001 0.001
PTPEE
Pplat-group 2(1) 5 (3) 6 (3) 6 (3) 5(3)
SI-group 2 (1) 4 (2) 4 (2) 4 (3) 5 (4)
P-value 0.81 0.34 0.32 0.45 0.61
PTP EI
Pplat-group 7 (1) 15 (2) 15 (2) 16 (2) 17 (1)
SI-group 6 (2) 17 (3) 17 (3) 18 (2) 18 (3)
P-value 0.56 0.49 0.17 0.22 0.42
ΔPTP
Pplat-group 5 (2) 11 (6) 9 (2) 10 (3) 10 (3)
SI-group 5 (2) 13 (2) 12 (4) 14 (4) 13 (4)
P-value 0.74 0.81 0.08 0.18 0.40
Crs
Pplat-group 20 (3) 13 (4) 14 (3) 14 (3) 13 (3)
SI-group 21 (3) 14 (2) 15 (2) 16 (2) 15 (3)
P-value 0.72 0.54 0.63 0.31 0.35
Ccw
Pplat-group 80 (6) 34 (4) 33 (3) 32 (3) 32 (3)
SI-group 80 (5) 34 (3) 33 (5) 33 (4) 34 (4)
P-value 0.92 0.89 0.86 0.24 0.19
CL
Pplat-group 46 (3) 18 (1) 18 (4) 18 (5) 15 (3)
SI-group 50 (5) 18 (3) 18 (3) 18 (2) 18(2)
P-value 0.51 0.69 0.73 0.59 0.24
Table 1 Respiratory parameters(Continued)
pH
Pplat-group 7.45 (0.0) 7.25 ( 0.0)* 7.21 (0.0)* 7.18 (0.0)* 7.19 (0.0)*
SI-group 7.45 (0.1) 7.32 (0.0) 7.34 (0.1) 7.34 (0.0) 7.34 (0.1)
P-value 0.68 0.09 0.004 0.003 0.01
PaO2/FiO2
Pplat-group 482 (122) 151 (40) 179 (49) 225 (80) 220 (82)
SI-group 515 (50) 188 (68) 220 (62) 214 (68) 230 (78)
P-value 0.58 0.31 0.52 0.81 0.73
PaCO2
Pplat-group 44 (7) 68 (15) 78 (15)* 83 (12)* 82 (19)*
SI-group 47 (8) 54 (7) 56 (6) 54 (7) 53 (7)
P-value 0.54 0.12 0.02 0.002 0.01
Time-points T0: Baseline measurement, 10 minutes after protocolized baseline
ventilatory parameters, before lung injury; T1: 60; T2: 120; T3: 180; and T4:
240 minutes after protocolized ventilatory parameters (open lung PEEP and protocolized VT corresponding to the study group) were adjusted. Data are presented as mean (SD). VT: tidal volume (ml/kg); RR: respiratory rate (bpm); VE: minute volume (L); SI: stress index; Pplat: plateau pressure (cmH2O); PTPEE:
end-expiratory transpulmonary pressure (cmH2O); PTPEI: end-inspiratory
transpulmonary pressure (cmH2O);ΔPTP: delta-transpulmonary pressure
(end-inspiratory–end-expiratory) (cmH2O); Crs: respiratory system compliance
(ml/cmH2O); CL: lung compliance (ml/cmH2O); Ccw: chest wall compliance
(ml/cmH2O); pH: acid-based state; PaO2/FiO2: arterial oxygen tension to
inspiratory oxygen fraction index (mmHg); PaCO2: arterial carbon dioxide
higher in the dorsal lung samples. Neither alveolar wall thickening nor hyaline membrane were observed in any group (Figure 4). An additional file shows the results of broncho-alveolar and plasma cytokines and histopatho-logical analysis [see Additional file 2].
Discussion
The major finding of our study is that adjusting VT to a targeted non-injurious SI value (0.95 > SI <1.05) in an open lung condition as compared with a VT targeted to Pplat ≤30 cmH2O, improves alveolar ventilation while it avoids increasing overdistension in the studied model of lung injury with low chest wall compliance. Further-more, this targeted VT does not increase the risk of VILI due to overdistension compared to protective ventilation aimed at limiting Pplat. To our knowledge, this is the first study that uses the SI to individually adjust VT in combination with lung recruitment and open lung PEEP. Despite a higher absolute Pplat in the SI-group no sig-nificant differences were observed in regional overinfla-tion (on CT), global overdistension (according to the PTP), biological and histological markers of lung injury and lung edema between the two groups. In this respect SI appears to be a useful alternative at the bedside for optimizing VT during lung protective ventilation in situ-ations of low chest wall compliance in combination with lung recruitment and OL-PEEP.
A lung protective ventilation strategy that limited VT to maintain a Pplat ≤30 cmH2O decreased mortality in ALI/ARDS patients [1,2]. However, Pplat is not repre-sentative of alveolar overdistension [23]. The true dis-tending force of the lung is the PTP. This is especially important in patients with ARDS with a reduced Ccw [24]. As our results demonstrate, targeting VT to a non-injurious SI does not result in a greater overdistension than the one resulting from targeting VT to a ‘ protect-ive’ Pplat ≤30 cmH2O [25], while the latter strategy in-creases the risk of hypoventilation in patients with high pleural pressure.
Selection of VT
[image:6.595.57.290.85.729.2]Nowadays, several lung protective ventilation to adjust VT had been proposed to avoid overdistension. The most common are the use of standardized low VT or limiting VT to a maximum Pplat [1] but, as has been previously shown, both are inadequate surrogates for
Figure 1Changes in the principal variables during the protocol.T0: Baseline . T1: 60, T2: 120, T3: 180 and T4: 240 minutes
after protocol defined ventilation was started. Data are presented as mean (SD). VT: tidal volume, Pplat: plateau pressure, RR: respiratory rate, PaCO2: arterial partial pressure of CO2, pH: acid-base state.
lung atelectrauma and overdistension [23]. This may have important implications in patients with low Ccw, such as patients with IAH [8], obese patients or ARDS patients, where adjusting appropriate lung protective ventilation settings can be a difficult clinical challenge [24] and these strategies may often result in excessive hy-percapnia and respiratory acidosis.
It has recently been suggested that limiting end-inspiratory transpulmonary pressure to 25 cmH2O is an alternative for limiting tidal overdistension [26] but fur-ther studies in different lung conditions togefur-ther with imaging techniques are needed to confirm this thresh-old. Moreover, monitoring Ptp with an esophageal cath-eter, even despite the promising results in clinical and experimental studies, still has many practical and theor-etical limitations in clinical practice that could alter the measured value and would not reflect transpulmonary pressure [27,28]. Given the limitations of the available bedside monitoring tools there is no optimal strategy to
guide the setting of the best VT during lung injury in conditions of reduced chest wall compliance. Individual-ized setting of VT to a non-injurious SI could be an easy and accurate tool to minimize overdistension while re-ducing hypoventilation.
[image:7.595.58.542.90.420.2]Some studies suggest that SI has a reduced accuracy in detecting cyclic overdistension and recruitment when non-pulmonary factors affect lung mechanics [29] or in heterogeneous lungs (ARDS) because these phenomena can occur simultaneously during a tidal breath [30]. Nevertheless, unlike all previous studies using SI to optimize ventilation [7-9,30], with the proposed ap-proach of setting optimal PEEP after lung recruitment, tidal recruitment should be minimized as theoretically only a minimal amount of lung collapse is present. This should improve the ability of SI to detect injurious settings causing overdistension as theoretically this will be the predominant mechanism influencing the abnormal shape of the pressure time curve. This is further
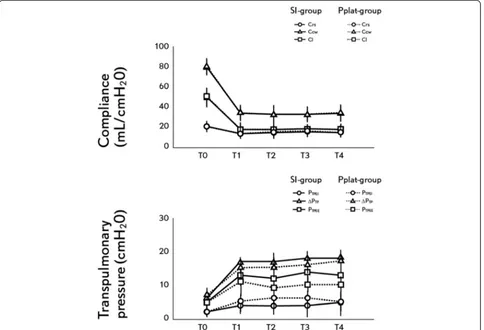
Figure 2Changes in lung mechanics during the experimental protocol.Dashed line: SI-group, pointed line: Pplat-group. Upper panel: compliance. Triangle: chest wall compliance, square: lung compliance, circle: respiratory system compliance. Lower panel: transpulmonary pressure. Triangle: end-inspiratory transpulmonary pressure, square: delta transpulmonary pressure, circle: end-expiratory transpulmonary pressure. T0: Baseline. T1: 60, T2: 120, T3: 180 and T4: 240 minutes after protocol defined ventilation was started. *P<0.05 Pplat-group
reinforced by the recent demonstration that an SI >1.05 indicates injurious ventilation very accurately in ARDS patients, better than the value of plateau pressure [7].
Assessment of hyperinflation by means of computed tomography scan
In order to confirm our hypothesis, CT scans were made in six animals. Thoracic CT allows for accurate measure-ment of pulmonary volume distribution and, thus, the influence of VT on hyperinflation [22]. Despite the sig-nificantly higher VTs and Pplat >30 cmH2O in the SI-group, no differences in regional hyperinflation, consid-ered as more than 10% of hyperinflated lung tissue of the total lung, were found between the groups. CT ana-lysis did not detect any hyperinflation in the different lung regions in either of the groups. This is in agreement with previous experimental and clinical studies in
injured lungs in which CT analysis confirmed that SI [6,7] and dynamic respiratory mechanics [31] can be used to optimize ventilatory parameters.
Overdistension assessment with global indices of lung function
[image:8.595.61.540.87.476.2]Interestingly, despite the setting of higher VTs in the SI-group and a Pplat >30 cmH2O, we did not find any differences in PTPEI between the groups, suggest-ing no differences in overdistension. Although there is no known theoretical safe upper limit for transpulmonary pressure, suggested protective levels are accepted to be <25 cmH2O [26]. In none of the studied animals, in either group, was PTPEI close to these levels. The PTPEI levels we obtained were similar to those ob-tained by Krebs et al. [10] in ARDS patients with IAH, with PEEP levels of 15 to 20 cmH2O and a VT
Figure 3Computed tomography scan and distribution of the ventilation.Left side: Ventral ROI, right side: Dorsal ROI. SI-group: VT adjusted to SI between 0.95 and 1.05. Pplat-group: VT adjusted to Pplat = 30 cmH2O. Level 1: aortic arch, level 2: heart, level 3: main bronchi and level 4: just
of 6 ml kg−1. Recently, Talmor et al. used PTPEE to individualize PEEP in ARDS patients. They demonstrated that even with a VT of 7 ml kg−1PTPEIvalues were rela-tively low (averaging 8 cmH2O) but with a Pplat in the higher ‘safe’ limit (29 cmH2O) independent of whether PEEP was adjusted conventionally or guided by esopha-geal pressure [26].
Effects of VT size in the inflammatory response
It has been well established that injurious mechanical ventilation can trigger a local and systemic inflammatory response, a process known as biotrauma [32-34]. The results obtained in this study with no differences in cytokine levels and histopathological analysis suggest that adjusting VT to 0.95 > SI <1.05 in a re-expanded
lung does not increase the risk of VILI, despite the higher than recommended resulting tidal volumes and plateau pressures. This is consistent with previous studies where targeting ventilation to non-injurious SI decreased the risk of VILI [6] despite short observa-tion periods [35-37].
Effects of VT size on lung edema
ARDS is characterized by an increase in pulmonary edema [38,39]. No differences were found during the study period in EVLWI between the SI- and Pplat-groups, further reinforcing the concept that targeting VT to a non-injurious SI is a useful approach for lung protective ventilation [40].
Selection of PEEP
Different studies have demonstrated that in ARDS, PEEP titration for the best Crs after lung recruitment (that is, OL-PEEP) minimizes recruitment/derecruitment and overdistension [21,30]. The OL-PEEP found in our study is similar to that obtained in previous experimental [41] and clinical [10] studies with high pleural pressure. The presence of less than 10% non-aerated areas in the CT at end-expiration and the slightly positive PTPEE values confirm the adequate PEEP level used in this experimen-tal model [10,26]. Moreover, it has been suggested that the optimal PEEP level in ARDS and IAH patients is the level reached after adjustment to the best Crs after lung recruitment [42] and interchangeable with a PEEP titra-tion to best Ptp [43].
Limitations
[image:9.595.56.290.100.452.2]Our study has some limitations. First, we used a pig model as its use is well established in IAH [41] and ALI/ ARDS [20]. However, the behavior of the respiratory sys-tem may be very different in critically ill patients, espe-cially in ARDS patients with abdominal hypertension and, therefore, our results must be interpreted with cau-tion. Second, the time spent on both ventilation modes was limited to four hours, and the long-term effects of the proposed strategy are, therefore, not known. This short study period together with the fact that we were comparing two lung protective ventilation strategies may have limited the extent of the inflammatory response and the histopathological changes seen in our results. Third, it is difficult to interpret the concentration of cy-tokines in bronchoalveolar lavage (BAL) specimens be-cause an unknown amount of cytokines always remain within the cells and because the ideal lavage volume for this purpose has not yet been established. Furthermore, in the analysis of the inflammatory response we did not include mRNA expression of cytokines or myeloperoxi-dase activity which may have been earlier and specific markers to evaluate the inflammatory response, Table 2 Haemodynamic parameters
Parameters T0 T1 T2 T3 T4
IC
Pplat-group 3.0 (0.9) 2.6 (0.3) 3.0 (0.3) 2.5 (0.8) 2.9 (0.5)
SI-group 3.2 (0.8) 2.7 (0.4) 2.6 (0.4) 2.4 (0.2) 2.5 (0.4)
P-value 0.69 0.76 0.08 0.86 0.16
AM
Pplat-group 103 (11) 99 (12) 105 (8) 93 (15) 91 (28)
SI-group 101 (7) 97 (9) 97 (17) 103 (19) 101 (18)
P-value 0.72 0.81 0.41 0.40 0.56
FC
Pplat-group 74 (8) 72 (13) 78 (25) 83 (38) 88 (25)
SI-group 85 (15) 64 (7) 70 (28) 74 (28) 82 (35)
P-value 0.19 0.24 0.64 0.38 0.77
ITBVI
Pplat-group 521 (123) 492 (41) 551 (63) 542 (195) 568 (72)
SI-group 528 (105) 580 (100) 676 (107) 660 (153) 644 (107)
P-value 0.93 0.10 0.05 0.32 0.07
EVLWI
Pplat-group 8 (2) 18 (5) 15 (3) 14 (3) 15 (4)
SI-group 8 (1) 17 (2) 18 (4) 18 (4) 18 (4)
P-value 0.86 0.78 0.34 0.18 0.27
PVPI
Pplat-group 1.9 (0.8) 3.8 (1.4) 3.5 (0.8) 2.7 (0.7) 2.9 (0.8)
SI-group 2.2 (0.6) 3.2 (0.6) 3.0 (0.9) 2.8 (0.5) 2.8 (0.5)
P-value 0.61 0.44 0.40 0.68 0.93
Time-points T0: Baseline measurement, 10 minutes after protocolized baseline
ventilatory parameters, before lung injury. T1: 60, T2: 120, T3: 180 and T4:
240 minutes after protocolized ventilatory parameters (open lung PEEP and protocolized VT corresponding to the study group) were adjusted. Data are presented as mean (SD). IC: cardiac index (ml/min/m2
), MAP: mean arterial pressure (mmHg), FC: cardiac frequency (bpm), ITBVI: intra-thoracic blood volume indexed to predicted body weight (ml/m2
), EVLWI: extravascular lung water indexed to predicted body weight (ml/m2
especially due to the short period spent on mechanical ventilation. Fourth, we measured the mean IAP instead of the recommended end-expiratory measurement [16]. This may have underestimated the real levels of IAP by approximately 2 to 3 mmHg [44].
Conclusions
Setting VT to a targeted SI non-injurious value (0.95 to 1.05) in an open lung condition improves alveolar ventilation without increasing the risk of overdistension compared with protective ventilation aimed at limiting plateau pressure in a model of lung injury with low chest wall compliance. Our findings, if confirmed in lung in-jury patients with reduced chest wall compliance, could result in a useful alternative approach to optimize lung protection and set an appropriate tidal volume in these otherwise difficult to ventilate patients.
Key messages
Alveolar overdistension depends more on transpulmonary pressure (PTP), that is, the distending force in the lung as determined by the alveolar minus pleural pressure, than on the absolute Pplat value.
In patients with low Ccw (high pleural pressure), maintaining a Pplat≤30 cmH2O may be challenging
and often requires a VT restriction inducing hypoventilation and respiratory acidosis.
Currently, there are no validation tools for use at the bedside to assess tidal overdistension.
Setting VT to a targeted SI non-injurious value (0.95 to 1.05) in an open lung condition improves alveolar ventilation without increasing the risk of
overdistension.
Additional files
Additional file 1:Supplementary information of the experimental protocol.
Additional file 2:Supplementary information of materials and methods and results of inflammation (broncho-alveolar and plama cytokines) and histopathological analysis.
Abbreviations
ALI:acute lung injury; ARDS: acute respiratory distress syndrome; Ccw: chest wall compliance; CI: cardiac index; Cl: lung compliance; CT: computed tomography; EVLWI: extravascular lung water index; FIO2: inspiratory oxygen
fraction; HR: heart rate; HU: Hounsfield units; IAH: intra-abdominal hypertension; IAP: intra-abdominal pressure; IL: interleukin; ITBVI: intra-thoracic blood volume index; MAP: mean arterial pressure; OL-PEEP: open-lung PEEP; PaCO2: arterial
carbon dioxide partial pressure; PaO2/FiO2: arterial oxygen partial pressure to
inspiratory oxygen fraction; Paw: airway pressure; PCV: pressure-control ventilation; PEEP: positive end-expiratory pressure; Pplat: plateau pressure; PTP: transpulmonary pressure; PTPEE: end-expiratory transpulmonary pressure;
PTPEI: end-inspiratory transpulmonary pressure; PVPI: pulmonary vascular
[image:10.595.57.539.89.352.2]permeability index; RM: recruitment maneuver; ROI: region of interest; RR: respiratory rate; SD: standard deviation; SI: stress index; TNF: tumor necrosis
factor; TPTD: transpulmonary thermodilution; VCV: volume control ventilation; VE: minute ventilation; VILI: ventilator-induced lung injury; VT: tidal volume.
Competing interests
The authors declare that they have no competing interests.
Authors’contributions
CF participated in the design the study, and in the acquisition and analysis of data, interpretation of data and drafting the article. CF approved the final manuscript, attests to the integrity of the original data and the analysis reported in this manuscript and is the archival author. FSS helped in the interpretation of data, drafting and revising the article and approved the final manuscript. AG helped in the acquisition and analysis of data. GT helped with the interpretation of data, drafting and revising the article and approved the final manuscript. JC helped to design the study. MG helped in the acquisition and analysis of data. LP helped in the acquisition and analysis of inflammatory biomarkers. DC helped in the acquisition and analysis of histopathology. SF helped in the acquisition and analysis of computed tomography. MS helped in the acquisition and analysis of data. ALl help to design the study and in the analysis of data. FJB helped to design the study, and in the acquisition and analysis of data, interpretation of data and drafting the article. All authors read and approved the manuscript.
Funding
This work was funded by the Clinical Research Institute of the Hospital Clinico Universitario of Valencia (INCLIVA).
Author details
1Anesthesiology and Critical Care Department, Hospital Clínico Universitario
of Valencia, Av. Blasco Ibañez, 17, Valencia CP: 46010, Spain.2Section of Anesthesiology and Critical Care, Uppsala University Hospital Uppsala, Uppsala, Sweden.3CIBER de Enfermedades Respiratorias, Instituto de Salud
Carlos III, Madrid, Spain.4Department of Anesthesiology, Hospital Privado de
Comunidad, Mar de Plata, Argentina.5Clinical Research Foundation, Hospital Clínico Universitario of Valencia, Valencia, Spain.6Pathological Anatomy
Department, Hospital Clínico Universitario of Valencia, Valencia, Spain.
7Radiology Department, Hospital Clinico Universitario of Valencia, Valencia,
Spain.8Clinical Research Foundation, Hospital Clínico Universitario of Valencia, Valencia, Spain.
Received: 24 August 2014 Accepted: 18 December 2014
References
1. Ventilation with lower tidal volumes as compared with traditional tidal volumes for acute lung injury and the acute respiratory distress syndrome. The Acute Respiratory Distress Syndrome Network. N Engl J Med. 2000;342:1301–8.
2. Amato M, Barbas C, Medeiros D, Magaldi R, Schettino G, Lorenzi-Filho G, et al. Effect of a protective ventilation strategy on mortality in the acute respiratory distress syndrome. N Engl J Med. 1999;338:347–54.
3. Staffieri F, Stripoli T, De Monte V, Crovace A, Sacchi M, De Michele M, et al. Physiological effects of an open lung ventilatory strategy titrated on elastance-derived end-inspiratory transpulmonary pressure: study in a pig model. Crit Care Med. 2012;40:2124–31.
4. Regli A, Mahendran R, Fysh ET, Roberts B, Noffsinger B, De Keulenaer BL, et al. Matching positive end-expiratory pressure to intra-abdominal pressure improves oxygenation in a porcine sick lung model of intra-abdominal hypertension. Crit Care. 2012;16:R208.
5. Formenti P, Graf J, Cortes GA, Faltesek K, Gard K, Adams AB, et al. Experimental intra-abdominal hypertension attenuates the benefit of positive end-expiratory pressure in ventilating effusion-compressed lungs. Crit Care Med. 2012;40:2176–81.
6. Grasso S, Terragni P, Mascia L, Fanelli V, Quintel M, Herrmann P, et al. Airway pressure-time curve profile (stress index) detects tidal recruitment/hyperinflation in experimental acute lung injury. Crit Care Med. 2004;32:1018–27.
7. Terragni P, Filippini C, Slutsky A, Birocco A, Tenaglia T, Grasso S, et al. Accuracy of plateau pressure and stress index to indentify injurious ventilation in patients with acute respiratory distress syndrome. Anesthesiology. 2013;119:880–9.
8. Ranieri VM, Zhang H, Mascia L, Aubin M, Lin C, Mullen J, et al. Pressure-time curve predicts minimally injurious ventilatory strategy in an isolated rat lung model. Anesthesiology. 2000;93:1320–8.
9. Huang Y, Yang Y, Chen Q, Liu S, Liu L, Pan C, et al. Pulmonary acute distress syndrome: positive end-expiratory pressure titration needs stress index. J Surg Res. 2013;185:347–52.
10. Krebs J, Pelosi P, Tsagogiorgas C, Alb M, Luecke T. Effects of positive end-expiratory pressure on respiratory function and hemodynamics in patients with acute respiratory failure with and without intra-abdominal hypertension: a pilot study. Crit Care. 2009;13:R160.
11. Karmrodt J, Bletz C, Yuan S, David M, Heussel C, Markstaller K. Quantification of atelectatic lung volumes in two different porcine models of ARDS. Br J Anaesth. 2006;97:883–95.
12. Spragg R, Lewis J, Wurst W, Häfner D, Baughman R, Wewers M, et al. Treatment of acute respiratory distress syndrome with recombinant surfactant protein C surfactant. Am J Respir Crit Care Med. 2003;167:1562–6.
13. Anzueto A, Baughman R, Guntupalli K, Weg J, Wiedemann H, Raventós A, et al. Aerosolized surfactant in adults with sepsis-induced respiratory distress syndrome. N Engl J Med. 1996;334:1417–21.
14. Matute-Bello G, Frevert G, Martin T. Animal models of acute lung injury. Am J Physiol Lung Cell Mol Physiol. 2008;295:L379–99.
15. Bolbner M, Bogdanski R, Kochs E, Henke J, Findeis A, Jelen-Heselborn S. Effects of abdominally insufflated carbon dioxide and elevated intra-abdominal pressure on splanchnic circulation: an experimental study in pigs. Anesthesiology. 1998;89:475–82.
16. Malbrain ML, Cheatmam ML, Kirkpatrick A, Sugrue M, Parr M, De Waele J, et al. Results from the international conference of experts on intra-abdominal hypertension and abdominal compartment syndrome I. Definitions. Intensive Care Med. 2006;32:1722–32.
17. Baydur A, Behrakis PK, Zin WA, Jaeger M, Milic-Emili J. A simple method for assessing the validity of the esophageal balloon technique. Am Rev Respir Dis. 1982;126:788–91.
18. Bardoczky GI, d’Hollander AA, Cappello M, Yernault JC. Interrupted expiratory flow on automatically constructed flow-volume curves may determine the presence of intrinsic positive end-expiratory pressure during one-lung ventilation. Anesth Analg. 1998;86:880–4.
19. Ferrando C, Aguilar G, Piqueras L, Soro M, Moreno J, Belda FJ. Sevoflurane, but not propofol, reduces the lung inflammatory response and improves oxygenation in an acute respiratory distress syndrome model: a randomised laboratory study. Eur J Anaesthesiol. 2013;30:455–63.
20. da Silva Ramos FJ, de Oliveira EM, Park M, Schettino G, Azevedo L. Heart-lung interactions with different ventilatory settings during acute Heart-lung injury and hypovolaemia: an experimental study. Br J Anaesth. 2011;106:394–402. 21. Suarez-Sipmann F, Böhm S, Tusman G, Pesch T, Thamm O, Reissmann H,
et al. Use of dynamic compliance for open lung positive end-expiratory pressure titration in an experimental study. Crit Care Med. 2007;35:214–21. 22. Vieira SR, Puybasset L, Richecoeur J, Lu Q, Cluzel P, Gusman PB, et al. A lung
computed tomographic assessment of positive end-expiratory pressure-induced lung overdistension. Am J Respir Crit Care Med. 1998;158:1571–7. 23. Chiumelo D, Carlesso E, Cadringher P, Caironi P, Valenza F, Polli F, et al.
Lung stress and strain during mechanical ventilation for acute respiratory distress syndrome. Am J Respir Crit Care Med. 2008;178:346–55.
24. Pelosi P, Luecke T, Rocco PR. Chest wall mechanics and abdominal pressure during general anaesthesia in normal and obese individuals and in acute lung injury. Curr Opin Crit Care. 2011;17:72–9.
25. Petrucci N, Lacovelli W. Ventilation with smaller tidal volumes: a quantitative systematic review of randomized controlled trials. Anesth Analg. 2004;99:193–200.
26. Talmor D, Sarge T, Malhotra A, O’Donnell CR, Ritz R, Lisbon A, et al. Mechanical ventilation guided by esophageal pressure in acute lung injury. N Engl J Med. 2008;359:2095–104.
27. Cortes-Puentes GA, Gard KE, Adams AB, Faltesek KA, Anderson CP, Dries DJ, et al. Value and limitations of transpulmonary pressure calculations during intra-abdominal hypertension. Crit Care Med. 2013;41:1870–7.
28. Akoumianaki E, Maggiore SM, Valenza F, Bellani G, Jubran A, Loring SH, et al. The application of esophageal pressure measurement in patients with respiratory failure. Am J Respir Crit Care Med. 2014;189:520–31. 29. Formenti P, Graf J, Santos A, Gard KE, Faltesek K, Adams AB, et al.
30. Carvalho A, Spieth P, Pelosi P, Vidal Melo M, Koch T, Jandre F, et al. Ability of dynamic airway pressure profile and elastance for positive end-expiratory pressure titration. Intensive Care Med. 2008;34:2291–9.
31. Bellardine Black CL, Hoffman AM, Tsai LW, Ingenito EP, Suki B, Kacka DW, et al. Relationship between dynamic respiratory mechanics and disease heterogenicity in sheep lavage injury. Crit Care Med. 2007;35:870–8. 32. Oeckler RA, Hubmayr RD. Ventilator associated lung injury: a search for
better therapeutic targets. Eur Respir J. 2007;30:1216–26.
33. Villar J, Herrera-Abreu MT, Valladares F, Muros M, Pérez-Méndez L, Flores C, et al. Experimental ventilator induced lung injury: exacerbation by positive end-expiratory pressure. Anesthesiology. 2009;110:1341–7.
34. Belperio JA, Keane MP, Lynch 3rd JP, Strieter R. The role of cytokines during the pathogenesis of ventilator-associated and ventilator induced lung injury. Semin Respir Crit Care Med. 2006;27:350–64.
35. Wolthuis EK, Vlaar A, Choi G, Roelofs J, Juffermans NP, Schultz MJ. Mechanical ventilation using non-injurious ventilation setting causes lung injury in the absence of pre-existing lung injury in healthy mice. Crit Care. 2009;13:R1.
36. Wolthuis EK, Choi G, Dessing MC, Bresser P, Lutter R, Dzoljic M, et al. Mechanical ventilation with lower tidal volumes and positive end-expiratory pressure prevents pulmonary inflammation in patients without pre-existing lung injury. Anesthesiology. 2008;108:46–54.
37. Santos C, Moraes L, Souza R, DoSantos C, Dutra J, Marcos M, et al. The biological effects of higher and lower positive end-expiratory pressure in pulmonary and extrapulmonary acute lung injury with intra-abdominal hypertension. Crit Care. 2014;18:R121.
38. Ranieri M, Suter P, Tortorella C, De Tullio R, Dayer J, Brienza A, et al. Effect of mechanical ventilation on inflammatory mediators in patients with acute respiratory distress syndrome: a randomized controlled trial. JAMA. 1999;282:54–61.
39. Kushimoto S, Taira Y, Kitazawa Y, Okuchi K, Sakamoto T, Ishikura H, et al. The PiCCO pulmonary edema study group. Crit Care. 2012;16:R232.
40. Su F, Nauyen N, Creteur J, Cai Y, Nagy N, Anh-Dung H, et al. Use of low tidal volume in septic shock may decrease severity of subsequent acute lung injury. Shock. 2004;22:145–50.
41. Regli A, Hocking L, Musk G, Roberts B, Noffsinger B, Singh B, et al. Commonly applied positive end-expiratory pressures do not prevent functional residual capacity decline in the setting of intra-abdominal hypertension: a pig model. Crit Care. 2010;14:R128.
42. Quintel M, Pelosi P, Caironi P, Meinhardt JP, Luecke T, Herrmann P, et al. An increase of abdominal pressure increases pulmonary edema in oleic acid-induced lung injury. Am J Respir Crit Care Med. 2004;169:534–41. 43. Rodriguez P, Bonelli I, Setten M, Attie S, Madorno M, Maskin L, et al.
Transpulmonary pressure and gas exchange during decremental PEEP titration in pulmonary ARDS patients. Respir Care. 2013;58:754–63. 44. Sturini E, Saporito A, Sugrue M, Parr MJ, Bishop G, Braschi A. Respiratory
variation of intra-abdominal pressure: indirect indicator of abdominal compliance? Intensive Care Med. 2008;34:1632–7.
Submit your next manuscript to BioMed Central and take full advantage of:
• Convenient online submission
• Thorough peer review
• No space constraints or color figure charges
• Immediate publication on acceptance
• Inclusion in PubMed, CAS, Scopus and Google Scholar
• Research which is freely available for redistribution