Route Profiling - Putting Context To Work
Anthony Harrington and Vinny Cahill
Distributed Systems Group
Department of Computer Science
Trinity College Dublin
{
Anthony.Harrington,Vinny.Cahill
}@cs.tcd.ie
ABSTRACT
Intelligent Transportation Systems are characterised by a require-ment for detailed information on extensive transport networks. This information is typically gathered from sensors deployed throughout the network and is used for management and maintenance opera-tions.
In this paper we present the design and prototype implementa-tion of a context-aware route profiling applicaimplementa-tion intended for use by road management authorities in the Republic of Ireland. Our design allows data from a variety of sources to be combined to gen-erate detailed information on traffic flow and journey times along the national road network. This information can be tagged with relevant context data reflecting the conditions under which sensor data was collected. The set of relevant contextual information in-cludes details on temporal, spatial, weather and road usage pattern contexts.
The prototype implementation relies on GPS data from a fleet of probe vehicles. An evaluation of this prototype is presented along with a discussion on the benefits of using context-aware computing techniques in a real world scenario.
Categories and Subject Descriptors
J.0 [Computer Applications]: GeneralKeywords
Ubiquitous Computing, ITS, Context-Aware
1.
INTRODUCTION
In his vision of ubiquitous computing, Weiser described a new wave in computing which would focus on drawing the virtuality of
computer-readable data into the physical world and which would
be used to augment the information and services available to appli-cations and users [1]. One of the interaction themes enabled by the proliferation of computing into our physical world is context-aware computing [2].
Context-aware applications have some degree of knowledge of their operational environment and seek to exploit this knowledge
Permission to make digital or hard copies of all or part of this work for personal or classroom use is granted without fee provided that copies are not made or distributed for profit or commercial advantage and that copies bear this notice and the full citation on the first page. To copy otherwise, to republish, to post on servers or to redistribute to lists, requires prior specific permission and/or a fee.
SAC’04, March 14-17, 2004, Nicosia, Cyprus
Copyright 2004 ACM 1-58113-812-1/03/04 ...$5.00.
in providing services or information to the user. The efficacy of context-aware applications is largely dependent on the accuracy and degree of relevant contextual information available. This in-formation is typically extracted from sensors deployed throughout the environment. Sensor types are as varied as application domains. A road safety application developed for the Intelligent Transporta-tion Systems (ITS) domain may use weather sensors for detect-ing meteorological information such as wind speed and direction, air temperature and humidity, precipitation type and rate, visibility and road surface temperature, to determine whether the application of ice reducing chemicals is warranted [3]. An application devel-oped for facilitating mobile computing in a field work environment might use a GPS location and time sensor to identify and respond to changes in the temporal and spatial context [4, 5, 6].
Increasingly distributed sensor networks will supply the raw data from which application context will be mined. Deploying and sup-porting distributed sensors is a challenging task. The difficulties faced by designers and users of such networks include ensuring sensor power supply, security, mobility and cost effectiveness [7, 8]. One application domain which is particularly suited for the wide area deployment of sensor networks is that of ITS. Such sys-tems are concerned with the collection, processing and distribution of data related to transport systems and infrastructures.
ITS apply information, communications and control technolo-gies to improve the operation of transport networks [9] and are increasingly regarded by national and international transport au-thorities as an essential component of any sustainable infrastructure capable of supporting future transportation needs [10, 11, 12].
Embedding sensor technologies in vehicles and transport infras-tructure provides an efficient and cost effective method to gather raw data for ITS applications. The vehicle provides an independent power supply, security and mobility to the sensor. The low cost of the sensor relative to the high vehicle cost also facilitates sensor deployment.
In this paper we present the design and prototyping of a context-aware, route profiling application for the ITS domain. This appli-cation was developed to aid transport authorities in the Republic of Ireland to manage and evaluate the primary road network in the country.
This application will collect information from a large number of dispersed sensors of various types. GPS sensors are used to provide location, time and velocity information. Weather stations will be used to provide detailed meteorological information. Information on road maintenance and events likely to alter road usage patterns will be input manually.
black-spot identification, safety and maintenance programmes and driver assistance or route guidance applications.
Our prototype implementation uses sensor data to estimate cur-rent traffic flow speeds on the national road network. Using this traffic flow data we generate historical journey times along sections of the road network. These journey time records are tagged with relevant contextual information which characterize the conditions under which the journey time was recorded. The set of relevant contexts identified are: time, weather, road surface conditions and prevailing road usage patterns (e.g. traffic patterns associated with large concerts or heavy road maintenance operations).
In the prototype implementation records are tagged with time context. Indexing historical journey time records by context allows us to accurately predict future journey times on the basis of match-ing context and conditions.
This paper addresses issues such as sensor data representation and interoperability for consistent context extraction. The focus of this paper is very much application oriented and we investigate the potential of context-aware computing to provide effective solutions to real world problems.
The rest of this paper is organized as follows. We describe the sensor data available to us for route profiling and issues related to context extraction in Section 2. The design and implementation of a prototype route management tool is presented in Section 3.We present the evaluation of our prototype and our conclusions in Sec-tion 4.
2.
ROUTE PROFILING AND CONTEXT
EX-TRACTION
To effectively manage and evaluate the performance of the na-tional road network, transport authorities must have access to high quality information on all factors affecting travel on the network. Typically transport bodies will have detailed information on static features of the road network. This information will usually include all physical features of the route network such as location, type, width, curvature, altitude, slope etc, and will be stored in geocoded databases. The lengthy lifetime of this data, coupled with its slow update rate makes the manual collection of this data economically and practically feasible.
Dynamic data relevant to route performance includes details such as current traffic flow or speed, weather and road surface conditions and variations in road usage patterns due to events such as acci-dents, road maintenance or sports fixtures. This data clearly has a temporal and spatial dimension and this coupled with the extensive size of the national route network1 renders manual collection of dynamic data infeasible. Sensors may be deployed to automate the collection of this data. Identifying application relevant sensor data requires a deeper understanding of the ITS domain.
2.1
Motivation
Transportation is a vital industry accounting for 10% 2of the gross domestic product of the European Community and employ-ing more than 10 million people [12]. The management of trans-portation networks includes tasks such as monitoring road network performance, ensuring safe travelling conditions for users and the provision of traveller information systems enabling users to make informed decisions about their travel plans.
The National Route network of Ireland consists of 5435km of roads, with 2754 km being classified as National Primary and 2681 km classified as National Secondary Roads. The key metric used by
15,500 km’s 2
EUR 1,000 Billion
the managing authority to upgrade and maintain this network is to ensure a prescribed level of route capacity and level of service [14]. The capacity of a road link is the ability of that section of road to carry the maximum number of vehicles in safety at an appropriate level of service. The level of service is a measure of the travel ex-perience in terms of operating speed, the ability to overtake traffic in safety, traffic congestion, overall safety and driver and passenger comfort. In Ireland the reference capacity and level of service mea-sures are taken from the US Highway Capacity Manual [15]. The road authority has undertaken to ensure a minimum level of service that equates to providing an 80 kph inter-urban journey speed [14].
Network Performance
Evaluating the performance of a section of the road network is es-sentially a test of whether the minimum inter-urban journey speed is supported on that route. Currently vehicle speed data is collected using inductive loop detectors. These detectors contain an induc-tive element in an oscillatory circuit whose inductance is lowered when a vehicle stops or passes over the loop. The loops cannot directly measure speed but it can be estimated by using a two-loop speed trap or a single-two-loop detector using inputs such as ef-fective loop length, average vehicle length, time over the detector and number of vehicles counted [3]. Deployment of inductive loops is limited at present to 141 sections of the national route network where traffic volumes warrant the cost of installation and mainte-nance.
Additional data on volumes and speeds is obtained from visual surveys undertaken on a cross-section of routes. This data coupled with the inductive loop data can be combined and the results extrap-olated to produce average speed values for the road network. These data collection methods are laborious and expensive. Installation and maintenance of inductive loops is intrusive and expensive and is not a viable option in routes with low traffic volumes. Visual surveys produce data which is at best representative of a limited number of time of day and day of year contexts.
Safety Guidelines
Road authorities are also responsible for ensuring safe driving con-ditions on the road network. Winter mean daily minimum tempera-tures in Ireland are 2.5 degrees Celsius, with significant regional variation [16]. Ice and fog formation are consistent hazards on the road network. A distributed set of weather sensors is used by the Irish Meteorological Service to forecast hazardous weather for transport authorities who operate winter maintenance and road salt-ing programs to improve user safety on the network.
Traveller Information Systems
Traveller information systems and the provision of real time travel information systems are increasingly seen as a priority for trans-port authorities. Travellers can use reliable and uptodate informa-tion about condiinforma-tions on the transport network to make informed decisions on their travel plans. A user who is aware of high con-gestion levels or dangerous weather conditions on a section of the road network may chose another route or may decide on a different mode of transport such as rail or air thereby improving inter-modal transport system efficiency.
WEST
EAST
[image:3.595.318.560.55.196.2]Traffic Flow Data Meteorological Data Road Event Data
Figure 1: Relevant sensor Data
2.2
Sensor Data Processing
Significant processing of sensor data is necessary prior to the extraction of context data. Sensor data from diverse sources will typically be characterised by mutually inconsistent data formats. Data with a spatial dimension may be tagged with varying location reference schemes. It is also unlikely that sensor data inaccuracies will be uniform across a range of devices and data types. These issues must be addressed to ensure consistent and interoperable use of sensor data in context-aware ITS applications.
Dey’s definition of context as any information that can be used to characterize the situation of an entity [13], is the one nearest in spirit to that used in this paper. For the route profiling application whose design is presented in this paper, the set of relevant contex-tual information includes all factors that characterize the environ-ment through which vehicles move. For example, on any given seg-ment of the road network we can generate accurate journey times which reflect the prevailing traffic flow, time and date, weather and road usage contexts.
Data Sources
The available data sources for our system are summarised here.
• Traffic Flow Data
GPS sensors placed in vehicles traversing the national route network provide location, speed and time data which can be used to establish the traffic flow conditions along the route network. There are 1,000 probe vehicles generating GPS data at present on the national route network. This provides us with a considerable quantity of floating vehicle data. These sensors provide high quality data on traffic flow, and are mo-bile and non-intrusive. They are especially useful for captur-ing data on underutilised sections of the road network where it is economically infeasible to invest in fixed sensor infras-tructure. GPS values are calculated every minute and stored locally until they are downloaded via GPRS to a data collec-tion centre.
• Meteorological Data
The National Road Authority has a network of 52 weather monitoring stations and road sensors located on national routes throughout Ireland. Data from these sensors is relayed via GPRS to the Irish Meteorological service. The data is up-dated on an hourly basis and consists of values for air and
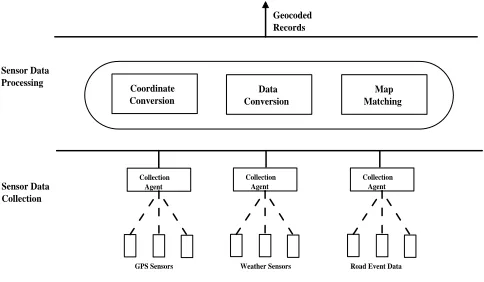
Sensor Data Processing
Sensor Data Collection
GPS Sensors
Coordinate Conversion
Map Matching Data
Conversion
Collection Agent
Collection Agent
Collection Agent
Weather Sensors Road Event Data
Geocoded Records
Figure 2: Sensor Data Processing
road temperature, road state, humidity, wind speed and direc-tion and precipitadirec-tion. It is processed by the meteorological service to provide accurate weather forecasts which can be used to assist road authorities with winter maintenance tasks such as road salting and snow clearing procedures.
• Road Event Data
Accidents, road works and special events such as large con-certs or sporting events can have a major impact on road net-work usage patterns. It is difficult to automate the collection of this data and it is currently envisaged that this data would be manually entered by road maintenance operators, event organisers, public authorities, etc.
Data Representation
We have identified three key requirements for ensuring consistent interpretation of sensor data in the route profiling application.
• Data Formating
Sensor data may be presented in a variety of unstructured ASCII or binary formats. The widespread acceptance of the XML data format coupled with the plentiful availability of parsing and validation tools make this standard useful for formating sensor data. We have implemented data conver-sion and validation routines to convert raw sensor data into XML records sorted within application appropriate param-eters. For example, the GPS sensor data feed presents us with intertwined records from a multitude of vehicles in un-structured ASCII records of varying length. This data feed is parsed and the relevant values are extracted and loaded into XML records which are sorted in time within date within vehicle order. Once the data is structured and ordered it is easily validated to ensure the correctness of data used for context extraction.
• Location Referencing
ITS sensor data will typically have a spatial dimension which may be expressed in disparate location referencing schemes. We have implemented coordinate conversion routines which extract and transform location data to a common internal for-mat which is necessary for sensor data interoperability and context extraction.
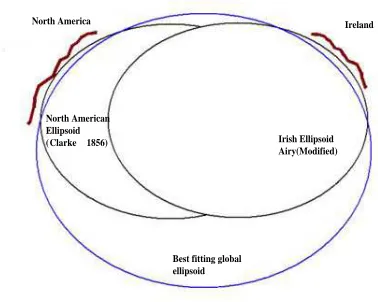
[image:3.595.57.288.57.225.2]North America
North American Ellipsoid (Clarke 1856)
Ireland
Irish Ellipsoid Airy(Modified)
[image:4.595.319.555.55.155.2]Best fitting global ellipsoid
Figure 3: Reference Ellipsoids
however subtle incompatibilities exist, from which we can draw general lessons.
Latitude and longitude values are coordinates from a geode-tic location reference system which defines a point on the globe, or more accurately a point on the surface of an ellip-soid which approximately fits the globe [17]. Due to the ir-regular surface of the earth, no single mathematical model or ellipsoid can provide a global best-fit representation of the globe. The reference ellipsoid shown in Fig 3 [18] and used by the Irish Ordnance Survey is the Modified Airy El-lipsoid which is highly accurate for the area of the globe that Ireland lies on but less accurate for other geographic regions [18]. GPS devices typically calculate latitude, lon-gitude values based on a global best-fit ellipsoid known as the WGS84 Ellipsoid [18]. Because latitude, longitude val-ues are given relative to the chosen ellipsoid, a single point on the earth’s surface may have many valid latitude and lon-gitude values, some of which may vary by up to 200 metres [17]. Data from the weather sensors is tagged with latitude, longitude value pairs based on the Airy Modified reference ellipsoid resulting in incompatibility with the GPS data.
To overcome the difficulties posed by the presence of in-compatible location data we transform all location references contained in sensor data to a common internal reference sys-tem. The internal reference system chosen for our applica-tion is the Irish Naapplica-tional grid. Ensuring that all sensor data is geocoded with a common schema allows us to accurately combine data from disparate sources when extracting context data.
• Map Matching
The accuracy of location tagged sensor data is unlikely to be uniform across a range of devices. To compensate for errors contained in the GPS data and to ensure consistent interpre-tation of the data it is necessary to smooth the converted lo-cation values using map matching techniques.
Our probe vehicle population is dispersed across a large ge-ographical area and the GPS error will vary from vehicle to vehicle. In order to relate vehicle location and speed data to traffic flows along the national route network it is necessary to overlay a vector map of the road network with probe vehi-cle GPS data. It is likely that a large number of GPS readings will not fall directly along the road but rather will fall within
Geocoded Records Weather
Safety
Traveller Information
Route Performance Context Aware ITS Applications
indexed by
Extracted Contexts
Time
Weather
Road Use
Figure 4: Context Data Extraction
a certain radius of the road segments. The Map Matching routines project the points which lie within a tolerance level of the road network onto the road network itself. All sensor readings which fall outside this tolerance level are discarded.
The sensor processing modules provide us with normalised geocoded records in a common format and structure. This data is now avail-able for use in context extraction modules.
2.3
Context Extraction
Various categorizations of context types have been suggested in the literature [13, 4, 20]. Location, identity, time and activity have been identified as primary context types for characterizing the sit-uation of an entity [13]. The set of contexts relevant to our route profiling application include time, weather and road usage pattern data.
Given the nature of the application, it is more correct to regard location as a core data value or product of the sensor data, rather than as a context which shapes our understanding and use of this data. The spatial dimension of the data set is subdivided into an origin-destination matrix representing all possible journeys along the national road network.
The time at which a journey takes place is an important piece of contextual information and enables more accurate use and inter-pretation of sensor data. For example, the impact of morning and evening rush-hour traffic on journey times becomes more readily apparent. The time context has been subdivided into time of day and day of week units.
A knowledge of the state of the weather at the time the journey was recorded further conditions our understanding and use of the core journey-time value, as it allows us to identify and model the impact of adverse weather on the performance of the road network. The weather context comprises all possible road surface and gen-eral weather states.
The road event context comprises the set of events impacting on road usage patterns such as road works, major sports events, etc.
ITS applications extract information from the pre-processed sen-sor data and this information is associated or tagged with relevant context data.
The Route Profiling application uses the converted location, time and velocity data originally supplied by the GPS sensors to estimate traffic flow and journey times along segments of the road network. The core traffic flow value will be tagged with contextual informa-tion relating to the time at which the journey took place, the weather and road surface conditions at this time and other events which may have impacted on road usage patterns.
[image:4.595.73.262.57.208.2]3.
PROTOTYPE DESIGN AND
IMPLEMEN-TATION
We have implemented a prototype route profiling application which currently generates average journey times and traffic flow speeds along sections of the national route network with respect to a temporal context. Although our design takes account of weather and road event context, outstanding data collection issues have pre-vented us from exploiting this information to date.
3.1
Design Constraints
This project was partly sponsored by the National Roads Author-ity of Ireland (NRA). It was intended that any software developed as a result of this project would be compatible with existing NRA policies and systems. As a result of this several design and imple-mentation constraints were placed upon the project.
It was a design requirement that geocoded data records gener-ated by the system would be interoperable with other NRA man-agement applications. The location referencing system used by the road authority is the Irish National Grid reference system and we adopted this as our internal reference system when tagging sensor data. This is a two-dimensional or plane reference system which uses Easting and Northing Cartesian value pairs to represent points on the curved surface of the earth. Depending on the required prop-erties of the map various projections can be used to transform be-tween geodetic latitude,longitude values and two-dimensional grid coordinates [19]. The Irish National Grid reference system uses a Modified Transverse Mercator projection to convert geodetic ref-erences based on the Modified Airy reference ellipsoid to easting, northing value pairs.
The choice of Geographic Information System (GIS) engine and relational database used in the implementation was also dictated by the interoperability requirement.
3.2
Route Profiling Application
The system architecture is built upon the sensor processing and context extraction functions shown in Fig 2 and Fig 4 respectively. The GPS coordinates are converted into the internal referencing system and the data is converted into XML format and matched to the road network. Using a GIS engine these geocoded records are processed and journey times between points on the road network are calculated.
Map Matching
Due to underlying inaccuracies in GPS sensor data a map matching algorithm is used to project the records onto the road network. For each sensor record we define an error region which is a circle of radius 20 metres around the point specified by the record. All road segments lying within this area are selected and the record is pro-jected at right angles to the direction of the nearest road segment. The coordinates of this record are updated to reflect its projection onto the road network. The record is discarded if no matching road segments are found. Updated records are stored for use in the Jour-ney Identification and Timing routines.
Journey Identification and Timing
The primary purpose of the application is to record journey times along the national route network. The geocoded records contain discrete values for a vehicle’s location, time and velocity. This data must be processed to extract information about a vehicles trip and journey time.
If a vehicle’s location is determined to lie within the geographical region occupied by a town, then a Journey Record is created and the road name, origin, date and time are recorded for that journey.
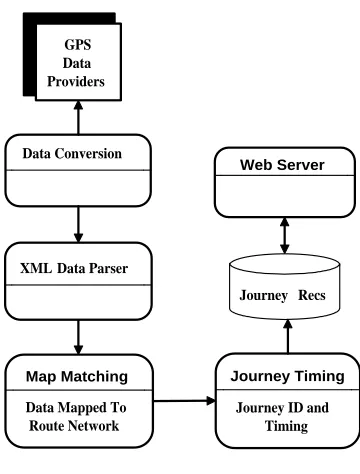
GPS Data Providers
Data Conversion
Map Matching
Data Mapped To Route Network
Journey Timing
Journey ID and Timing
Web Server
XML Data Parser
[image:5.595.345.525.50.287.2]Journey Recs
Figure 5: Data Flow
Successive readings are processed until the vehicle is determined to have entered the geographical region occupied by a destination town. Every successive reading must lie within time and distance tolerance levels set by the user. If the origin-destination pair is valid, i.e. if the towns are connected via a national route, then the journey time information is stored and tagged with time and location data. Otherwise the Journey Record is considered invalid and discarded.
3.3
Implementation
A logical data flow diagram of the system is presented in Fig 5. The data and coordinate conversion routines are computationally expensive and have been implemented in C. The converted data is validated using a SAX parser. An excerpt from the sensor data schema is reproduced here:
<xs:element name="dataRec" maxOccurs="unbounded"> <xs:complexType>
<xs:sequence>
<xs:element name="vehicleId" type="xs:integer" /> <xs:element name="date" type="xs:date" /> <xs:element name="time" type="xs:time" /> <xs:element name="weekday" type="xs:integer" /> <xs:element name="easting" type="xs:decimal" /> <xs:element name="northing" type="xs:decimal" /> <xs:element name="status" type="xs:integer" /> </xs:sequence>
</xs:complexType> </xs:element>
A sample xml data record corresponding to this schema is also reproduced here:
<dataRec>
<vehicleId>1234</vehicleId> <date>2002-11-04</date> <time>17:47:04</time> <weekday>1</weekday>
<easting>144143.733381</easting> <northing>252811.683735</northing> <status>0</status>
</dataRec>
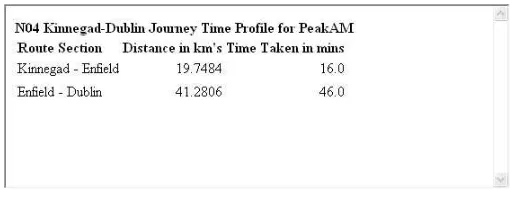
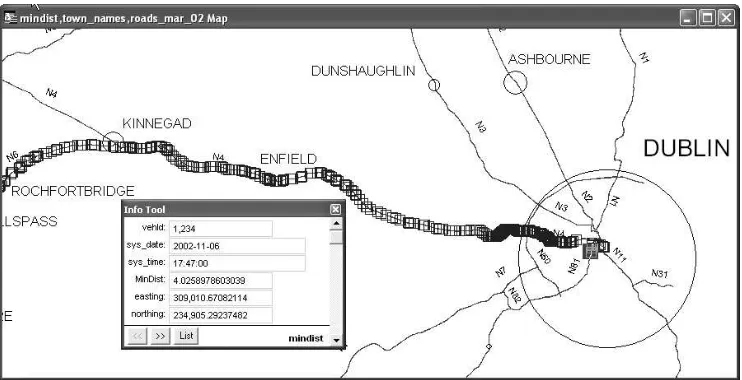
Figure 7: Kinnegad-Dublin Peak AM Journey Time
was supplied by the roads authority. A screenshot from the Route Profiling application is shown in Fig 6. The road network is rep-resented in the GIS engine by a series of polyline objects, while urban areas are represented by ellipse objects. The data shown in Fig 6 represents the readings from a single vehicle travelling along the N4 from Kinnegad to Dublin. As the vehicle approaches Dublin it encounters increased congestion which is reflected in the data bunching. The information associated with each record is also shown and includes the vehicle identification number, the record date and time, the distance from the road network prior to the map matching routines and the projected easting and northing location coordinates.
The journey times for the road segments are indexed by time context and stored in a SQL Server database. The journey times generated are shown in Fig 7. The location is the N04 route and the Kinnegad-Enfield and Enfield-Dublin segments. The time context is Peak AM, which is defined as Monday-Friday 6.00 a.m. to 10.00 a.m.
The quantity of sensor data required to profile all routes is di-rectly proportional to the granularity of context representation. The route profiling application indexes the national route network by road segments which connect adjacent towns. These road segments form an origin-destination matrix which is indexed by temporal context. Our prototype collects data on 45 road segments along 7 national routes. Currently we have defined a coarse-grained time context representation consisting of Peak AM, Peak PM and
Off-Peak slots. These time slots represent Weekdays 6.00 - 9.00 AM,
Weekdays 4.30-7.30 PM and all other times respectively.
4.
EVALUATION AND CONCLUSIONS
The NRA are currently evaluating the route profiling prototype using large data sets. In its current mode of operation the prototype generates a historical database of context-tagged journey times. There is no real-time requirement to the data processing, hence a performance based evaluation is of limited value. Instead the evalu-ation will focus on the accuracy and utility of data produced by the system and the application of context-aware computing techniques to the ITS domain.
4.1
Evaluation
Data Accuracy
At issue here is not the accuracy of GPS sensor data but rather how reflective the behaviour of probe vehicles are to road network conditions. Depending on the the level and quality of information required, 1-5% of the vehicle population must be fitted with sen-sors [21]. Applications such as automated incident detection will require a higher density of probe vehicles.
Our data set consists of 1,000 probe vehicles on the Irish road network fitted with GPS sensors. This provides us with a signifi-cant sample data set with an extensive geographical span. However
the current probe vehicle population represents less than 0.001% of the 1.3 million private vehicles on the road in 2001 [23]. Our prototype implementation is viewed by the road authorities as a proof of concept exercise. If the trial results in accurate journey times then potentially larger data sets are available through partner-ships with public transport operators. A thorough analysis on the accuracy of the estimated journey times will be available once we cross-reference our results with existing systems for journey-timing based on visual surveys, or fixed sensor network infrastructure.
System Utility
The practice of using journey times or traffic flow rates to man-age or monitor road networks is well established. Traditionally the data used in such systems was collected using fixed infrastruc-ture sensors described in this paper. The cost effectiveness and non-intrusive nature of probe vehicle sensors have led a number of transport authorities to begin investigating and using probe vehicle GPS data to estimate journey times [22, 21].
The novelty of our system design lies in the rich degree of con-textual information which we associate with journey time records. By extending our context model to include weather and road usage pattern as well as time data we can explore complex relationships in the data set which may not be readily apparent. For example we may be able to identify sections of the route network which perform particularly poorly given a certain set of weather circum-stances. Likewise we can accurately determine the impact on the network due to unusual road usage patterns occasioned by events such as road maintenance or accidents.
The journey time data produced by the system is also intended for use in traveller information systems. Accurately predicting journey times allows users to make informed decisions about route and transport mode selection. The key to accurate prediction based on historical data, lies in matching the current road network state or context against the closest historical context and selecting the jour-ney time accordingly. Advanced traveller information systems cur-rently exploit only spatial and temporal information when matching contexts. Our system will enable more accurate context matching and journey time estimation.
Increasing the complexity of our context model increases the value of our application for route management and travel informa-tion systems.
4.2
Conclusions
Our design accommodates weather and road usage pattern con-text. Once these data feeds are secured we will integrate them into the route profiling prototype. Currently the system is designed to profile the inter-urban road network. We are investigating the pos-sible context models and sensor types required to extend our cov-erage to include urban areas.
This system will operate on real world data and may be used as a future source of information in public information systems. This imposes strict data management requirements on the system. We need to guarantee the integrity of the data used and the privacy of probe vehicle owners. Addressing these issues will be an ongoing process.
In this paper we have examined the suitability of the ITS domain for the deployment of context-aware applications and presented the design and prototype implementation of a route profiling applica-tion developed for use by road management authorities.
Figure 6: Journey Identification
context extraction. Data processing routines have been developed to resolve these issues and a suitable context model for route pro-filing proposed. Using the processed sensor data, our GIS based application generates information on traffic flow and journey times along segments of the road network and tags the records with the relevant context. This information will enable road authorities to evaluate traffic flow rates and journey times on the national road network and will act as a valuable tool for network management and evaluation.
The application of context-aware computing techniques allows us to identify and exploit complex relationships in data sets and enables the development of a more accurate and useful tool for use in the ITS domain.
5.
ACKNOWLEDGEMENTS
This work was partly supported by the National Roads Authority of Ireland as part of their ITS research programme.
6.
REFERENCES
[1] M. Weiser. The Computer for the Twenty-First Century.
Scientific American, 265(3):94–104, September 1991.
[2] G Abowd, E Mynatt. Charting Past, Present, and Future Research in Ubiquitous Computing. ACM Transactions on
Computer-Human Interaction, Vol 7, 1:29-58, March 2000.
[3] L Klein. Sensor Technologies and Data Requirements for ITS. Artech House ITS Library Boston, 2001.
[4] N Ryan, J Pascoe, D Morse. FieldNote: extending a GIS into the field. Computer Applications in Archaelogy 1998 [5] N Ryan, D Morse, J Pascoe. FieldNote:a Handheld
Information System for the Field. First International
Workshop on TeleGeoProcessing May 1999.
[6] J Pascoe, D Morse, N Ryan. Developing Personal
Technology for the Field Personal Technologies vol 2, no 1, pp. 28-36, 1998.
[7] I Akyildiz, W Su, Y Sankarasubramaniam, E Cayirci. Wireless sensor networks: a survey. Computer Networks 38 393-422 2002.
[8] K Romer, O Kasten, F Mattern. Middleware Challenges for Wireless Sensor Netwroks. Mobile Computing and
Communications Review Vol 6 No 2.
[9] K Chan, J Miles eds. ITS Handbook 2000.
Recommendations from the World Road Association Artech
House ITS Library Boston, 2000.
[10] Terms of Reference for ITS Strategic Planning. Transport
Canada http://www.itscanada.ca March 2000.
[11] Intelligent Transporttaion Systems Benefits and Costs. US Department of Transportation
http://www.itsdocs.fhwa.dot.gov 2003.
[12] European Transport policy for 2010: time to decide. European Commission - DG Energy and Transport. http://europa.eu.int
[13] A Dey, G Abowd. Towards a Better Understanding of Context and Context-Awareness CHI Workshop on the
What,Who,Where,When,Why and How of Context-Awareness
April 2000.
[14] National Roads Authority - Review 2001 and Programme for 2002. Irish National Roads Authority Publications 2001. [15] US Highway Capacity Manual. Highway Capacity and
Quality of Service Committee A3A10.
[16] Met Eireann - The Irish Meteorological Service. http://www.met.ie.
[17] A guide to coordinate systems in Great Britain. Ordnance Survey of Great Britain. August 2001.
[18] The Irish Grid - A Description of the Co-ordinate Reference System used in Ireland. Ordnance Survey Of Ireland. 1996. [19] R Osserman. Poetry Of The Universe. Orion Books London
1995.
[20] B Schilit, N Adams, R Want. Context Aware Computing Applications First International Workshop on Mobile
Computing Systems and Applications 1994
[21] W Huber, M Ladke, R Ogger. Extended Floating-CarData For The Acquisition of Traffic Information. Technical Report BMW Group http://www.bmwgroup.com [22] The Scottish Executive National Driver Information and
Control System http://www.nadics.org.uk