Assembling Narratives with Associative Threads
Pierre-Luc Vaudry and Guy Lapalme RALI-DIRO – Universit´e de Montr´eal
C.P. 6128, succ. Centre-Ville Montr´eal, QC, Canada H3C 3J8
{vaudrypl,lapalme}@iro.umontreal.ca
Abstract
A model is proposed showing how automati-cally extracted and manually written associa-tion rules can be used to build the structure of a narrative from real-life temporal data. The generated text’s communicative goal is to help the reader construct a causal representation of the events. A connecting associative thread al-lows the reader to follow associations from the beginning to the end of the text. It is created using a spanning tree over a selected associa-tive sub-network. The results of a text qual-ity evaluation show that the texts were under-standable, but that flow between sentences, al-though not bad, could still be improved.
1 Introduction
A narrative is a text presenting with a certain angle a series of logically and chronologically related events caused or experienced by actors (Bal, 2009, p. 5). A data-to-text system summarizing temporal data in-cluding actions or activities should aim at generating such a text, if that corresponds to its users’ needs. Some have pointed at causal relations as a means of improving the narrative aspect of temporal data-to-text (Hunter et al., 2012; Gerv´as, 2014).
The concepts of causal network and causal chain have been used to explain the process of narra-tive comprehension in humans (Trabasso and van Den Broek, 1985; Trabasso et al., 1989). Those causal networks are essentially composed of phys-ical and mental events and states (of which goals and actions) connected by causal relations. Restric-tions apply on which types of causal relation can
connect which types of event or state. The causal chain comprises the events that are on a path travers-ing the causal network from the introduction of the protagonists and setting to either goal attainment or the consequences of failure. Being on a causal chain and having more causal connections have both been found to increase chances of an event being recalled, included in a summary or judged important by the reader.
Swartjes and Theune (2006) and Theune et al. (2007) applied causal networks to the automatic creation of fairy tales. Several narrative data-to-text systems already identify and make use of some causal relations (Hallett, 2008; Hunter et al., 2012; Wanner et al., 2010; Bouayad-Agha et al., 2012). Going further, in Vaudry and Lapalme (2015) we have tried to extract a form of causal network from temporal data and use it to build the structure of the generated narrative. We used data mining tech-niques to extract sequential association rules and in-terpreted them as indicating potential, approximate causal relations. The resulting causal network was used to express locally some rhetorical relations in the sense of the Rhetorical Structure Theory (RST) (Mann and Thompson, 1987). However we did not succeed at exploiting it to build a complete rhetorical structure that would give the text a global coherence. Building on what was begun, this paper proposes a model showing how automatically extracted and manually written association rules can be used to build the entire structure of a narrative from real-life temporal data.
potential causal relation from an extracted associa-tion (see Secassocia-tion 4). If even that could not be deter-mined, how could we claim to identify causal rela-tions? We prefer to simply nameassociationsthe re-lations found during data interpretation. The task of inferring causal relations is left to the human reader of the generated text.
By association, we mean a connection between events or states without specifying the nature of the underlying relation. For example, an association can be based on a frequent sequence or a formal similar-ity. For the purpose of narrative comprehension, we assume that interesting associations are those that can help formulate causal hypotheses.
Note that although this is not a model for creating fictional narratives, its function is to suggest new as-sociations between previously unassociated events. In this sense and to the extent that it accomplishes this, it can be considered to produce original, cre-ative text (Jordanous, 2012, p. 257).
The proposed model assumes that the human reader can follow an associative thread from the be-ginning to the end of the text. The associations ex-pressed between some of the events can give him hints toward building a mental representation of the events. His world and domain knowledge can en-able him to sort through the expressed associations to retain and enrich the relevant ones. This can lead him to fill the gaps left by the text towards a causal interpretation of the events.
Section 2 presents our model of assisted tempo-ral data interpretation. Section 3 presents the results of our efforts so far to evaluate this model. Related work is discussed in Section 4.
2 Model
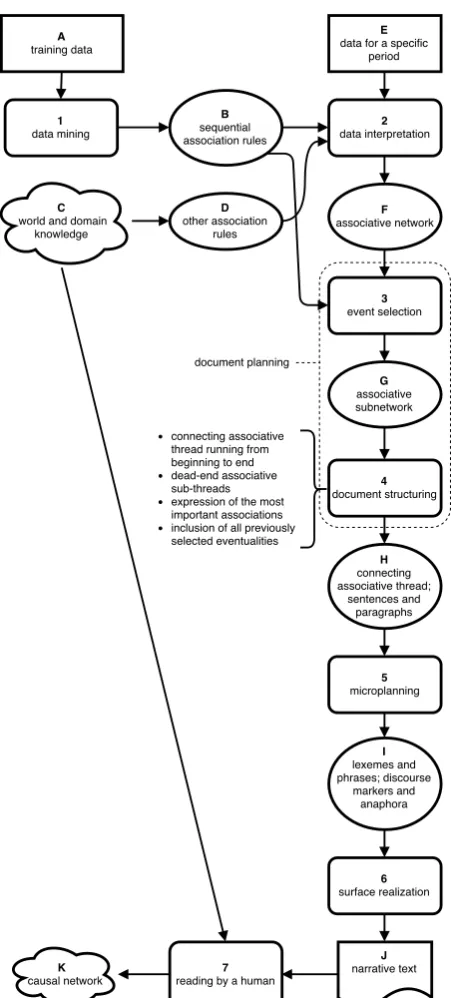
This section presents our model of assisted temporal data interpretation using narrative generation. Fig-ure 1 gives an overview of this model. We will refer to its components by using numbers for steps and letters for representation levels. Association rules come from two sources: data mining (1) for se-quential association rules (B) from training data (A) and world and domain knowledge (C) formalized as rules (D). The data about a specific period (E) is in-terpreted (2) using the association rules to create an associative network (F). Then a sub-network
con-taining the most unusual facts (G) is selected (3) us-ing the probabilities of the correspondus-ing sequential association rules (B). The following step of docu-ment structuring (4) involves determining the con-necting associative thread going from the beginning to the end of the narrative (H). Microplanning (5) produces from this the lexico-syntactic specification (I). This specification is then realized (6) as a text (J) read by a human (7). The human reader uses his knowledge (C) to reason about the associations ex-pressed in the text. From this he forms a mental rep-resentation which hypothetically includes a form of causal network (K). The following subsections de-tail each of these steps.
The communicative goal of the generated text in the context of this model is to communicate effec-tively the facts necessary to facilitate the construc-tion of a causal network by the reader. By neces-sary facts, we mean the least easily predictable facts. Those facts are the most unusual (or least usual) of the summarized period compared to a typical pe-riod of the same kind of data. They are what makes this period unique. The associations expressed in the generated text should give valuable hints to the reader in constructing a causal mental representation of the events. Moreover, they should generally help see the events of the period as a coherent whole if such coherence can be found. This should help the reader assimilate effectively the text’s content.
The facts not mentioned in the text should be im-plicitly understood as “same as usual” and the reader should be able to infer them approximately from the text’s content if needed. According to Niehaus and Young (2014), the reader will make such an infer-ence if it is necessary to the comprehension of the text (because of a break in a causal chain, for ex-ample) and not too difficult to make. The knowl-edge that the reader has of what usually happens, if the sequential association rules model that correctly enough, should enable the reader to make such in-ferences. In the case of the inferences that could be triggered in the reader by the expressed associa-tions, it is much more difficult to use the criteria of necessity and enabledness, as exactly what should be inferred or not is not known by the computer.
Figure 1: Assisted temporal data interpretation model. Rect-angles represent input data; rounded rectRect-angles: computational representations; ellipses: steps; clouds: hypothesized mental representations; rectangle with S-shaped bottom side: natural language document. For ease of reference, steps are identified by a number and representations by a letter.
5. The data it is based on is taken from the publicly available UCI ADL Binary Dataset (Ord´o˜nez et al., 2013). This dataset contains 14 and 21 consecutive days of ADL data for users A and B, respectively. The data for each ADL occurrence consists of: start time, end time and activity label. The ADL label set is: Sleeping, Toileting, Grooming, Showering, Breakfast, Lunch, Dinner, Snack, Spare Time/TV, Leaving. The input for this example consists of the data for user B as training data (A) and the portion covering the day of November 24, 2012 as the data to summarize (E).
2.1 Association Rules
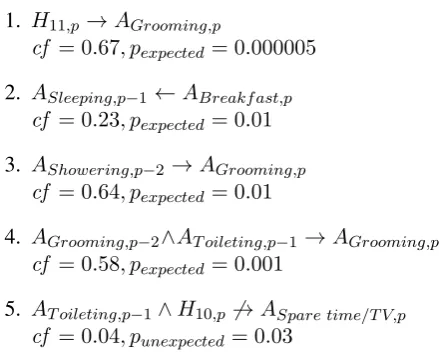
Sequential Association Rule Mining: In step 1 on Figure 1, data mining techniques are used to se-lect candidate sequential association rules based on confidence and significance. Confidence (cf in
Fig-ure 2) is computed as the conditional probability of encountering an instance of the rule given that the left side has been encountered. Depending on the confidence, associations are considered expected or unexpected. In the example, expected association rule candidates had cf > 0.2 and unexpected as-sociation rule candidates had cf < 0.07. This is
roughly justified by the fact that since there are 10 activity types, the prior probability of one happen-ing at any place in the sequence is0.1. Significance
measures the chances of the left and right sides of the rule of actually being independent according to the binomial distribution. In Figure 2, the p-values according to this distribution are calledpexpectedand
punexpectedfor expected and unexpected association rules, respectively. In the example, a p-value lower than0.05was considered significant.
A rule can express a backward prediction. The chronological direction of each association rule is determined by computing the confidence for the two possible directions (chronological and reverse chronological) and retaining the direction with the highest one. That means that for candidate associ-ation AB, we checked which we could predict with more confidence: that B follows A or that A pre-cedes B. This enabled us to better estimate the un-usualness of each fact and thus improve content se-lection.
Mined sequential association rules:
1. H11,p →AGrooming,p
cf = 0.67, pexpected= 0.000005
2. ASleeping,p−1 ←ABreakf ast,p
cf = 0.23, pexpected= 0.01
3. AShowering,p−2 →AGrooming,p
cf = 0.64, pexpected= 0.01
4. AGrooming,p−2∧AT oileting,p−1 →AGrooming,p
cf = 0.58, pexpected= 0.001
5. AT oileting,p−1∧H10,p 6→ASpare time/T V,p
cf = 0.04, punexpected= 0.03
World and domain knowledge association rule:
6. Ai,p
Same category
←−−−−−−−−→Aj,q ⇐⇒ category(i) =
[image:4.595.70.290.102.279.2]category(j)
Figure 2:Association rule examples.AandHare categorical variables and stand respectively for activity and hour of the day (hours 0-23, not considering minutes). Ai, pstands for a
par-ticular type of activityiat positionpin the event sequence.cf stands for confidence. pexpectedandpunexpected are p-values
that measure the significance of expected and unexpected asso-ciation rules, respectively (lower is better).
World and Domain Knowledge Rules: World and domain knowledge can be formalized as rules (C and D in Figure 1). Those rules can be manu-ally entered or come from an existing ontology, for example. The associations they create have the ad-vantage of linking events regardless of their place in the sequence. That means that we can use them to create long-distance links in the text while keeping temporally close events also close in the text.
Rule 6 of Figure 2 is a simple but effective ex-ample of a manually entered association rule. It defines a Same category association. For the pur-pose of the ADL example, we arbitrarily grouped the ADL types into categories in the following manner. Toileting,Grooming, andShoweringwere placed in the category of personal hygiene activities. Break-fast,Lunch,Dinner, andSnackwere grouped as eat-ing activities. Spare Time/TV, Leaving, and Sleep-ingwere kept in separate categories.
2.2 Data Interpretation
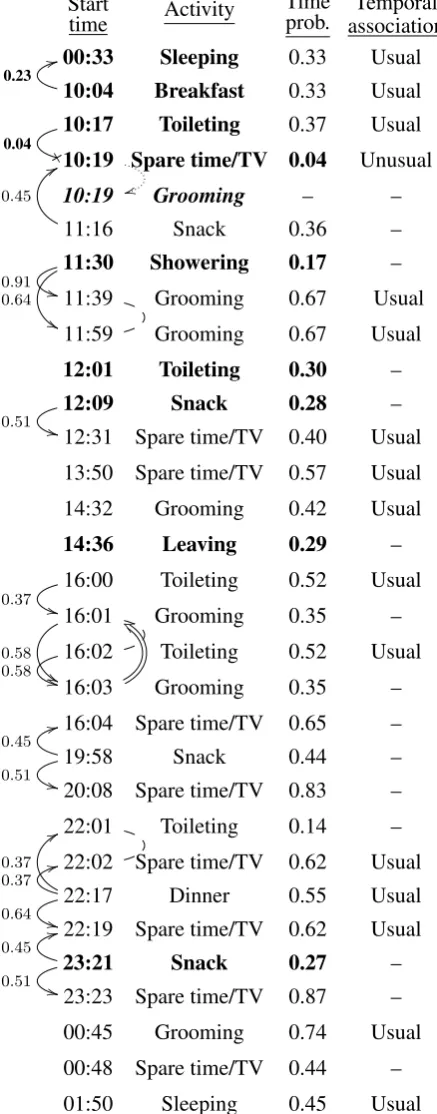
Step 2 of Figure 1 consists of searching the data to summarize for instances where an association rule applies. Sequential associations are derived from rules such as Rules 2 to 5 from Figure 2. They are shown as arrows going from one row to another at the left of Figure 3. The arrow labels indicate the confidence of the corresponding association rule. Temporal associations are derived from rules such as Rules 1 and 5 from Figure 2. They are indicated by the Time prob. andTemporal association columns in Figure 3. Usual means that an expected asso-ciation was found and Unusual indicates an unex-pected association. No indication means that time was not considered significantly useful in predicting those occurrences (no association rule). The proba-bility conditional on time (the confidence of the cor-responding association rule candidate) is in any case indicated as it will be used for content selection.
From there, some extra associations are derived and added to the network. The Repetition associa-tion is generated whenever the type of activity that appears on the right side of the association rule also appears on the left side.Conjunctionis added when two sequential associations start or end at the same activity. Their other ends are then linked by a Con-junction association. The Instead association ap-pears when an unexpected association is found. It indicates what would have been the most probable alternate activity according to the sequential associ-ation rule model. Derived associassoci-ations are shown on the right of the first column of Figure 3.
2.3 Event Selection
As can be seen on Figure 1, event selection (step 3) takes as input the associative network and outputs a sub-network of its input. Note that final association selection takes place later, during document structur-ing, as they are used to build the document structure. In Figure 3, the output of event selection is shown in bold type. Event selection has one parameter: a maximum probability threshold. Events that have either a probability conditioned on time or an as-sociation with a confidence lower or equal to the threshold are selected. In this example, the maxi-mum probability threshold was set to0.3. Generally
Start
time Activity Timeprob. associationTemporal
00:33 Sleeping 0.33 Usual
10:04
0.23 33
Breakfast 0.33 Usual
10:17
0.04 2 Toileting 0.37 Usual
10:19
s
s
Spare time/TV 0.04 Unusual
10:19 Grooming – –
11:16 0.45
7
7
Snack 0.36 –
11:30 0.91 + + 0.64 ' '
Showering 0.17 –
11:39 Grooming 0.67 Usual
11:59 Grooming 0.67 Usual
12:01 Toileting 0.30 –
12:09
0.51
+
+
Snack 0.28 –
12:31 Spare time/TV 0.40 Usual 13:50 Spare time/TV 0.57 Usual
14:32 Grooming 0.42 Usual
14:36 Leaving 0.29 –
16:00 0.37
+
+
Toileting 0.52 Usual
16:01 0.58
'
'
Grooming 0.35 –
16:02 0.58
+
+
Toileting 0.52 Usual
16:03
c
k
Grooming 0.35 –
16:04 Spare time/TV 0.65 –
19:58 0.45 33
0.51
+
+
Snack 0.44 –
20:08 Spare time/TV 0.83 –
22:01 Toileting 0.14 –
22:02 Spare time/TV 0.62 Usual 22:17
0.37
7
7
0.37 33
0.64
+
+
Dinner 0.55 Usual
22:19 Spare time/TV 0.62 Usual
23:21
0.45 33
0.51
+
+
Snack 0.27 –
23:23 Spare time/TV 0.87 –
00:45 Grooming 0.74 Usual
00:48 Spare time/TV 0.44 –
[image:5.595.66.285.92.650.2]01:50 Sleeping 0.45 Usual
Figure 3: Associative network for user B on November 24, 2012. The events selected with maximum probability0.3are shown in bold type. Sequential associations are on the left. The X-headed arrow represents an unexpected association. On the right areInstead(dotted),Conjunction(dashed), andRepetition (double).Same categoryassociations are not shown.
how well the sequential rule model captures what usually happens and the desired average length of the generated text.
2.4 Document Structuring
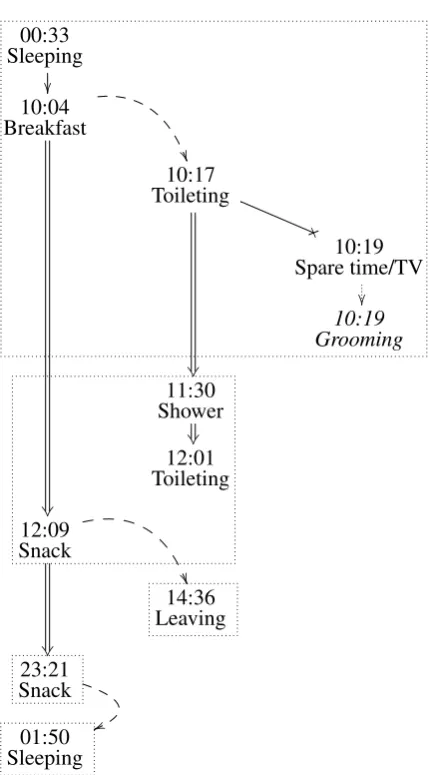
Connecting Associative Thread: The main goal of document structuring (step 4 in Figure 1) is to give the text a simple narrative structure including a beginning, a middle section, and an end. The im-portance of this structure for narrative generation was highlighted by a comparison with human writ-ten texts (McKinlay et al., 2009). The first event of the period (chronologically) is selected to be the be-ginning of the text and is called the initial situation (Sleeping 00:33in the example of Figure 3). The last event of the period is correspondingly called the fi-nal situation (Sleeping 01:50in the example). The (rest of the) selected associative sub-network will form the middle section (in bold type in Figure 3). The best event pairs are then chosen to link the se-lected events with each other. In the example, event pairs with sequential associations are preferred over those with onlySame category associations. Man-ually set parameters, called association preferences, define which association types are preferred. They take a value between 0.0 and1.0. A smaller value
gives an event pair with this association type more chances to be chosen. When no other association is present, the default association of temporal prox-imity is used with association preference 1.0. The
association preference is combined (by averaging) with the relative temporal distance in order to favor temporally close event pairs. The resulting score is then used as a distance to compute a minimum span-ning tree on the selected associative sub-network.
00:33 Sleeping
10:04 Breakfast
10:17 Toileting
,
10:19 Spare time/TV
10:19 Grooming
11:30 Shower
12:01 Toileting
12:09 Snack
14:36 Leaving
23:21 Snack
v
v
[image:6.595.65.281.75.463.2]01:50 Sleeping
Figure 4:Connecting associative thread for user B on Novem-ber 24, 2012. Arrows represent associations: simple: expected sequence; X-headed: unexpected sequence; double: Same cat-egory; dotted:Instead; curved and dashed: temporal proximity. Paragraphs are boxed. The vertical order of presentation is the order of mention in the generated text (Figure 5). For event selection, the maximum probability threshold was set to0.3.
Research on causality in narrative comprehension has uncovered that events on the causal chain go-ing from the beginngo-ing to the end of the story are more often recalled than those on dead-end parts of the causal network (Trabasso and van Den Broek, 1985). In the future, it may be interesting to ver-ify if eventualities on the associative sub-threads are less remembered than those on the main associative thread. If this is the case, the content structuring al-gorithm should be modified to optimize the impor-tance of the expressed associations together with the
proportion and importance of the eventualities in-cluded in the main associative thread. However tak-ing into account the relative temporal distance in the computation of the minimum spanning tree already tends to avoid a too short main associative thread.
Paragraph and Sentence Segmentation: The document content is then segmented into sentences and paragraphs. The style can be varied by adjust-ing two parameters: the average number of events introduced in one sentence and the average number of sentences in one paragraph. Those parameters are used to calculate the number of breaks needed between sentences and paragraphs. The candidate break points are between consecutive event pairs in the document plan. The actual break points are selected according to the distance computed previ-ously for the determination of the minimum span-ning tree. The greatest distances correspond to para-graph breaks, then sentence breaks, and lastly phrase boundaries. Paragraphs are boxed in Figure 4.
At this point, a mapping is made between the se-lected associations and the rhetorical relations that will be expressed in the text. In the example, se-quential associations are expressed by a Temporal Sequence relation and Same category associations are expressed by a Conjunction relation.
2.5 Microplanning
Microplanning (step 5 of Figure 1) translates the rhetorical structure into a lexico-syntactic specifica-tion. Each sentence plan tree is traversed depth-first. When a leaf is visited, a specification of the corre-sponding eventuality’s description is produced from lexico-syntactic templates. When an internal node is visited, the rhetorical relations linking the two chil-dren nodes are expressed with appropriate discourse markers. Those markers are then used to assemble the lexico-syntactic specifications obtained from the children nodes.
the preceding paragraph in the case of the first sen-tence of a paragraph, the marker appears alone. If not, an anaphoric expression is added that restates the parent event. For example, the parent of Toilet-ing 12:01in Figure 4 isShower 11:40. Since it is the main event of the preceding sentence, no anaphor is added and we have just the marker alsoin the gen-erated text (Figure 5). On the contrary, the parent of Snack 12:09isBreakfast 10:04. It is located in an-other paragraph. Consequently, the marker becomes beside his 10:04 PM breakfast.
2.6 Surface Realization
Surface realization (step 6 of Figure 1) was per-formed using the SimpleNLG-EnFr Java library (Vaudry and Lapalme, 2013). During surface real-ization, the syntactic and lexical specifications are combined with the output language grammar and lexicon to generate formatted natural language text. The lexico-syntactic templates used in microplan-ning were written for both English and French out-put languages. In combination with SimpleNLG-EnFr, this enabled bilingual generation.
An example of English generated text correspond-ing to the precedcorrespond-ing figures is given in Figure 5.
2.7 Human Reading
Finally, in step 7 of Figure 1 a human reader com-bines his world and domain knowledge with the gen-erated text to construct a causal mental representa-tion of the events. For that the reader can follow the connecting associative thread through the text while trying to infer possible causal relations.
We hypothesize that statistically identifying se-quential associations is a useful pre-processing of the data for the purpose of determining causal re-lations. Association rules based on type could also be helpful because events of the same type some-times have the same cause or the same type of cause. Other association rules based on such causal reason-ing could also give useful hints. In any case, the reader can choose to ignore irrelevant associations.
For example, the fact that the clauses expressing Sleeping 00:33andBreakfast 10:04are coordinated in the same sentence and linked by the temporal marker then could lead the reader to different con-clusions depending of his knowledge. On one hand, he could think that maybe the user was particularly
OrdonezB Saturday, 24 November 2012 12:33 AM - Sunday,
25 November 2012 09:24 AM
---OrdonezB got up at 10:02 AM and then he ate his breakfast. As usual at 10:17 AM he went to the toilet but then he unexpectedly spent 1 hour in the living room instead of grooming.
In addition to having gone to the toilet at 10:17 AM, he took a shower at 11:30 AM. Also at 12:01 PM he went to the toilet. Beside his 10:04 AM breakfast, he had a snack at 12:09 PM.
At 2:36 PM he left for 1 hour.
In addition to his 12:09 PM snack, he had a snack at 11:21 PM.
As usual at 1:50 AM he went to bed.
Figure 5:Generated text example for user B on November 24, 2012. The maximum probability threshold was set to0.3.
hungry when he woke up that morning; he could ponder why. On the other hand, he could also ig-nore this sequence as just a random happening. An-other example: the fact thatSnack 23:21references Snack 12:09 could make the reader conclude that maybe the user was often hungry on that day and maybe there was a common cause for that. Or the reader may ignore this, reasoning thatSnack 12:09 was probably in reality aLunchactivity. The point is that some of the associations can help the reader in forming causal hypotheses. The reader can later ver-ify those, for example by asking the user. Moreover, those causal hypotheses can help the reader remem-ber the content of the text.
3 Evaluation
0"1" 0"1" 0" 0" 0" 0" 1" 1" 1" 1" 2"
2"
2"
2"
2"
2" 3" 3" 3"
3"
3"
3" 4"
4"
4" 4"
4"
4"
5"
5"
5"
5"
5"
5"
0" 5" 10" 15" 20" 25"
[image:8.595.66.292.85.167.2]Overall" Style" Gramma3cality" Flow" Vocabulary" Understandability"
Figure 6:Results of the text quality evaluation.
0.4 for user A and0.3for user B. User A’s routine seems to be easier to capture by the sequential rule model than user B’s. Hence the probability for user A’s activities is generally higher than for user B’s.
Because no human-written equivalent of the gen-erated ADL reports exists, it would have been mean-ingless to try to write some to make the comparison. Therefore only the generated texts are evaluated.
13 judges evaluated four to five generated texts each, so that 28 texts were evaluated by two judges each and 4 texts by one judge. The judges had to evaluate the texts on a 0 to 5 scale for six criteria:
Overall, Style, Grammaticality, Flow (between
sen-tences), Vocabulary, and Understandability. They could also leave comments. The evaluation forms, generated texts and answers are publicly available1.
If we view all the evaluations taken together as evaluating the data-to-text system as a whole, as op-posed to individual texts, we get the results shown in Figure 6. The best ratings are forUnderstandability
andVocabularywith peaks at 5 and 4, respectively.
The worst ratings are forFlowwith a peak at 3. This could indicate some deficiencies in document plan-ning and/or microplanplan-ning. However, according to the goodUnderstandability ratings, the texts do not seem as badly planned as to be confusing. The re-sults for Grammaticality are hard to interpret, since there are two peaks: one at 3 and one at 5. By look-ing at the evaluations, we think it could be because this criterion was not defined clearly enough.
Over-allandStylehave most ratings ranging from 2 to 5,
with peaks at 4.
4 Related Work
Chambers and Jurafsky (2008) learn narrative event chains (partially ordered sets of events with a com-mon protagonist) from a news stories corpus. For
1http://www-etud.iro.umontreal.ca/%7Evaudrypl
/ADL/eval/
this they use pointwise mutual information (PMI) to measure the relation between two events, instead of the probability of independence according to the bi-nomial distribution. They then use a temporal classi-fier to determine a partial order. Finally, they cluster events using the PMI scores to form in effect undi-rected n-ary associations. Those could be converted to directed associations if confidence was also com-puted.
With the help of focus and inferencing models, Niehaus and Young (2014) generate narratives in which some events need to be causally inferred by the reader. Those inferences are precisely defined as part of the input, whereas in our model only hints are available about the causal relations to be found by the reader.
Le´on and Gerv´as (2010) also use causality-related relations to structure narratives. Their algorithm learns preconditional rules between events of a fic-tional story with the help of human feedback. An as-sumption is made that every event must be directly or indirectly a precondition to the last event of the story. Although this may make sense for a fictional story, it could involve selecting out important infor-mation when starting from real-life data.
In the context of generating a narrative from data with multiple actors, Gerv´as (2014) associates ac-tions having the same actor. This makes sense, be-cause actions by the same actor can certainly be di-rectly or indidi-rectly causally related. However, our prototype having been tested only on data with a sin-gle actor, this tactic would not have been adequate here.
Farrell et al. (2015) use regular expressions to de-fine explanation specifications for error trace data. Regular expressions could also be used to manually define association rules in the context of our model. Baez Miranda et al. (2014) use a task model to provide top-down constraints on the sequence of scenes that can be identified in the data to form the structure of the narrative. In contrast, our model can be said to be more bottom-up in the importance it gives to automatically extracted associations.
less transparent since we did not use dedicated pa-rameters. Furthermore we extracted only chronolog-ical sequential association rules. We interpreted this chronological direction as the direction of causality. This partly justified our claim of identifying approx-imate causal relations. By looking at the results of data interpretation, we now come to the conclusion that there is no clear link between the direction of the rule and the direction of a potential causal relation.
In addition, we selected which events to include in the text in what we called the summarization step, which we placed after document planning. This has the disadvantage of undoing some of the document planner’s work. We selected events using the proba-bility of this event type happening at any point in the event sequence. We now find that using the proba-bility conditioned on time results in a greater propor-tion of the associative sub-network being connected. This leads to a better text structure. Note that we use for our current example the same data as before, with a maximum probability threshold of0.3instead of0.4.
5 Conclusion
We presented a data-to-text model demonstrating that it is possible to structure a narrative around a mix of automatically mined and manually defined associations. The model also relies on sequential as-sociations for event selection. The generated text’s communicative goal is to help the reader assimilate the facts necessary to construct a causal representa-tion of the events. According to the model, the con-necting associative thread allows the reader to fol-low associations from the beginning to the end of the text. This structure takes the form of a spanning tree over a selected associative sub-network.
The textual quality of the generated texts was rated by judges. The results show that the texts were understandable, but that flow between sentences, al-though not bad, could still be improved. A possi-ble solution would be to modify document structur-ing such as to minimize discontinuities. Accordstructur-ing to the event-indexing model (Zwaan et al., 1995), sentence-reading times increase with the number of discontinuities in temporality, spatiality, protag-onist, causality, or intentionality.
We are currently designing a memorization
exper-iment to test if the generated texts help the reader as-similate unusual facts independently of the domain. Apart from that, a task-oriented evaluation with do-main experts could be organized. Furthermore texts could be generated from bigger datasets or datasets belonging to other domains. It would be interesting to fine-tune all parameters for each of those to see if ideal values vary from domain to domain.
References
Bel´en A Baez Miranda, Sybille Caffiau, Catherine Gar-bay, and Franc¸ois Portet. 2014. Task based model for r´ecit generation from sensor data: an early experiment. In5th International Workshop on Computational Mod-els of Narrative, pages 1–10.
Mieke Bal. 2009. Narratology : introduction to the the-ory of narrative. University of Toronto Press, Toronto, 3rd ed. edition.
Nadjet Bouayad-Agha, Gerard Casamayor, Simon Mille, and Leo Wanner. 2012. Perspective-oriented Gen-eration of Football Match Summaries: Old Tasks, New Challenges. ACM Trans. Speech Lang. Process., 9(2):3:1–3:31, August.
Nathanael Chambers and Daniel Jurafsky. 2008. Unsu-pervised Learning of Narrative Event Chains. InACL, volume 94305, pages 789–797. Citeseer.
Rachel Farrell, Gordon Pace, and M Rosner. 2015. A Framework for the Generation of Computer Sys-tem Diagnostics in Natural Language using Finite State Methods. InProceedings of the 15th European Workshop on Natural Language Generation (ENLG), pages 52–56, Brighton, UK, September. Association for Computational Linguistics.
Pablo Gerv´as. 2014. Composing narrative discourse for stories of many characters: A case study over a chess game.Literary and Linguistic Computing, August. Catalina Hallett. 2008. Multi-modal presentation of
medical histories. InProceedings of the 13th interna-tional conference on Intelligent user interfaces, pages 80–89.
James Hunter, Yvonne Freer, Albert Gatt, Ehud Reiter, Somayajulu Sripada, and Cindy Sykes. 2012. Au-tomatic generation of natural language nursing shift summaries in neonatal intensive care: BT-Nurse. Ar-tificial intelligence in medicine.
Anna Jordanous. 2012. A standardised procedure for evaluating creative systems: Computational creativity evaluation based on what it is to be creative.Cognitive Computation, 4(3):246–279.
Narra-tives Based on Heuristics over Surface Form. In2010 AAAI Fall Symposium Series, November.
William C. Mann and Sandra A. Thompson. 1987. Rhetorical structure theory: A theory of text organi-zation. University of Southern California, Information Sciences Institute.
A. McKinlay, C. McVittie, E. Reiter, Y. Freer, C. Sykes, and R. Logie. 2009. Design Issues for Socially In-telligent User Interfaces: A Discourse Analysis of a Data-to-text System for Summarizing Clinical Data. Methods of Information in Medicine, 49(4):379–387, December.
James Niehaus and R. Michael Young. 2014. Cog-nitive models of discourse comprehension for narra-tive generation. Literary and Linguistic Computing, 29(4):561–582, December.
Fco Javier Ord´o˜nez, Paula de Toledo, and Araceli San-chis. 2013. Activity Recognition Using Hybrid Gen-erative/Discriminative Models on Home Environments Using Binary Sensors. Sensors, 13(5):5460–5477, April.
Ivo Swartjes and Marit Theune. 2006. A fabula model for emergent narrative. InTechnologies for Interactive Digital Storytelling and Entertainment, pages 49–60. Springer.
Marit Theune, Nanda Slabbers, and Feikje Hielkema. 2007. The Narrator: NLG for digital storytelling. In Proceedings of the Eleventh European Workshop on Natural Language Generation, pages 109–112. Asso-ciation for Computational Linguistics.
Tom Trabasso and Paul van Den Broek. 1985. Causal Thinking and the Representation of Narrative Events. Journal of Memory and Language, 24(5):612–630, October.
Tom Trabasso, Paul Van den Broek, and So Young Suh. 1989. Logical necessity and transitivity of causal rela-tions in stories.Discourse Processes, 12(1):1–25. Pierre-Luc Vaudry and Guy Lapalme. 2013. Adapting
SimpleNLG for bilingual English-French realisation. In Proceedings of the 14th European Workshop on Natural Language Generation, pages 183–187, Sofia, Bulgaria, August. Association for Computational Lin-guistics.
Pierre-Luc Vaudry and Guy Lapalme. 2015. Narrative Generation from Extracted Associations. In Proceed-ings of the 15th European Workshop on Natural Lan-guage Generation, pages 136–145, Brighton, United Kingdom, September. Association for Computational Linguistics.
Leo Wanner, Bernd Bohnet, Nadjet Bouayad-Agha, Fra-nois Lareau, and Daniel Nickla. 2010. Marquis: Generation of User-Tailored Multilingual Air Quality Bulletins. Applied Artificial Intelligence, 24(10):914– 952.