A Regression Model of Adjective-Noun Compositionality
in Distributional Semantics
Emiliano Guevara
Tekstlab, ILN, University of Oslo Oslo, Norway
Abstract
In this paper we explore the computational modelling of compositionality in distri-butional models of semantics. In par-ticular, we model the semantic composi-tion of pairs of adjacent English Adjec-tives and Nouns from theBritish National Corpus. We build a vector-based seman-tic space from a lemmatised version of the BNC, where the most frequent A-N lemma pairs are treated as single tokens. We then extrapolate three different mod-els of compositionality: a simple additive model, a pointwise-multiplicative model and a Partial Least Squares Regression (PLSR) model. We propose two evalu-ation methods for the implemented mod-els. Our study leads to the conclusion that regression-based models of composition-ality generally out-perform additive and multiplicative approaches, and also show a number of advantages that make them very promising for future research.
1 Introduction
Word-space vector models or distributional mod-els of semantics (henceforth DSMs), are com-putational models that build contextual seman-tic representations for lexical items from corpus data. DSMs have been successfully used in the recent years for a number of different computa-tional tasks involving semantic relations between words (e.g. synonym identification, computation of semantic similarity, modelling selectional pref-erences, etc., for a thorough discussion of the field, cf. Sahlgren, 2006). The theoretical foundation of DSMs is to be found in the “distributional hypoth-esis of meaning”, attributed to Z. Harris, which maintains that meaning is susceptible to distribu-tional analysis and, in particular, that differences
in meaning between words or morphemes in a language correlate with differences in their distri-bution (Harris 1970, pp. 784–787).
While the vector-based representation of word meaning has been used for a long time in com-putational linguistics, the techniques that are cur-rently used have not seen much development with regards to one of the main aspects of semantics in natural language: compositionality.
To be fair, the study of semantic composition-ality in DSMs has seen a slight revival in the re-cent times, cf. Widdows (2008), Mitchell & La-pata (2008), Giesbrecht (2009), Baroni & Lenci (2009), who propose various DSM approaches to represent argument structure, subject-verb and verb-object co-selection. Current approaches to compositionality in DSMs are based on the appli-cation of a simple geometric operation on the basis of individual vectors (vector addition, pointwise-multiplication of corresponding dimensions, ten-sor product) which should in principle approxi-mate the composition of any two given vectors.
On the contrary, since the the very nature of compositionality depends on the semantic rela-tionbeing instantiated in a syntactic structure, we propose that the composition of vector representa-tions must be modelled as a relation-specific phe-nomenon. In particular, we propose that the usual procedures from machine learning tasks must be implemented also in the search for semantic com-positionality in DSM.
In this paper we present work in progress on the computational modelling of compositionality in a data-set of English Adjective-Noun pairs ex-tracted from the BNC. We extrapolate three differ-ent models of compositionality: a simple additive model, a pointwise-multiplicative model and, fi-nally, a multinomial multiple regression model by Partial Least Squares Regression (PLSR).
2 Compositionality of meaning in DSMs
Previous work in the field has produced a small number of operations to represent the composi-tion of vectorial representacomposi-tions of word meaning. In particular, given two independent vectors v1 and v2, the semantically compositional result v3 is modelled by:
• vector addition, the compositional meaning ofv3 consists of the sum of the independent vectors for the constituent words:
v1i +v2i =v3i
• pointwise-multiplication (Mitchell and La-pata 2008), each corresponding pair of com-ponents ofv1andv2are multiplied to obtain the corresponding component ofv3:
v1i ×v2i =v3i
• tensor product,v1⊗v2 =v3, wherev3is a matrix whoseij-th entry is equal tov1iv2j (cf. Widdows 2008, who also proposes the related method ofconvolution product, both imported from the field of quantum mechan-ics)
In the DSM literature, the additive model has be-come ade factostandard approach to approximate the composed meaning of a group of words (or a document) as thesumof their vectors (which re-sults in the centroid of the starting vectors). This has been successfully applied to document-based applications such as the computation of document similarity in information retrieval.
Mitchell & Lapata (2008) indicate that the var-ious variations of the pointwise-multiplication model perform better than simple additive mod-els in term similarity tasks (variations included combination with simple addition and adding weights to individual vector components). Wid-dows (2008) Obtain results indicating that both the tensor productand theconvolution product per-form better than the simple additive model.
For the sake of simplifying the implementa-tion of evaluaimplementa-tion methods, in this paper we will compare the first two approaches, vector addition and vector pointwise-multiplication, with regres-sion modelling by partial least squares.
3 Partial least squares regression of compositionality
We assume that the composition of meaning in DSMs is a function mapping two or more inde-pendent vectors in a multidimensional space to a
newly composed vector the same space and, fur-ther, we assume that semantic composition is de-pendent on the syntactic structure being instanti-ated in natural language.1
Assuming that each dimension in the starting vectorsv1andv2is a candidate predictor, and that each dimension in the composed vectorv3is a de-pendent variable, vector-based semantic composi-tionality can be formulated as a problem of multi-variate multiple regression. This is, in principle, a tractable problem that can be solved by stan-dard machine learning techniques such as multi-layer perceptrons or support vector machines.
However, given that sequences of words tend to be of very low frequency (and thus difficult to rep-resent in a DSM), suitable data sets will inevitably suffer the curse of dimensionality: we will often have many more variables (dimensions) than ob-servations.
Partial Least Squares Regression (PLSR) is a multivariate regression technique that has been de-signed specifically to tackle such situations with high dimensionality and limited data. PLSR is widely used in in unrelated fields such as spec-troscopy, medical chemistry, brain-imaging and marketing (Mevik & Wehrens, 2007).
4 Materials and tools
We use a general-purpose vector space extracted from the British National Corpus. We used the Infomapsoftware to collect co-occurrence statis-tics for lemmas within a rectangular 5L–5R win-dow. The corpus was pre-processed to represent frequent Adjective-Noun lemma pairs as a sin-gle token (e.g. while in the original corpus the A-N phrase nice house consists in two separate lemmas (nice and house), in the processed cor-pus it appears as a single entrynice_house). The corpus was also processed by stop-word removal. We extracted a list of A-N candidate pairs with simple regex-based queries targeting adjacent se-quences composed of [Det/Art–A–N] (e.g.that lit-tle house). We filtered the candidate list by fre-quency (> 400) obtaining 1,380 different A-N pairs.
The vector space was built with the 40,000 most frequent tokens in the corpus (a cut-off point that included all the extracted A-N pairs). The origi-nal dimensions were the 3,000 most frequent
tent words in the BNC. The vector space was reduced to the first 500 “latent” dimensions by SVD as implemented by the Infomap software. Thus, the resulting space consists in a matrix with
40,000×500dimensions.
We then extracted the vector representation for each A-N candidate as well as for each indepen-dent constituent, e.g. vectors fornice_house(v3), as well as fornice(v1) andhouse(v2) were saved. The resulting vector subspace was imported into the R statistical computing environment for the subsequent model building and evaluation. In particular, we produced our regression analysis with theplspackage (Mevik & Wehrens, 2007), which implements PLSR and a number of very useful functions for cross-validation, prediction, error analysis, etc.
By simply combining the vector representations of the independent Adjectives and Nouns in our data-set (v1 and v2) we built an additive predic-tion model (v1 +v2) and a simplified pointwise multiplicative prediction model (v1×v2) for each candidate pair.
We also fitted a PLSR model using v1 andv2 as predictors and the corresponding observed pair v3 as dependent variable. The data were divided into a training set (1,000 A-N pairs) and a testing set (the remaining 380 A-N pairs). The model’s parameters were estimated by performing 10-fold cross-validation during the training phase.
In what follows we briefly evaluate the three re-sulting models of compositionality.
5 Evaluation
In order to evaluate the three models of composi-tionality that were built, we devised two different procedures based on the Euclidean measure of ge-ometric distance.
The first method draws a direct comparison of the different predicted vectors for each candidate A-N pair by computing the Euclidean distance be-tween the observed vector and the modelled pre-dictions. We also inspect a general distance matrix for the whole compositionality subspace, i.e. all the observed vectors and all the predicted vectors. We extract the 10 nearest neighbours for the 380 Adjective-Noun pairs in the test set and look for the intended predicted vectors in each case. The idea here is that the best models should produce predictions that are as close as possible to the orig-inally observed A-N vector.
Our second evaluation method uses the 10 near-est neighbours of each of the observed A-N pairs in the test set as gold-standard (excluding any modelled predictions), and compares them with the 10 nearest neighbours of each of the corre-sponding predictions as generated by the models. The aim is to assess if the predictions made by each model share any top-10 neighbours with their corresponding gold-standard. We award 1 point for every shared neighbour.
5.1 The distance of predictions
We calculated the Euclidean distance between each observed A-N pair and the corresponding prediction made by each model. On general in-spection, it is clear that the approximation of A-N compositional vectors made by PLSR is consid-erably closer than those produced by the additive and multiplicative models, cf. Table 1.
[image:3.595.309.523.672.714.2]Min. 1st Q. Median Mean 3rd Q. Max. ADD 0.877 1.402 1.483 1.485 1.570 1.814 MUL 0.973 0.998 1.002 1.002 1.005 1.019 PLSR 0.624 0.805 0.856 0.866 0.919 1.135 Table 1: Summary of distance values between the 380 observed A-N pairs and the predictions from each model (ADD=additive, MUL=multiplicative, PLSR=Partial Least Squares Regression).
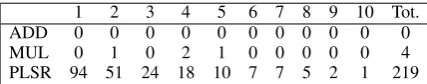
We also computed in detail which of the three pre-dicted composed vectors was closest to the corre-sponding observation. To this effect we extracted the 10 nearest neighbours for each A-N pair in the test set using the whole compositionality subspace (all the predicted and the original vectors). In 94 cases out of 380, the PLSR intended prediction was the nearest neighbour. Cumulatively, PLSR’s predictions were in the top-10 nearest neighbour list in 219 out of 380 cases (57.6%). The other models’ performance in this test was negligible, cf. Table 2. Overall, 223 items in the test set had at least one predicted vector in the top-10 list; of these, 219 (98%) were generated by PLSR and the remaining 4 (1%) by the multiplicative model.
1 2 3 4 5 6 7 8 9 10 Tot.
ADD 0 0 0 0 0 0 0 0 0 0 0
MUL 0 1 0 2 1 0 0 0 0 0 4
5.2 Comparing prediction neighbours to the gold standard
Since the main use of DSMs is to extract similar vectors from a multidimensional space (represent-ing related documents, distributional synonyms, etc.), we would like to test if the modelling of se-mantic compositionality is able to produce predic-tions that are as similar as possible to the originally observed data. A very desirable result would be if any predicted compositional A-N vector could be reliably used instead of the extracted bigram. This could only be achieved if a model’s predic-tions show a similar distributional behaviour with respect to the observed vector.
To test this idea using our data, we took the 10 nearest neighbours of each of the observed A-N pairs in the test set as gold standard. These gold neighbours were extracted from the obser-vation testing subspace, thus excluding any mod-elled predictions. This is a very restrictive set-ting: it means that the gold standard for each of the 380 test items is composed of the 10 nearest neighbours from the same 380 items (which may turn out to be not very close at all). We then ex-tracted the 10 nearest neighbours for each of the three modelled predictions, but this time the sub-space included all predictions, as well as all the original observations (380×4 = 1520items). Fi-nally, we tested if the predictions made by each model shared any top-10 neighbours with their corresponding gold-standard. We awarded 1 point for every shared neighbour.
The results obtained with these evaluation set-tings were very poor. Only the additive model scored points (48), although the performance was rather disappointing (maximum potential score for the test was 3,800 points). Both the pointwise mul-tiplicative model and the PLSR model failed to re-trieve any of the gold standard neighbours. This poor results can be attributed to the very restric-tive nature of our gold standard and, also, to the asymmetrical composition of the compared data (gold standard: 3,800 neighbours from a pool of just 380 different items; prediction space: 11,400 neighbours from a pool of 1,520 items).
However, given the that DSMs are known for their ability to extract similar items from the same space, we decided to relax our test settings by awarding points not only to shared neighbours, but also to the same model’s predic-tions of those neighbours. Thus, given a
tar-get neighbour such as good_deal, in our sec-ond setting we awarded points not only to the gold standard good_deal, but also to the pre-dictions good_deal_ADD, good_deal_MUL and good_deal_PLSR when evaluating each corre-sponding model. With these settings the compared spaces become less asymmetrical (gold standard: 7,600 neighbours from a pool of just 380 different items plus predictions; prediction space: 11,400 neighbours from a pool of 1,520 items). The ob-tained results show a great improvement (max. po-tential score 7,600 points):
Shared Neigh. Predicted Neigh. Total
ADD 48 577 625
MUL 0 37 37
PLSR 0 263 263
[image:4.595.306.538.513.566.2]Not shared: 6,675
Table 3: Shared neighbours with respect to the gold standard and shared predicted neighbours.
Once again, the additive model showed the best performance, followed by PLSR. The multiplica-tive model’s performance was negligible.
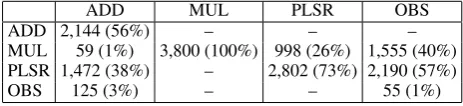
While carrying out these experiments, an unex-pected fact became evident. Each of the models in turn produces predictions that are relatively close to each other, regardless of the independent words that were used to calculate the compositional vec-tors. This has the consequence that the nearest neighbour lists for each model’s predictions are, by and large, populated by items generated in the same model, as shown in Table 4.
ADD MUL PLSR OBS
ADD 2,144 (56%) – – –
MUL 59 (1%) 3,800 (100%) 998 (26%) 1,555 (40%) PLSR 1,472 (38%) – 2,802 (73%) 2,190 (57%)
OBS 125 (3%) – – 55 (1%)
Table 4: Origins of neighbours in each models’ top-10 list of neighbours extracted from the full space composed of observations and predictions (380× 4 = 1,440 items) (ADD=additive, MUL=multiplicative, PLSR=Partial Least Squares Regression, OBS=observed vectors) .
Neighbours of predictions from the multiplicative model are all multiplicative. The additive model has the most varied set of neighbours, but the majority of them are additive-neighbours. PLSR shows a mixed behaviour. However, PLSR pro-duced neighbours that find their way into the neighbour sets of both the additive model and the observations.
ev-ery model is a simplified and specialised version of the original space, somewhat more orderly than the observed data, and may give different results depending on the task at stake. PLSR (and to a lesser extent also the multiplicative model) is par-ticularly efficient as generator of neighbours for real vectors, a characteristic that could be applied to guess distributional synonyms of unseen A-N pairs. On the other hand, the additive model (and to a lesser extent PLSR) is especially successful in attracting gold standard neighbours. Overall, even at this experimental stage, PLSR is clearly the model that produces the most consistent re-sults.
6 Concluding remarks
This paper proposed a novel method to model the compositionality of meaning in distributional models of semantics. The method, Partial Least Squares Regression, is well known in other data-intensive fields of research, but to our knowledge had never been put to work in computational dis-tributional semantics. Its main advantage is the fact that it is designed to approximate functions in problems of multivariate multiple regression where the number of observations is relatively small if compared to the number of variables (di-mensions).
We built a DSM targeting a type of semantic composition that has not been treated extensively in the literature before, adjacent A-N pairs.
The model built by PLSR performed better than both a simple additive model and a multiplicative model in the first proposed evaluation method.
Our second evaluation test (using comparison to a gold standard) gave mixed results: the best performance was obtained by the simple additive model, with PLSR coming in second place.
This is work in progress, but the results look very promising. Future developments will cer-tainly focus on the creation of better evaluation methods, as well as on extending the experi-ments to other techniques (e.g. convolution prod-uct as discussed by Widdows, 2008 and Gies-brecht, 2009). Another important issue that we still have not touched is the role played by lex-ical association (collocations) in the prediction models. We would like to make sure that we are not modelling the compositionality of non-compositional examples.
A last word on the view of semantic
composi-tionality suggested by our approach. Modelling compositionality as a machine learning task im-plies that a great number of different “types” of composition (functions combining vectors) may be learned from natural language samples. In prin-ciple, any semantic relation instantiated by any syntactic structure could be learned if sufficient data is provided. This approach must be con-fronted with other linguistic phenomena, also of greater complexity than just a set of bigrams. Fi-nally, we might wonder if there is an upper limit to the number of compositionality functions that we need to learn in natural language, or if there are types of functions that are more difficult, or even impossible, to learn.
Acknowledgements
Thanks are due to Marco Baroni, Stefan Evert, Roberto Zamparelli and the three anonymous re-viewers for their assistance and helpful comments.
References
Marco Baroni and Alessandro Lenci. 2009. One semantic memory, many semantic tasks. In Pro-ceedings GEMS 2009, 3–11. Athens: Associa-tion for ComputaAssocia-tional Linguistics.
Eugenie Giesbrecht. 2009. In Search of Seman-tic Compositionality in Vector Spaces. In Pro-ceedings of the 17th International Conference on Conceptual Structures, ICCS 2009, Moscow, Russia, pp. 173–184. Berlin: Springer.
Zellig Harris. 1970 [1954]. Distributional struc-ture. In Papers in structural and transforma-tional linguistics, 775–794. Dordrecht: Reidel. Bjørn-Helge Mevik and Ron Wehrens. 2007. The
pls package: principal component and partial least squares regression in R.Journal of Statis-tical Software, 18(2): 1–24.
Jeff Mitchell and Mirella Lapata. 2008. Vector-based Models of Semantic Composition. In Proceedings of ACL-08: HLT, 236–244. Columbus, OH.
Dominic Widdows. 2008. Semantic Vector Prod-ucts: Some Initial Investigations. Second AAAI Symposium on Quantum Interaction, Oxford, 26th–28th March 2008. URL:http://www. puttypeg.com/papers/