Identifying Sources of Inter-Annotator Variation:
Evaluating Two Models of Argument Analysis
Barbara White
The University of Western Ontario
London, ON, Canada N6A 3K7
[email protected]
Abstract
This paper reports on a pilot study where two Models of argument were applied to the Dis-cussion sections of a corpus of biomedical re-search articles. The goal was to identify sources of systematic inter-annotator variation as diagnostics for improving the Models. In addition to showing a need to revise both Models, the results identified problems result-ing from limitations in annotator expertise. In future work two types of annotators are re-quired: those with biomedical domain exper-tise and those with an understanding of rhe-torical structure.
1
Introduction
Given the vast and growing body of biomedical research literature being published there is a need to develop automated text mining tools that will assist in filtering out the information most useful to researchers. Previous studies applying Argu-mentative Zoning (AZ) (Teufel et al. 1999) and Zone Analysis (ZA) (Mizuta et al. 2005) have shown that an analysis of the argumentative structure of a text can be of use in Information Extraction (IE). As an alternative approach, it was believed that Toulmin’s work on informal logic and argument structure (1958/2003) could reflect the rhetorical strategies used by the au-thors of biomedical research articles.
In order to compare and evaluate these ap-proaches two Models of argument were applied to the same set of biomedical research articles. Inter-annotator agreement/disagreement between and within Models was examined. Given that human-annotated data are ultimately to be used for machine learning purposes, there is growing recognition of the need to analyze coder dis-agreements in order to differentiate between sys-tematic variation and noise (e.g. Reidsma and Carletta 2008). The goal of this study was to
identify systematic disagreements as diagnostics for improving the Models of argument.
2
Annotation Project
The two Models of rhetoric (argument) in Tables 1 and 2 were applied to a corpus of 12 articles downloaded at random from the BMC-series (BioMed Central) of journals. The corpus cov-ered nine different domains, with a total of 400 sentences; the three annotators worked inde-pendently. Although the entire articles were read by the annotators, only the sentences in the Dis-cussion section were argumentatively catego-rized. The annotators were the study coordinator (B, a PhD student in Computational Linguistics and current author) and two fourth year under-graduate students from the Bachelor of Medical Sciences program at The University of Western Ontario (J and K).
Coders annotated one article at a time, apply-ing each of the two Models; no sentence was al-lowed to be left unannotated. In cases where an annotator was conflicted between categories guidelines for ‘trumping’ were provided with the Models. (For details on the Models, trumping systems, instructions to annotators, corpus data and a sample annotated article please see www.csd.uwo.ca/~mercer/White_Thesis09.pdf.) The first model (Model 1) of argumentation to be applied stems from work in AZ and ZA and was adapted by White. It focuses on the content of a text, essentially differentiating ‘new’ from ‘old’ information, and results from analysis (Ta-ble 1). The second model is based on the con-cepts and language of Toulmin (1958/2003). Jen-icek applied Toulmin to create a guide for writ-ing medical research articles (2006) and Graves (personal communications 2008, 2009) further adapted these ideas to work with our corpus (Model 2). Its main focus is to identify ‘Claims’ being made by the authors, but it also differenti-ates between internal and external evidence, as
well as categories of explanation and implication (Table 2).
Category Specifications
CONTEXT (1) Background, accepted facts, previous work, motivation
METHOD (2) Methods, tools, processes, experimental design CURRENT
RESULTS (3)
Findings of current experiment RESULTS
COMPARED (4)
Current results support or contradict previous work
ANALYSIS (5)
Possible interpretations or implications of current or previous results, significance or limitations of their study
Table 1: Model 1 categories (White 2009)
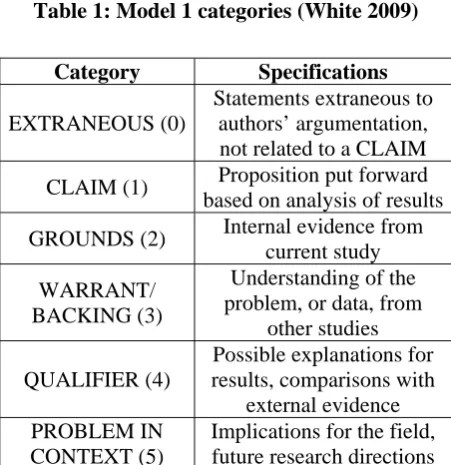
Category Specifications
EXTRANEOUS (0)
Statements extraneous to authors’ argumentation, not related to a CLAIM
CLAIM (1) Proposition put forward based on analysis of results
GROUNDS (2) Internal evidence from current study
WARRANT/ BACKING (3)
Understanding of the problem, or data, from
other studies
QUALIFIER (4)
Possible explanations for results, comparisons with
external evidence PROBLEM IN
CONTEXT (5)
[image:2.595.314.516.145.245.2]Implications for the field, future research directions
Table 2: Model 2 categories (Toulmin 1958, Jenicek 2006, Graves 2009)
2.1 Results
Data were compiled on individual annotator’s argument category choices for each of the 400 sentences, for each Model of rhetoric. This al-lowed comparisons to be made between the two Models, within Model by category, and between annotators. Although the coders had different backgrounds, they were treated as equals i.e. there was no ‘expert’ who served as a bench-mark. There were three possible types of inter-annotator agreement: we all agreed on a choice of category, we all differed, or two annotators agreed and the third disagreed. This latter group of two-way agreement (also implying two-way
variation) was broken down into its three possi-bilities: J and K agreed, and differed from B (JK~B), J and B agreed, and differed from K (JB~K), or B and K agreed, and differed from J (BK~J) (Table 3).
Model 1 Model 2
All agree 242 60.50% 157 39.25% All disagree 15 3.75% 33 8.25%
JK~B 32 8.00% 71 17.75% JB~K 42 10.50% 68 17.00% BK~J 69 17.25% 71 17.75%
[image:2.595.67.293.284.517.2]Total 400 100% 400 100%
Table 3 Number of sentences in agreement groups
The overall (three-way) inter-annotator agree-ment was higher for Model 1 at 60.5%, with Model 2 at 39.25%. All annotators were less fa-miliar with Model 2 than Model 1, and the for-mer had one more category, thus there was more opportunity to disagree. Although there is no guarantee that three-way agreement implies we were all ‘right’, it does suggest a shared under-standing of what the Model categories describe. On the other hand, there were instances of sen-tences under both Models where three different categories had been chosen but they could all seem to legitimately apply. In addition, in sen-tences which are argumentatively and/or gram-matically complex, where one is forced to choose only one categorization, it is often difficult to decide which is the most appropriate.
Given the difference in academic background of the annotators, one hypothesis had been that J and K would be more likely to agree with each other and differ from B, the coder who was not knowledgeable in the biomedical sciences. As can be seen in Table 3, however, this did not turn out to be the case.
3 Sources of Inter-Annotator Variation
3.1 Model 1
Category Tokens Percent
CONTEXT (1) 337 28.0% METHOD (2) 128 10.7%
CURRENT
RESULTS (3) 189 15.8% RESULTS
COMPARED (4) 114 9.5%
ANALYSIS (5) 432 36.0%
[image:3.595.84.274.93.237.2]Total 1200 100%
Table 4 Overall distribution by category – Model 1
The CONTEXT category was developed in order to filter out background (‘old’) material. Al-though this seemed straightforward, the results showed that CONTEXT was the largest source of inter-annotator variation under Model 1: of the 158 sentences that had some degree of inter-annotator variation, almost two-thirds (100) in-volved some variation between CONTEXT and another category. The primary reason for this was that frequently sentences in our corpus that included category (1) material also included ma-terial suited to other categories (typically ANALYSIS or RESULTS COMPARED) i.e. they were complex sentences. There was also inter-annotator disagreement between CUR-RENT RESULTS (3) and RESULTS COM-PARED (4); this was to be expected given the potential overlap of content when discussing the authors’ current study, especially in complex sentences.
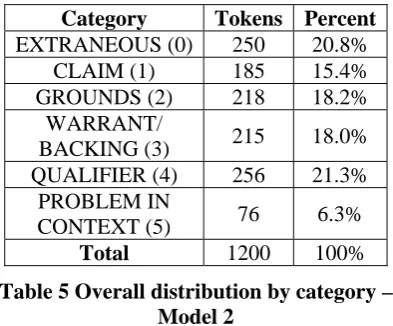
3.2 Model 2
Category Tokens Percent
EXTRANEOUS (0) 250 20.8% CLAIM (1) 185 15.4% GROUNDS (2) 218 18.2%
WARRANT/
BACKING (3) 215 18.0%
QUALIFIER (4) 256 21.3% PROBLEM IN
CONTEXT (5) 76 6.3%
Total 1200 100%
Table 5 Overall distribution by category – Model 2
The EXTRANEOUS category had been devel-oped for sentences of a ‘background’ nature, which did not fit into the Toulmin argument
structure i.e. they did not seem to relate directly to any CLAIM. Of the 243 sentences with some degree of inter-annotator variation under Model 2, 101 involved the EXTRANEOUS category. This variation a) showed that there were prob-lems in understanding argument structure, and b) reflected the differences in annotator preferences (Table 7).
Model 2 is crucially a CLAIMS-based sys-tem, so variation between CLAIMS and other categories is particularly significant, especially since it is assumed that this might be the cate-gory of greatest interest to biomedical research-ers. There were 52 sentences which involved some variation between CLAIM (1) and QUALIFIER (4), a fact which revealed a need to make clearer distinctions between these two categories. Many sentences in our corpus seemed to meet the specifications for both categories at the same time i.e. they were both an explanation and a conclusion. There were 46 sentences in-volving some disagreement between (4) and WARRANT/BACKING (3). The source of this variation seemed to be the difficulty deciding whether the ‘compare and contrast with external evidence’ aspect of (4) or the straightforward ‘external evidence’ of (3) was more appropriate for certain, especially complex, sentences.
3.3 Annotators
Under Model 1 the three annotator columns show a relatively similar distribution (Table 6). The exception is that J was less inclined to select the CONTEXT category, and more inclined to select RESULTS COMPARED, than either B or K.
Category B J K Total
CONTEXT (1) 121 92 124 337 METHOD (2) 39 43 46 128
CURRENT
RESULTS (3) 59 67 63 189 RESULTS
COMPARED (4) 36 57 21 114 ANALYSIS (5) 145 141 146 432
[image:3.595.82.279.539.702.2]Total 400 400 400 1200
Table 6 Category distribution by annotator – Model 1
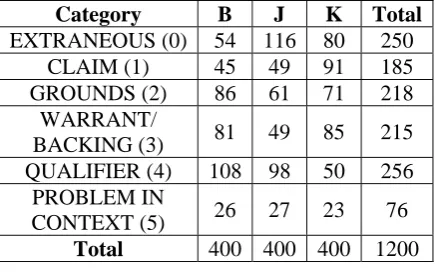
[image:3.595.311.521.549.684.2](0) would be involved in considerable inter-annotator disagreement. The other notable skew-ing occurred in categories (1) and (4) where B and J shared similar numbers as opposed to K: K had 91 sentences as CLAIM, almost twice as many as B or J, and only 50 sentences as QUALIFIER, roughly half as many as B or J.
Category B J K Total
EXTRANEOUS (0) 54 116 80 250 CLAIM (1) 45 49 91 185 GROUNDS (2) 86 61 71 218
WARRANT/
BACKING (3) 81 49 85 215 QUALIFIER (4) 108 98 50 256
PROBLEM IN
CONTEXT (5) 26 27 23 76
[image:4.595.72.290.172.309.2]Total 400 400 400 1200
Table 7 Category distribution by annotator – Model 2
In addition to the systematic annotator prefer-ences discussed above there were instances of ‘errors’, choices which appear to be violations of category specifications. These may be the result of haste or inattention, insufficient training or a lack of understanding of the article’s content or the Models.
3.4 Corpus Data
It was assumed that longer sentences would be more likely to be complex and thus more likely to involve inter-annotator variation. The results showed that the articles with the smallest (19) and largest (31) average number of words per sentence did exhibit this pattern: the former ranked highly in three-way annotator agreement (first under Model 1 and second under Model 2) and the latter second lowest under both Models. However, between these extremes there was no clear relationship between sentence length and overall coder agreement under either Model. The most striking finding was the wide range of three-way coder agreement among the twelve articles in the corpus: from 36% to 81% under Model 1 and 8% to 69% under Model 2. The av-erages in Table 3 mask this source of inter-annotator variation.
4 Conclusion
The problem of choosing a single argument cate-gory for a complex sentence was at the core of much of the inter-annotator variation found un-der both Models. The issue of sentences which
are rhetorically but not grammatically complex e.g. those with a single tensed verb that seemed to qualify as both a CLAIM and a QUALIFIER under Model 2 should be dealt with where possi-ble by revising the category specifications. How-ever sentences that are grammatically complex should be divided into clauses (one for each tensed verb) as a pre-annotating process. Al-though this creates more units and thus more op-portunities for coders to disagree, it is believed that reducing uncertainty by allowing a different argument category for each clause would be worth the trade-off.
References
Milos Jenicek. 2006. How to read, understand, and write ‘Discussion’ sections in medical articles: An exercise in critical thinking. Med Sci Monitor, 12(6): SR28-SR36.
Yoko Mizuta, Anna Korhonen, Tony Mullen and Nigel Collier. 2005. Zone Analysis in Biology Ar-ticles as a Basis for Information Extraction. Inter-national Journal of Medical Informatics, 75(6): 468-487.
Dennis Reidsma and Jean Carletta. 2008. Reliability Measurement without Limits. Computational Lin-guistics, 34(3): 319-326.
Simone Teufel, Jean Carletta and Mark Moens. 1999. An annotation scheme for discourse-level argumen-tation in research articles. Proceedings of the Eighth Meeting of the European Chapter of the As-sociation for Computational Linguistics: 110-117.
Stephen E. Toulmin. 1958/2003. The Uses of Argu-ment. Cambridge University Press, Cambridge, U.K.
Barbara White. 2009. Annotating a Corpus of Bio-medical Research Texts: Two Models of Rhetorical Analysis. PhD thesis, The University of Western Ontario, Canada.