Building a Semantic Transparency Dataset of Chinese Nominal
Compounds: A Practice of Crowdsourcing Methodology
Shichang Wang, Chu-Ren Huang, Yao Yao, Angel Chan Department of Chinese and Bilingual Studies
The Hong Kong Polytechnic University Hung Hom, Kowloon, Hong Kong [email protected]
{churen.huang, y.yao, angel.ws.chan}@polyu.edu.hk
Abstract
This paper describes the work which aimed to create a semantic transparency dataset of Chi-nese nominal compounds (SemTransCNC 1.0) by crowdsourcing methodology. We firstly se-lected about 1,200 Chinese nominal compounds from a lexicon of modern Chinese and the Sinica Corpus. Then through a series of crowdsourcing experiments conducted on the Crowdflower platform, we successfully collected both overall semantic transparency and constituent semantic transparency data for each of them. According to our evaluation, the data quality is good. This work filled a gap in Chinese language resources and also practiced and explored the crowdsourc-ing methodology for lcrowdsourc-inguistic experiment and language resource construction.
1 Introduction
The meaning of “马虎” (mǎhu, horse-tiger, ‘careless’) has nearly nothing to do with neither “马” (mǎ, ‘horse’) nor “虎” (hǔ, ‘tiger’). However the meaning of “道路” (dàolù, road-way, ‘road’) is basically equal to “道” (dào, ‘road’) or “路” (lù, ‘way’). And there are intermediate cases too, for instance, “江 湖” (jiānghú, river-lake, ‘all corners of the country’), its meaning is not equal to “江” (jiāng, ‘river’) plus “湖” (hú, ‘lake’), but clear relatedness between them can be observed. This phenomenon is called semantic transparency of compounds. We distinguish between overall semantic transparency (OST) and constituent semantic transparency (CST). The semantic transparency of a compound, i.e., the overall se-mantic transparency, is the extent to which the compound retains its literal meaning in its actual meaning. The semantic transparency of a constituent of a compound, i.e., the constituent semantic transparency, is the extent to which the constituent retains its meaning in the actual meaning of the compound. Semantic similarity between the literal meaning and the actual meaning of a compound can be used to estimate the overall semantic transparency of a compound, for the more the literal meaning is retained in the actual meaning, the more similar they are. The same technique can be used to estimate constituent semantic transparency. Semantic transparency can be quantified; if we assign 0 to “fully opaque” and assign 1 to “fully transparent”, then semantic transparency can be quantified as a closed interval[0,1].
The quantitative analysis of semantic transparency must be supported by semantic transparency datasets. In previous semantic transparency related studies on Chinese compounds, some researchers created some datasets to support their own studies. But this kind of datasets are usually relatively small and restrictive, so cannot be used widely, for example, (徐彩华and李镗, 2001; Myers et al., 2004;干 红梅, 2008; Mok, 2009), etc. Some datasets, although large enough and can be used in other studies, are not publicly accessible, for example, (王春茂and彭聃龄, 1999;高兵and高峰强, 2005), etc. A large and publicly accessible semantic transparency dataset of Chinese compounds is still a gap in Chinese language resources.
Crowdsourcing, as an emerging method of data collection and resource construction (Snow et al., 2008; Callison-Burch and Dredze, 2010; Munro et al., 2010; Schnoebelen and Kuperman, 2010; Gurevych and Zesch, 2013; Wang et al., 2013) and an emerging method of behavioral experiment (Paolacci et al., 2010;
This work is licenced under a Creative Commons Attribution 4.0 International License. Page numbers and proceedings footer are added by the organizers. License details:http://creativecommons.org/licenses/by/4.0/
Berinsky et al., 2011; Mason and Suri, 2012; Rand, 2012; Crump et al., 2013), is attracting more and more attention from the field of language study and language computing. As a method of data collection and resource construction, it has the advantages of high speed and low cost, etc. It can use redundancy to filter out noise in order to improve data quality; if used properly, it can produce expert-level data. As a method of experiment, besides the above advantages, it also has the following ones, (1) it is easier to obtain large samples, because the amount of potential participants is huge; (2) the diversity of participants is good, because the participants are from different places and have different backgrounds; (3) crowdsourcing environments are usually anonymous, so it is easier to collect certain sensitive data.
2 Method
2.1 Compound Selection
We use the following criteria to select compounds, (1) they are disyllabic nominal compounds; (2) each of them has the structure NN, AN, or VN; (3) they are composed of free morphemes; (4) they have mid-range word frequencies; and (5) they are used in both Mainland China and Taiwan. And we select compounds according to the following procedure:
(1) Extract monosyllabic nouns, adjectives and verbs mainly according to “The Dictionary of Con-temporary Chinese (the 6th edition)” (现代汉语词典,第6版), and thus we get three sets, a) the set of monosyllabic nouns, N; b) the set of monosyllabic adjectives, A; and c) the set of monosyllabic verbs, V. (2) Extract the words of the structure NN, AN, or VN 1 from the “Lexicon of Common Words in Contemporary Chinese” (现代汉语常用词表). In this step, NN means both morphemes of the word appear in the set N; AN means the first morpheme appears in the set A and the second appears in the set N; VN means the first morpheme appears in the set V and the second appears in the set N. After this step, we get “word list 1”.
(3) Extract the words which have mid-range frequencies 2 from the Sinica Corpus 4.0 (Chen et al., 1996). These words are represented in traditional Chinese characters. We convert them into simplified Chinese characters and only reserve the words which also appear in “word list 1”. After this step, we get “word list 2”.
(4) Manually verify “word list 2” to generate the final list. Things need to be verified include the following aspects. (a) Because in “word list 2” word structures are judged automatically, there are many errors, so we have to verify the correctness of the word structure judgments. (b) We have to make sure that the morphemes of each word are free morphemes. (c) We also need to delete some proper nouns.
The words we selected appear in both Sinica Corpus 4.0 and “Lexicon of Common Words in Contem-porary Chinese”. Since there is no completely reliable criterion to identify Chinese word, appearing in two lexicons ensures their word identity. This also ensures that they are used in both Mainland China and Taiwan, and further means they are quite possible to be shared in other Chinese language communities, for example Hong Kong, Macau, and Singapore, etc.
According to above criteria and procedure, we selected a total of 1,176 words. 664 (56.46%) of them have the structure NN; 322 (27.38%) have the structure AN; and 190 (16.16%) have the structure VN.
2.2 Experimental Design
Normally, a crowdsourcing experiment should be reasonably small in size. We randomly divide these 1,176 words into 21 groups,Gi(i= 1,2,3, ...,21); each group has 56 words.
1See苑春法and黄昌宁(1998), and Huang (1998) for relevant statistics. 2
Questionnaires
We collect overall semantic transparency (OST) and constituent semantic transparency (CST) data of these words. In order to avoid interaction, we designed two kinds of questionnaires to collect OST data and CST data respectively. SoGi(i= 1,2,3, ...,21)has two questionnaires, one OST questionnaire for OST data collection and one CST questionnaire for CST data collection. Besides titles and instructions, each questionnaire has 3 sections. Section 1 is used to collect identity information includes gender, age, education and location. Section 2 contains four very simple questions about the Chinese language; the first two questions are open-ended Chinese character identification questions, the third question is a close-ended homophonic character identification question, and the fourth one is a close-close-ended antonymous character identification question; different questionnaires use different questions. Section 3 contains the questions for semantic transparency data collection. SupposeABis a disyllabic nominal compound, we use the following question to collect its OST rating scores: “How is the sum of the meanings ofAand
Bsimilar to the meaning ofAB?” And use the following two questions to collect its CST rating scores of its two constituents: “How is the meaning ofAwhen it is used alone similar to its meaning inAB?” and “How is the meaning ofBwhen it is used alone similar to its meaning inAB?”. 7-point scales are used in section 3; 1 means “not similar at all” and 7 means “almost the same”.
In order to evaluate the data received in the experiments, we embedded some evaluation devices in the questionnaires. We mainly evaluated intra-group and inter-group consistency; and if the data have good intra-group and inter-group consistency, we can believe that the data quality is good. In each group we choose two words and make them appear twice, we call them intra-group repeated words and we can use them to evaluate the intra-group consistency. We insert into each group two same extra words,w1“地 步”,w2“高山”, to evaluate the inter-group consistency.
Quality Control Measures
On a crowdsourcing platform like Crowdflower, the participants are anonymous, they may try to cheat and submit invalid data, and they may come from different countries and speak different languages rather than the required one. There may be spammers who continuously submit invalid data at very high speed and they may even bypass the quality control measures to cheat for money. In order to ensure that the participants are native Chinese speakers and to improve data quality, we use the following measures, (1) a participant must correctly answer the first two Chinese character identification questions in the section 2s of the questionnaires, and he/she must correctly answer at least one of the last two questions in these section 2s; (2) If a participant do not satisfy the above conditions, he/she will not see Section 3s; (3) each word stimulus in section 3s has an option which allows the participants to skip it in case he/she does not recognize that word; (4) all the questions in the questionnaires must be answered except the ones which allow to be skipped and are explicitly claimed to be skipped; (5) we wrote a monitor program to detect and resist spammers automatically; (6) after the experiment is finished, we will analyze the data and filter out invalid data, and we will discuss this in detail in section 3.
2.3 Experimental Platform and Procedure
3 Data Refinement and Result Calculation
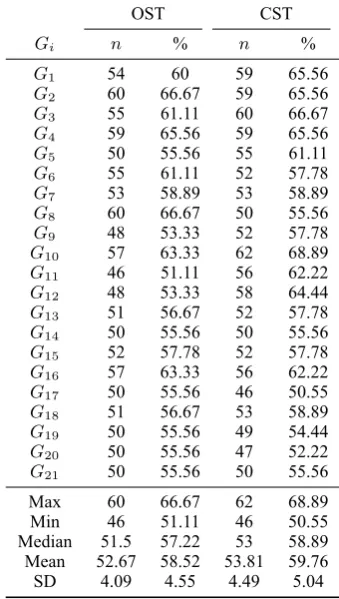
The OST dataset produced by the OST taskTiost(i= 1,2,3, ...,21)isDiost. The CST dataset produced by the CST taskTicstisDcsti . Each dataset contains 90 responses. Because of the nature of crowdsourcing environment, there are many invalid responses in each dataset; so firstly we need to filter them out in order to refine the data. A response is invalid if (1) its completion time is less than 135 seconds (for OST responses); its completion time is less than 250 seconds (for CST responses)3; or (2) it failed to correctly answer the first two questions of section 2s of the questionnaires; or (3) it wrongly answered the last two questions of section 2s of the questionnaires; or (4) it skipped one or more words in section 3s of the questionnaires; or (5) it used less than two numbers on the 7-point scales in section 3s of the questionnaires. The statistics of valid response are shown in Table 1.
The OST dataset Diost(i = 1,2,3, ...,21)containsni valid responses; it means wordwin the OST dataset of theith group hasni OST rating scores; the arithmetic mean of theseniOST rating scores is the OST result of wordw. The CST results of the two constituents of wordware calculated using the same algorithm.
OST CST
Gi n % n %
[image:4.595.212.382.274.574.2]G1 54 60 59 65.56 G2 60 66.67 59 65.56 G3 55 61.11 60 66.67 G4 59 65.56 59 65.56 G5 50 55.56 55 61.11 G6 55 61.11 52 57.78 G7 53 58.89 53 58.89 G8 60 66.67 50 55.56 G9 48 53.33 52 57.78 G10 57 63.33 62 68.89 G11 46 51.11 56 62.22 G12 48 53.33 58 64.44 G13 51 56.67 52 57.78 G14 50 55.56 50 55.56 G15 52 57.78 52 57.78 G16 57 63.33 56 62.22 G17 50 55.56 46 50.55 G18 51 56.67 53 58.89 G19 50 55.56 49 54.44 G20 50 55.56 47 52.22 G21 50 55.56 50 55.56 Max 60 66.67 62 68.89 Min 46 51.11 46 50.55 Median 51.5 57.22 53 58.89 Mean 52.67 58.52 53.81 59.76 SD 4.09 4.55 4.49 5.04
Table 1: The Amount of Valid Response in the OST and CST Datasets of Each Group
4 Evaluation
Three kinds of evaluation measures are used, (1) the intra-group consistency of the OST and CST results, (2) the inter-group consistency of the OST and CST results, and (3) the correlation between the OST and CST results.
3Each OST questionnaire has about 70 questions, and each CST questionnaire has about 130; in an OST or CST
4.1 Intra-group Consistency
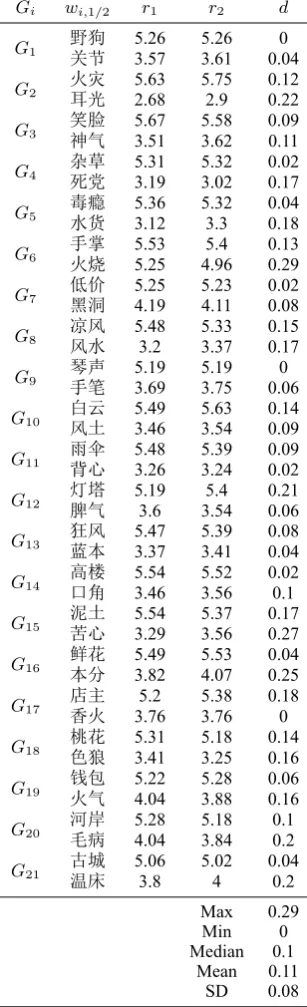
In each groupGi(i= 1,2,3, ...,21), we selected two wordswi,1, wi,2(intra-group repeated words) and made them appear twice between which there is enough distance; we can calculate the difference values between the results of the two appearances of these words.
Intra-group Consistency of OST Results
There are 21 groups and in each group there are two intra-group repeated words, so there are a total of 42 such words. Each intra-group repeated word appears twice, so we can obtain two OST resultsr1, r2. The difference value between the two results,d=|r1−r2|, of each intra-group repeated word is calculated, so there are 42 difference values. Among them, the maximum value is0.29; the minimum value is 0; the median is0.1; their mean is0.11; and their standard deviation is0.08; all of these values are low and indicate that these OST datasets have good intra-group consistency (see Table 2).
Intra-group Consistency of CST Results
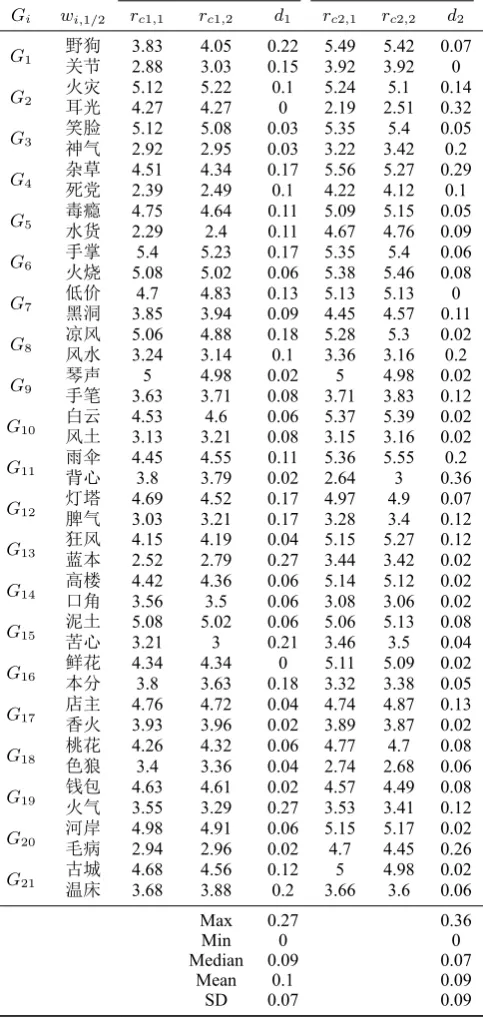
Each intra-group repeated word has two constituents,c1, c2, so each constituent gets two CST results, i.e.,
rc1,1, rc1,2andrc2,1, rc2,2. We calculate the difference values for the two constituents,d1 =|rc1,1−rc1,2| andd2 = |rc2,1−rc2,2|, and get 42 difference values of the first constituents and 42 difference values of the second constituents. Among the difference values of the first constituents, the maximum value is0.27; the minimum value is0; the median is0.09; their mean is0.1, and their standard deviation is
0.07; all of these values are low, this indicates that the CST results of the first constituents in the CST datasets of the 21 groups have good intra-group consistency. Among the difference values of the second constituents, the maximum value is0.36; the minimum value is0; the median is0.07; their mean is0.09, and their standard deviation is0.09; all of these values are low; this indicates that the CST results of the second constituents in the CST datasets of the 21 groups have good intra-group consistency (see Table 3). So these 21 CST datasets have good intra-group consistency.
4.2 Inter-group Consistency
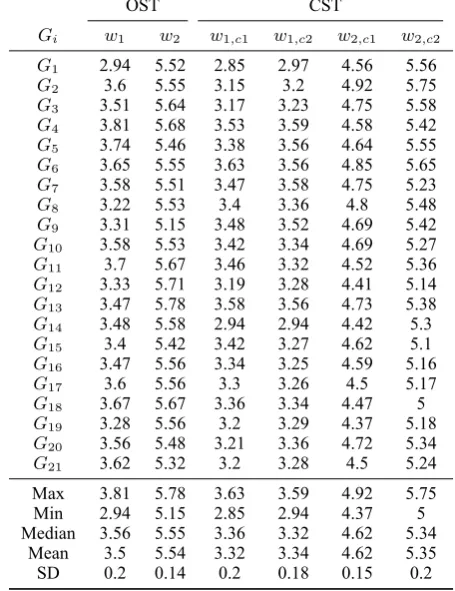
We inserted two inter-group repeated words,w1“地步”,w2“高山”, into all of these 21 groupsGi (i =
1,2,3, ...,21); we can evaluate the inter-group consistency by comparing their semantic transparency rating results in different groups. Sincew1, w2appear in all OST and CST questionnaires of 21 groups, we can obtain (1) 21 OST results ofw1, (2) 21 OST results ofw2, (3) 21 CST results of each of the two constituentsw1,c1,w1,c2ofw1, and (4) 21 CST results of each of the two constituentsw2,c1,w2,c2ofw2. Standard deviation can be used to measure difference, for example, the standard deviation of the 21 OST results ofw1 is0.2; this value is small and indicates high consistency; because these 21 results are from the OST datasets of 21 groups respectively, so we can say that these 21 OST datasets have good inter-group consistency. The standard deviation of the 21 OST results ofw2is0.14; the standard deviation of 21 CST results of the first constituent ofw1 is0.2, and that of the second is0.18; the standard deviation of 21 CST results of the first constituent ofw2is0.15, and that of the second is0.2; all of these values are small and all of them indicate good inter-group consistency (see Table 4).
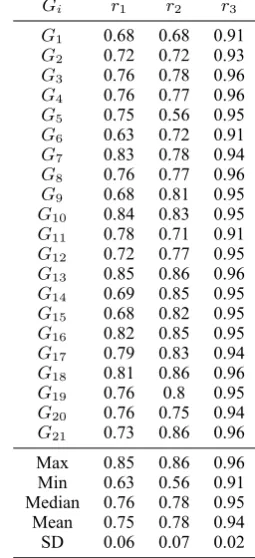
4.3 Correlation between OST and CST Results
Each compound in the datasets has two constituents; both constituents affect the OST of the compound, but neither of them can solely determine the OST of the compound. So the mean of the two CST values of a compound is a fairly good estimation of its OST value. Therefore, if the datasets are reliable, in each group, we should observe strong correlation between the OST results and their corresponding means of the CST results. For each group, we calculate three Pearson product-moment correlation coefficients (r);
Gi wi,1/2 r1 r2 d
G1 野狗关节 5.26 5.26 0
3.57 3.61 0.04 G2 火灾耳光 5.632.68 5.752.9 0.120.22 G3 笑脸神气 5.673.51 5.583.62 0.090.11 G4 杂草死党 5.313.19 5.323.02 0.020.17 G5 毒瘾水货 5.363.12 5.323.3 0.040.18 G6 手掌火烧 5.535.25 4.965.4 0.130.29 G7 低价黑洞 5.254.19 5.234.11 0.020.08 G8 凉风风水 5.483.2 5.333.37 0.150.17 G9 琴声手笔 5.193.69 5.193.75 0.060 G10 白云风土 5.493.46 5.633.54 0.140.09
G11 雨伞背心 5.48 5.39 0.09
3.26 3.24 0.02
G12 灯塔脾气 5.19 5.4 0.21
3.6 3.54 0.06 G13 狂风蓝本 5.473.37 5.393.41 0.080.04 G14 高楼口角 5.543.46 5.523.56 0.020.1 G15 泥土苦心 5.543.29 5.373.56 0.170.27 G16 鲜花本分 5.493.82 5.534.07 0.040.25 G17 店主香火 3.765.2 5.383.76 0.180 G18 桃花色狼 5.313.41 5.183.25 0.140.16 G19 钱包火气 5.224.04 5.283.88 0.060.16
G20 河岸毛病 5.28 5.18 0.1
4.04 3.84 0.2 G21 古城温床 5.063.8 5.024 0.040.2
Max 0.29 Min 0 Median 0.1
[image:6.595.221.375.67.572.2]Mean 0.11 SD 0.08
Table 2: The Intra-group Consistency of the OST Results of Each Group
reasonably high (see Table 5)4. The results support the reliability of these datasets.
5 Merging and Normalization
The evaluation results show that the collected data are generally reliable and have relatively high intra-group and inter-intra-group consistency which further indicate that these datasets share similar scale and are basically comparable, so we can merge the 21 OST datasets into one big OST datasetDostand merge the 21 CST datasets into one big CST datasetDcst. When we merge these datasets, we delete all the extra words which are used to evaluate the inter-group consistency; for the repeated words which are
4After merging and normalization (see Section 5), we calculated these three correlation coefficients betweenD
c1 c2 Gi wi,1/2 rc1,1 rc1,2 d1 rc2,1 rc2,2 d2
G1 野狗关节 3.832.88 4.053.03 0.220.15 5.493.92 5.423.92 0.070 G2 火灾耳光 5.124.27 5.224.27 0.10 5.242.19 2.515.1 0.140.32
G3 笑脸神气 5.12 5.08 0.03 5.35 5.4 0.05
2.92 2.95 0.03 3.22 3.42 0.2
G4 杂草死党 4.51 4.34 0.17 5.56 5.27 0.29
2.39 2.49 0.1 4.22 4.12 0.1
G5 毒瘾水货 4.75 4.64 0.11 5.09 5.15 0.05
2.29 2.4 0.11 4.67 4.76 0.09
G6 手掌火烧 5.4 5.23 0.17 5.35 5.4 0.06
5.08 5.02 0.06 5.38 5.46 0.08
G7 低价黑洞 4.7 4.83 0.13 5.13 5.13 0
3.85 3.94 0.09 4.45 4.57 0.11
G8 凉风风水 5.06 4.88 0.18 5.28 5.3 0.02
3.24 3.14 0.1 3.36 3.16 0.2
G9 琴声手笔 5 4.98 0.02 5 4.98 0.02
3.63 3.71 0.08 3.71 3.83 0.12 G10 白云风土 4.533.13 3.214.6 0.060.08 5.373.15 5.393.16 0.020.02 G11 雨伞背心 4.453.8 4.553.79 0.020.11 5.362.64 5.553 0.360.2 G12 灯塔脾气 4.693.03 4.523.21 0.170.17 4.973.28 4.93.4 0.070.12
G13 狂风蓝本 4.15 4.19 0.04 5.15 5.27 0.12
2.52 2.79 0.27 3.44 3.42 0.02
G14 高楼口角 4.42 4.36 0.06 5.14 5.12 0.02
3.56 3.5 0.06 3.08 3.06 0.02
G15 泥土苦心 5.08 5.02 0.06 5.06 5.13 0.08
3.21 3 0.21 3.46 3.5 0.04
G16 鲜花本分 4.34 4.34 0 5.11 5.09 0.02
3.8 3.63 0.18 3.32 3.38 0.05
G17 店主香火 4.76 4.72 0.04 4.74 4.87 0.13
3.93 3.96 0.02 3.89 3.87 0.02
G18 桃花色狼 4.26 4.32 0.06 4.77 4.7 0.08
3.4 3.36 0.04 2.74 2.68 0.06
G19 钱包火气 4.63 4.61 0.02 4.57 4.49 0.08
3.55 3.29 0.27 3.53 3.41 0.12
G20 河岸毛病 4.98 4.91 0.06 5.15 5.17 0.02
2.94 2.96 0.02 4.7 4.45 0.26
G21 古城温床 4.68 4.56 0.12 5 4.98 0.02
3.68 3.88 0.2 3.66 3.6 0.06 Max 0.27 0.36
Min 0 0
Median 0.09 0.07 Mean 0.1 0.09
[image:7.595.179.421.78.588.2]SD 0.07 0.09
Table 3: The Intra-group Consistency of the CST Results of Each Group
used to evaluate the intra-group consistency, the final result of each of them is the mean of its two results. According to our definition, the range of semantic transparency value is[0,1], but the experimental results are obtained using 7-point scales, so we need to normalize these results in order to map them to the range
[0,1]. The normalized OST and CST results will be merged intoDostandDcst respectively. Assume that, in the datasetDost, the OST result of theith(i= 1,2,3, ...,1176)word isSiw, and the normalized result isSi′w, then,
OST CST
Gi w1 w2 w1,c1 w1,c2 w2,c1 w2,c2
G1 2.94 5.52 2.85 2.97 4.56 5.56
G2 3.6 5.55 3.15 3.2 4.92 5.75
G3 3.51 5.64 3.17 3.23 4.75 5.58
G4 3.81 5.68 3.53 3.59 4.58 5.42
G5 3.74 5.46 3.38 3.56 4.64 5.55
G6 3.65 5.55 3.63 3.56 4.85 5.65
G7 3.58 5.51 3.47 3.58 4.75 5.23
G8 3.22 5.53 3.4 3.36 4.8 5.48
G9 3.31 5.15 3.48 3.52 4.69 5.42
G10 3.58 5.53 3.42 3.34 4.69 5.27
G11 3.7 5.67 3.46 3.32 4.52 5.36
G12 3.33 5.71 3.19 3.28 4.41 5.14
G13 3.47 5.78 3.58 3.56 4.73 5.38
G14 3.48 5.58 2.94 2.94 4.42 5.3
G15 3.4 5.42 3.42 3.27 4.62 5.1
G16 3.47 5.56 3.34 3.25 4.59 5.16
G17 3.6 5.56 3.3 3.26 4.5 5.17
G18 3.67 5.67 3.36 3.34 4.47 5
G19 3.28 5.56 3.2 3.29 4.37 5.18
G20 3.56 5.48 3.21 3.36 4.72 5.34
G21 3.62 5.32 3.2 3.28 4.5 5.24
Max 3.81 5.78 3.63 3.59 4.92 5.75 Min 2.94 5.15 2.85 2.94 4.37 5 Median 3.56 5.55 3.36 3.32 4.62 5.34
[image:8.595.183.411.68.364.2]Mean 3.5 5.54 3.32 3.34 4.62 5.35 SD 0.2 0.14 0.2 0.18 0.15 0.2
Table 4: The Inter-group Consistency of the OST and CST Results
And assume that, in the datasetDcst, the CST result of thejth(j= 1,2)constituent of theith word is
Sc
i,j, and the normalized result isSi,j′c, then,
S′c i,j = S
c i,j−1
6
6 Distribution
Influenced by outliers and perhaps other factors, the OST and CST results cannot cover the whole range of the scale[0,1]; both ends shrink towards the central point0.5, and the shrinkage of each end is about 0.2; nevertheless, the results can still assign proper ranks of semantic transparency to the compounds and their constituents which are generally consistent with our intuitions. Among the normalized OST results, the maximum is0.81; the minimum is0.28; the median is0.63; and their mean is0.62 (SD = 0.09). Among the normalized CST results of the first constituents (C1.CST results), the maximum is0.77; the minimum is0.19; the median is0.57; and their mean is0.56 (SD= 0.09). And among the normalized CST results of the second constituents (C2.CST results), the maximum is0.79; the minimum is0.22; the median is0.6; and their mean is0.58 (SD= 0.1). The distributions of OST, C1.CST, and C2.CST results are similar; all of them are negatively skewed (see Figure 1), and their estimated skewnesses are−0.66,
−0.77, and−0.63respectively. These distributions exhibit that more compounds and their constituents in our datasets have relatively high semantic transparency values.
7 Conclusion
Gi r1 r2 r3
G1 0.68 0.68 0.91
G2 0.72 0.72 0.93
G3 0.76 0.78 0.96
G4 0.76 0.77 0.96
G5 0.75 0.56 0.95
G6 0.63 0.72 0.91
G7 0.83 0.78 0.94
G8 0.76 0.77 0.96
G9 0.68 0.81 0.95
G10 0.84 0.83 0.95 G11 0.78 0.71 0.91 G12 0.72 0.77 0.95 G13 0.85 0.86 0.96 G14 0.69 0.85 0.95 G15 0.68 0.82 0.95 G16 0.82 0.85 0.95 G17 0.79 0.83 0.94 G18 0.81 0.86 0.96
G19 0.76 0.8 0.95
[image:9.595.231.359.68.348.2]G20 0.76 0.75 0.94 G21 0.73 0.86 0.96 Max 0.85 0.86 0.96 Min 0.63 0.56 0.91 Median 0.76 0.78 0.95 Mean 0.75 0.78 0.94 SD 0.06 0.07 0.02
Table 5: The Correlation Coefficients between the OST and CST Results
Normalized OST Results
Frequency
0.0 0.2 0.4 0.6 0.8 1.0
0
100
200
300
Normalized C1.CST Results
Frequency
0.0 0.2 0.4 0.6 0.8 1.0
0
100
200
300
Normalized C2.CST Results
Frequency
0.0 0.2 0.4 0.6 0.8 1.0
0
100
200
300
Figure 1: The Distributions of the Normalized OST and CST Results
[image:9.595.76.513.429.528.2]Acknowledgements
The work described in this paper was supported by grants from the Research Grants Council of the Hong Kong Special Administrative Region, China (Project No. 544011 & 543512).
References
Adam J Berinsky, Gregory A Huber, and Gabriel S Lenz. 2011. Using mechanical turk as a subject recruitment tool for experimental research. Submitted for review.
Chris Callison-Burch and Mark Dredze. 2010. Creating speech and language data with amazon’s mechanical
turk. InProceedings of the NAACL HLT 2010 Workshop on Creating Speech and Language Data with Amazon’s
Mechanical Turk, pages 1–12. Association for Computational Linguistics.
Keh-Jiann Chen, Chu-Ren Huang, Li-Ping Chang, and Hui-Li Hsu. 1996. Sinica Corpus: Design Methodology for Balanced Corpora. In B.-S. Park and J.B. Kim, editors,Proceeding of the 11th Pacific Asia Conference on
Language, Information and Computation, pages 167–176. Seoul:Kyung Hee University.
Matthew JC Crump, John V McDonnell, and Todd M Gureckis. 2013. Evaluating amazon’s mechanical turk as a tool for experimental behavioral research. PloS one, 8(3):e57410.
Iryna Gurevych and Torsten Zesch. 2013. Collective intelligence and language resources: introduction to the special issue on collaboratively constructed language resources. Language Resources and Evaluation, 47(1):1– 7.
Shuanfan Huang. 1998. Chinese as a headless language in compounding morphology. New approaches to Chinese
word formation: Morphology, phonology and the lexicon in modern and ancient Chinese, pages 261–284.
Winter Mason and Siddharth Suri. 2012. Conducting behavioral research on amazon’s mechanical turk. Behavior
research methods, 44(1):1–23.
Leh Woon Mok. 2009. Word-superiority effect as a function of semantic transparency of chinese bimorphemic
compound words. Language and Cognitive Processes, 24(7-8):1039–1081.
Robert Munro, Steven Bethard, Victor Kuperman, Vicky Tzuyin Lai, Robin Melnick, Christopher Potts, Tyler Schnoebelen, and Harry Tily. 2010. Crowdsourcing and language studies: the new generation of linguistic data.
In Proceedings of the NAACL HLT 2010 Workshop on Creating Speech and Language Data with Amazon’s
Mechanical Turk, pages 122–130. Association for Computational Linguistics.
James Myers, Bruce Derwing, and Gary Libben. 2004. The effect of priming direction on reading chinese
com-pounds. Mental Lexicon Working Papers, 1:69–86.
Gabriele Paolacci, Jesse Chandler, and Panagiotis G Ipeirotis. 2010. Running experiments on amazon mechanical
turk. Judgment and Decision making, 5(5):411–419.
David G Rand. 2012. The promise of mechanical turk: How online labor markets can help theorists run behavioral experiments. Journal of theoretical biology, 299:172–179.
Tyler Schnoebelen and Victor Kuperman. 2010. Using amazon mechanical turk for linguistic research.
Psi-hologija, 43(4):441–464.
Rion Snow, Brendan O’Connor, Daniel Jurafsky, and Andrew Y Ng. 2008. Cheap and fast—but is it good?:
evaluating non-expert annotations for natural language tasks. InProceedings of the conference on empirical
methods in natural language processing, pages 254–263. Association for Computational Linguistics.
Aobo Wang, Cong Duy Vu Hoang, and Min-Yen Kan. 2013. Perspectives on crowdsourcing annotations for natural
language processing. Language Resources and Evaluation, 47:9–31.
干红梅. 2008.语义透明度对中级汉语阅读中词汇学习的影响.语 字 用, 1:82–90.
徐彩华and李镗. 2001.语义透明度影响儿童词汇学习的实验研究.语 字 用, 1:53–59.
王春茂and彭聃龄. 1999.合成词加工中的词频,词素频率及语义透明度.心 学 , 31(3):266–273.
苑春法and黄昌宁. 1998.基于语素数据库的汉语语素及构词研究. 汉语 学, 2(1):13.