INTRODUCTION
The question about optimal farm size has a long histo-ry in agricultural economics. Numerous authors have been analysing the relationship between farm size and efficiency (Bielik, Pokrivčák, Jančíková, Beňo 2002; Fan-del 2002; Hughes 2000...).
In general, an increase in firm size first leads to higher marginal returns and lower marginal costs. However, be-yond a certain size, marginal returns will decrease and marginal costs will rise (but not necessarily simulta-neously). Optimal size is reached when marginal returns equal marginal costs. Scale economies are usually a con-sequence of the better and more efficient use of produc-tion factors. As firm size increases, labour and machinery can be better adjusted.
With the help of Data Envelopment Analysis, we try to identify significant differences among various size groups of farms in conditions of agriculture in Slovakia. This methodology was used to estimate the technical efficiency and analyse how much the farm performance could be improved.
METHODOLOGY
We have applied Data Envelopment Analysis (DEA) to ascertain the optimal size of farms. As explained in Färe
et al. (1985), DEA constructs, in a non-parametric man-ner, the convex hull around a set of observations. The distance to this production frontier is then a measure of technical inefficiency. For the calculation of technical efficiency (TE) under the constant returns to scale (CRS), we used, the model suggested by Charnes, Cooper and Rhodes (1978) and assuming variable returns to scale (VRS), we applied model of Banker, Charnes and Cooper (1984). When assuming constant returns to scale, total technical efficiency is estimated, but total technical effi-ciency can be further decomposed into pure technical ef-ficiency and scale efef-ficiency (SE). To calculate pure technical efficiency, the production technology is as-sumed to display variable returns to scale. Scale efficien-cy is then the residual between the total and pure technical efficiency. Calculation of SE itself assumes the calculation of TE measures under both CRS and VRS. If there is a difference between the scores of technical effi-ciency under CRS and VRS for a certain farm, the differ-ence indicates that a farm is scale-inefficient. Scale efficiency measure can be calculated by dividing the to-tal technical efficiency by pure technical efficiency:
SE =
VRS CRS
TE TE
Scale efficiency can be interpreted as follows:
Scale efficiency of agricultural enterprises in Slovakia
Efektívnosť z rozsahu poľnohospodárskych podnikov na Slovensku
P. B
IELIK. M. R
AJČÁNIOVÁSlovak University of Agricultur, Nitra, Slovak Republic
Abstract: The scale efficiency enables to measure technical relationship between farm size and efficient land using as a basic production factor according to its different allocation. The research has been done on a selected sample of agricultural enterprises in the Slovak Republic. A non-parametric data envelopment analysis approach has allowed investigating the differences in efficien-cy among various size groups of 110 agricultural enterprises. The research has proved that about 10 per cent of the analysed farms were operating during the analysed period at the optimal scale, 77 per cent at the above optimal scale and 13 per cent of the farms could increase the efficiency by increasing their acreage of agricultural land.
Key words: data envelopment analysis, technical efficiency, scale efficiency, size of farm
Abstrakt: Efektívnosť z rozsahu je parametrom umožňujúcim merať technický vzťah medzi veľkosťou podniku a výsledkom efektívneho využitia pôdy ako základného výrobného faktora vo väzbe na rozsah jej diferencovanej alokácie. Výskum sa uskutočnil na vybranej vzorke poľnohospodárskych podnikov v Slovenskej republike. Neparametrická metóda analýzy dá-tových obalov (Data Envelopment Analysis) umožnila na vzorke 110 poľnohospodárskych podnikov preskúmať rozdiely v dosiahnutej efektívnosti v rozdielnych veľkostných skupinách podnikov. Výskum potvrdil, že v skúmanom období asi 10 percent sledovaných podnikov hospodárilo na optimálnej výmere, 77 percent podnikov hospodárilo na výmere vyššej ako optimálnej a 13 percent podnikov by mohlo zvýšiť svoju efektívnosť zvýšením ich výmery poľnohospodárskej pôdy.
– If SE = 1, then a farm is scale-efficient, its combination of inputs and outputs is efficient both under CRS and VRS – If SE < 1, then the combination of inputs and outputs is
not scale-efficient.
Further, we can also identify whether a farm operates under increasing returns to scale (IRS) or decreasing re-turns to scale (DRS) by using the DEA model under the non-increasing returns to scale (NIRS).
If SE =
NIRS CRS
TE TE
= 1
then a farm operates under increasing returns to scale
If SE =
NIRS CRS
TE TE
< 1
then a farm operates under decreasing returns to scale.
DATA
The analysis was performed on data from the years 1999–2001. The used data set covered 110 agricultural enterprises; in that number, there were 6 size groups of farms identified. The dynamics of changes of farm sizes nowadays is not very considerable, so the data used in our analysis for the years 1999–2001 correspond with the presence.
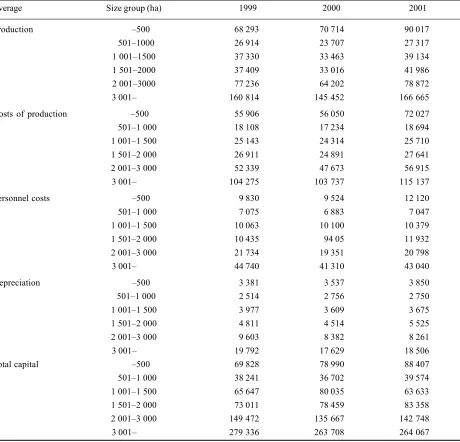
[image:2.595.64.524.302.744.2]For the calculation of technical efficiency, we have cho-sen one output variable – value of production, and four input variables – costs of production, personnel costs, depreciation and total capital (Table 1). All the selected variables represent real inputs into production and have positive values, which are two basic criteria for the se-lection of variables. Suitability of the selected variables was endorsed also by the correlation analysis, when the
Table 1. Basic characteristics of output and input variables according to various farm size (thousand SKK)
Average Size group (ha) 1999 2000 2001
Production –500 68 293 70 714 90 017
501–1000 26 914 23 707 27 317
1 001–1500 37 330 33 463 39 134
1 501–2000 37 409 33 016 41 986
2 001–3000 77 236 64 202 78 872
3 001– 160 814 145 452 166 665
Costs of production –500 55 906 56 050 72 027
501–1 000 18 108 17 234 18 694
1 001–1 500 25 143 24 314 25 710
1 501–2 000 26 911 24 891 27 641
2 001–3 000 52 339 47 673 56 915
3 001– 104 275 103 737 115 137
Personnel costs –500 9 830 9 524 12 120
501–1 000 7 075 6 883 7 047
1 001–1 500 10 063 10 100 10 379
1 501–2 000 10 435 94 05 11 932
2 001–3 000 21 734 19 351 20 798
3 001– 44 740 41 310 43 040
Depreciation –500 3 381 3 537 3 850
501–1 000 2 514 2 756 2 750
1 001–1 500 3 977 3 609 3 675
1 501–2 000 4 811 4 514 5 525
2 001–3 000 9 603 8 382 8 261
3 001– 19 792 17 629 18 506
Total capital –500 69 828 78 990 88 407
501–1 000 38 241 36 702 39 574
1 001–1 500 65 647 80 035 63 633
1 501–2 000 73 011 78 459 83 358
2 001–3 000 149 472 135 667 142 748
3 001– 279 336 263 708 264 067
output variable strongly correlate with all input variables (r ∈<0.8258; 0.9797>).
RESULTS
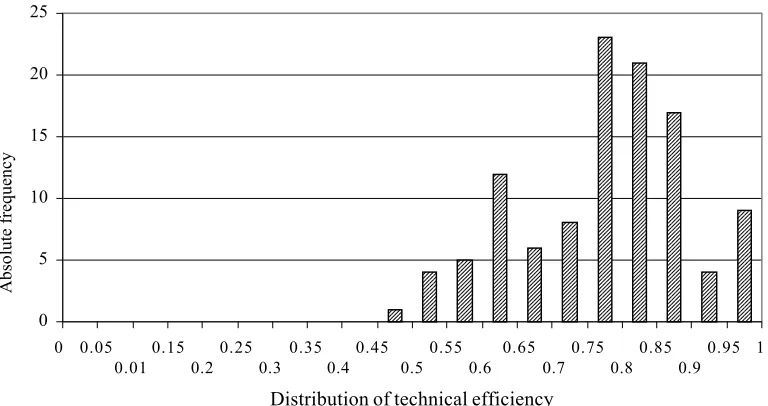
Efficiencies were calculated by the input-oriented Data Envelopment Analysis Model with the assumption of constant (CRS) and variable return to scales (VRS). The distribution of the total technical efficiency (CRS) of Slo-vak farms is presented in the Figure 1. It shows that the majority of the farms (99 per cent) reach an efficiency lev-el between 45 and 95 per cent. The mean equals 0.825 in 2001, and the standard deviation 0.115. There is also a smaller group of outstanding performers with efficiency values between 0.95 and 1.
In the next section, we have calculated the rate of tech-nical efficiency under variable returns to scale (VRS). As
[image:3.595.86.470.57.260.2]we can see in the Figure 2, about 14 per cent of the sam-ple of agricultural farms in 2001 are identified as techni-cally efficient and operating at the best practice. The average VRS measure of technical efficiency for all farms in the sample is 0.857 and the standard deviation 0.119. As seen earlier, the scale efficiency of enterprises can be measured by the ratio of constant returns to scale and Figure 1. Distribution of the total technical efficiency (CRS-scores in 2001)
[image:3.595.297.525.456.524.2]Source: Own calculations
Table 2. Summary statistics of efficiency measures
Average 1999 2000 2001
Technical efficiency CRS 0.842 0.733 0.825 Technical efficiency VRS 0.872 0.827 0.857
Scale efficiency 0.966 0.89 0.964
Source: Own calculations 0
5 10 15 20 25
Absolute frequency
0 0.05 0.15 0.25 0.35 0.45 0.55 0.65 0.75 0.85 0.95 1
0.01 0.2 0.3 0.4 0.5 0.6 0.7 0.8 0.9
Distribution of technical efficiency
Figure 2. Proportion of efficient enterprises (%)
Source: Own calculations 0
5 10 15 20 25
CRS TE VRS TE SE
%
[image:3.595.59.336.569.763.2]variable returns to scale input measures of technical effi-ciency. The ratio of unity indicates that the farm is oper-ating at optimal scale. The results of scale efficiency are also summarised in Table 2 and Figure 2. These results show that 10 per cent of enterprises in the sample in 2001 are operating at their optimal scale. In average, scale ef-ficiency is about 0.964 per cent, the standard deviation is 0.115
As seen above, the existence of sub-optimal or supra-optimal scale is identified by the equality or the inequal-ity of the variable returns to scale and the non-increasing returns to scale input measures of technical efficiency.
The results of our analysis (Figure 3) show that about 13 per cent of the farms are operating below their optimal scale. This means that these farms could increase their technical efficiency by continuing to increase their size. The results also indicate that 77 per cent of the farms are above their optimal scale and hence could increase their technical efficiency by decreasing their size.
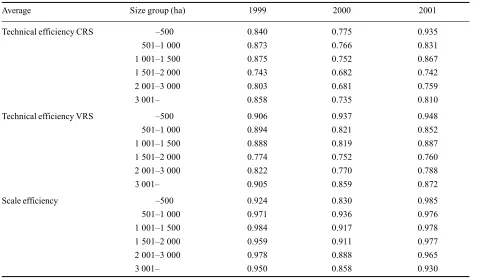
In the next section, we have calculated efficiency mea-sures according to different size groups of farms. Six size groups were recognised: under 500 ha, 501–1 000 ha, 1 001–2 000 ha, 2 001–3 000 ha and above 3 001 ha. As seen in the Table 3, the most technically efficient farms (CRS and VRS) are under 500 ha and farms of 501–1 000 ha size are in average the most scale efficient.
CONCLUSION
[image:4.595.66.281.59.211.2]In this paper, there are summarised the panel data of 110 Slovak agricultural enterprises. The main attention of this analysis was given to their technical efficiency and scale efficiency of different size groups of farms. Six size groups were recognised: under 500 ha, 501–1 000 ha, 1 001–2 000 ha, 2 001–3 000 ha and above 3 001 ha. The result indicates that the most technically efficient farms (CRS and VRS) are smaller than 500 ha. Curtiss (2000) has made similar analysis for Czech agricultural enterprises were the farms above 150 ha performed in average better than the other groups. In spite of it, according to Hugh-es (2000), small private farms (up to 10 ha) in Hungary perform remarkably better. Hughes has also investigated
Table 3. Summary statistics of efficiency measures according to various farm size
Average Size group (ha) 1999 2000 2001
Technical efficiency CRS –500 0.840 0.775 0.935
501–1 000 0.873 0.766 0.831
1 001–1 500 0.875 0.752 0.867
1 501–2 000 0.743 0.682 0.742
2 001–3 000 0.803 0.681 0.759
3 001– 0.858 0.735 0.810
Technical efficiency VRS –500 0.906 0.937 0.948
501–1 000 0.894 0.821 0.852
1 001–1 500 0.888 0.819 0.887
1 501–2 000 0.774 0.752 0.760
2 001–3 000 0.822 0.770 0.788
3 001– 0.905 0.859 0.872
Scale efficiency –500 0.924 0.830 0.985
501–1 000 0.971 0.936 0.976
1 001–1 500 0.984 0.917 0.978
1 501–2 000 0.959 0.911 0.977
2 001–3 000 0.978 0.888 0.965
3 001– 0.950 0.858 0.930
[image:4.595.55.533.467.745.2]Source: Own calculations
Figure 3. Proportion of efficient and inefficient enterprises
Source: Own calculations IRS 13% – 14 farms Sub-optimal scale
DRS 77 % – 85 farms Supra-optimal scale CRS
the situation in Slovakia and the result of his analysis indicates that the best performing farms are those over 2 000 ha. As seen in van Zyl et al. (1996), larger private farms (above 15 ha) in Poland are in general less efficient than the other size groups.
REFERENCES
Banker R.D., Charnes A., Cooper W.W. (1984): Some Models for Estimating Technical and Scale Inefficiences in Data Envelopment Analysis. In: Management Science, 30 (9): 1078–1092.
Bielik P., Pokrivčák J., Jančíková V., Beňo M. (2002): Prírod-né, produkčné a ekonomické podmienky reštrukturalizácie individuálnych fariem a poľnohospodárskych podnikov v Slovenskej republike. Agricultural Economics – Czech, 48 (5): 211–214.
Charnes A., Cooper W.W., Rhodes E. (1978): Measuring the efficiency of decision making units. European Journal of Operational Research, 2 (2): 429-444.
Curtiss J. (2000): Technical Efficiency and Competitiveness of the Czech Agricultural Sector in Late Transition – The Case of Crop Production. Paper presented to the KATO Symposium, Berlin, 2nd–4th November.
Färe R., Grosskopf S., Knox Lovell C.A. (1985): The Mea-surement of Efficiency in Production. Kluwer-Nijhoff, Bos-ton.
Fandel P. (2002): Veľkosť poľnohospodárskych podnikov a ich efektívnosť. Medzinárodné vedecké dni 2002, SPU Nitra: 963–971; ISBN 80-8069-030-8.
Hughes G. (2000): Total productivity of emergent farm struc-tures in Central and Eastern Europe. In: Banse M., Tanger-mann S. (eds.): Central and Eastern European Agriculture in an Expanding European Union. Walingford, CABI Publish-ing: 61–87.
Zyl van J., Miller W.R., Parker A.N. (1996): Agrarian Struc-ture in Poland. The myth of large farm superiority. Wash-ington D.C., The World Bank.
Arrived on 22nd June 2004
Contact address:
Prof. Ing. Peter Bielik, PhD., Ing. Miroslava Rajčániová; Slovenská poľnohospodárska univerzita v Nitre, Tr. A. Hlinku 2, 949 76 Nitra, Slovenská republika