Automaticity and Reestablishment of Executive
Control—An fMRI Study
Andrea Ku
¨bler
1,2, Veronica Dixon
3, and Hugh Garavan
1,3Abstract
& The ability to exert control over automatic behavior is of particular importance as it allows us to interrupt our behavior when the automatic response is no longer adequate or even dangerous. However, despite the literature that exists on the effects of practice on brain activation, little is known about the neuroanatomy involved in reestablishing executive con-trol over previously automatized behavior. We present a visual search task that enabled participants to automatize accord-ing to defined criteria within about 3 hr of practice and then
required them to reassert control without changing the stim-ulus set. We found widespread cortical activation early in practice. Activation in all frontal areas and in the inferior pari-etal lobule decreased significantly with practice. Only se-lected prefrontal (Brodmann’s areas [BAs] 9/46/8) and parietal areas (BAs 39/40) were specifically reactivated when execu-tive control was required, underlining the crucial role of the dorsolateral prefrontal cortex in executive control to guide our behavior. &
INTRODUCTION
In many regards, automatic or habitual behavior is the opposite to executively controlled behavior by virtue of being stimulus driven, ballistic, and often unintended. According to Logan’s instance theory of automaticity (Compton & Logan, 1991; Logan, 1988, 2002) each experience with a stimulus lays down a separate trace in memory such that automaticity is strengthened with every encounter of the stimulus. This theory further assumes that encoding into and retrieval from memory are unavoidable consequences of attention and that performance is regarded as automatic if behavior is guided by direct memory retrieval. Novices’ perform-ance on a particular task is based on computing an algorithm suitable to achieve the desired result. The more often novices are confronted with the same prob-lem, the more likely it is that they will retrieve the solution from memory and will eventually abandon the algorithm entirely. Thus, automatization is characterized by the transition from algorithm-based to memory-based processing with a speedup in processing and reduced variability being the major quantitative behavioral prop-erties of automatization (Logan, 1988). To enable the transition to memory-based processing, automaticity of a particular behavior can only be achieved when the same stimuli require the same responses throughout practice, a process referred to as consistent mapping (Schneider & Shiffrin, 1977). Transfer to novel stimuli is poor
(Logan, 1988, 2002), but is facilitated by stimulus simi-larity (Palmeri, 1997).
When task rules change within the same stimulus set it is necessary to reestablish executive control over an automatic process. This reestablishment requires a num-ber of executive functions such as the inhibition of the prepotent response tendency and increased endoge-nous attentional control to apply the new task rule. However, once automatic behavior is established, it is typically quite difficult to reestablish executive control over performance, as the speed of the automatic process tends to produce a faster response than the deliberative, algorithmic process. This characteristic is quite appar-ent phenomenologically in the Stroop task (Stroop, 1935), in which the faster, automatic word-naming op-eration tends to interfere with the slower color naming despite the subject’s best (executive) intentions.
A large body of functional imaging studies of practice effects exists (Kelly & Garavan, 2005). Neuroanatomi-cally, practice tends to either increase or decrease activation within the involved cortical network or pro-duces a functional reorganization, indicating that the cortical regions recruited for task processing are altered with practice. Activation decreases are most often seen in complex sensorimotor or working memory tasks that do not involve a change in the underlying cognitive op-erations. This decrease in activation in the cortical net-work is interpreted as increased neural efficiency in task processing (Beauchamp, Dagher, Aston, & Doyon, 2003; Toni, Rowe, Stephan, & Passingham, 2002; Buchel, Coull, & Friston, 1999). In motor skill learning, a pattern of increasing and decreasing activation can be observed
1
such that activation decreases with practice in control and attentional areas located in the prefrontal and parietal cortex, whereas in task-specific areas of the premotor and motor cortex and cerebellum activation increases (Debaere, Wenderoth, Sunaert, Van Hecke, & Swinnen, 2004; Frutiger et al., 2000). This redistribution (Kelly & Garavan, 2005) of activation is in accordance with explicit attention to performance when confronted with a novel task that is replaced with practice by implicit or procedural task performance. Altered func-tional activations underlying task performance are most often seen in cognitive tasks that imply different cog-nitive processes operating early and late in practice (Poldrack & Gabrieli, 2001; Raichle et al., 1994). For example, mirror reading requires visuospatial transfor-mation early in learning that is replaced by word recog-nition later in practice.
The extensive literature on practice effects stands in contrast to the sparse research into the neuroanatomy through which executive control is asserted over a highly practiced task. The few studies available either presented their participants with novel stimuli (Raichle et al., 1994) or required them to reattend to the per-formance of an overlearned task ( Jueptner et al., 1997). In both of these cases, prefrontal areas involved in at-tentional control were reactivated. To our knowledge, the dynamics involved in reasserting control over a behavior that is demonstrably automatic have not been addressed. These dynamics are quite relevant for clinical conditions in which overcoming habitual behaviors is difficult, such as addiction, obsessive–compulsive disor-der, or the ingrained behavioral and cognitive patterns evident in depressed patients. Furthermore, exerting control over otherwise automatic behaviors occurs fre-quently in everyday life as experienced by drivers when traffic conditions suddenly worsen or by the effort involved in not putting sugar in one’s coffee when dieting. To investigate these processes, we report data from a visual search task (VST) that (a) requires atten-tional control early in practice but becomes automated with time, (b) provides behavioral measures of the transition from controlled to automatic performance, (c) can be changed by instruction alone (i.e., without changing the stimuli or response demands) to require subjects to reassert control over their automatic behav-ior, and (d) can all be completed within a reasonable number of hours in the same day to facilitate functional imaging.
In Experiment 1, we established the VST (Figure 1) and showed with a sample of 16 participants that people can automatize within about 3 hr of practice. Partici-pants were trained on the task on five subsequent days always at the same time of day. The VST contained different set sizes, and participants had to indicate whether a target was present or not. We postulated that at the beginning of training participants would use a slow serial search strategy to detect the target, whereas
with practice they would recall target and nontarget pat-terns from memory (Klapp, Boches, Trabert, & Logan, 1991; Logan & Klapp, 1991). Accordingly, the develop-ment of automaticity would be demonstrated by asymp-totic reaction time and the disappearance of a stimulus set size effect. Following a change in target (further referred to as a switch), participants had to recommence the serial search strategy and overcome the learned stimulus-driven, memory-based response, which we ex-pected to lead to increased reaction time and a reemer-gence of the set size effect. The presence of the two targets in the trials was balanced such that a simple response reversal would not suffice. With a sample of 72 participants, we investigated in Experiment 2 if simi-lar results would be obtained within one day of prac-tice. This was done with respect to functional magnetic resonance imaging (fMRI ) requirements. Finally, in Experiment 3 we used the task to investigate the neural network underlying automaticity and reestablishment of executive control over previously automatized behavior. With a sample of 24 participants, functional imaging was conducted early in practice, late in practice, and during the target switch.
METHODS
The Task
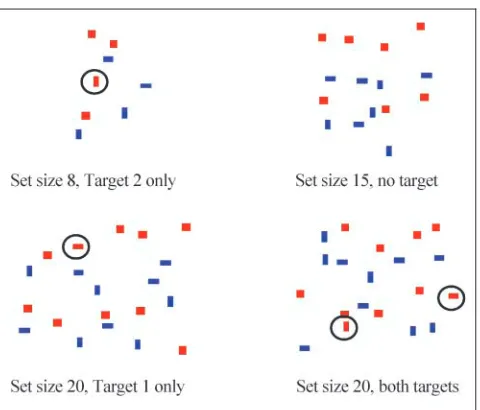
[image:2.612.312.552.59.264.2]Participants were presented with sets of blue rectangles, red squares, and red targets on a white background (Figure 1). Rectangles and squares were assigned to random positions within a circle (which was not shown on the screen) ofr= 10 cm; the items did not overlap. Sets contained 8, 15, or 20 items. Target 1 was a red
horizontal rectangle, Target 2 a red vertical rectangle (identified by circles in Figure 1). Sets contained both targets, Target 1 only, Target 2 only, or no targets. These different trial types ensured that after the target switch a simple reversal of the response strategy would not suffice. For each set size and trial type, two different patterns were designed. Sets were presented for 1 sec in the first block and for 800 msec in all following blocks. Participants were required to press the left mouse key whenever they detected Target 1 in the set and the right mouse key if Target 1 was not present. They were instructed to be as accurate as possible, but at the same time to respond as fast as they could. Feedback (correct, incorrect) was given after each trial. If participants did not respond within 1 sec (or 800 msec for all blocks after Block 1) the feedback was ‘‘no response detected— please try to respond faster.’’ Before the start of a new run of trials, the word PREPARE appeared on the screen to allow participants to get ready. After practice, partic-ipants were instructed to search for Target 2 in the sets. They were now required to press the left mouse key when Target 2 was present and the right mouse key when it was not present. The point in time where participants were required to search for the new target within the well-known sets is referred to as ‘‘switch.’’ No mention was made of Target 2 to participants prior to the switch.
Altogether, 112 participants took part in the study, which was approved by the institutional review board of the Medical College of Wisconsin and the ethics com-mittee of the Department of Psychology, Trinity College, Dublin.
Experiment 1
Sixteen participants (4 men, mean age ± SD: 20.38 ± 2.68 years, age range: 18–28 years) performed five practice blocks on five consecutive days, always at the same time of the day. Blocks comprised six runs of 1152 trials (totaling 5760 trials) and lasted about 30 min, which were separated by 30-sec breaks. Participants were presented with two different stimulus patterns per set size (8, 15, or 20 items) and trial type (Target 1 only, Target 2 only, both targets present, neither target present) and each set was presented eight times per run resulting in 192 trials per run. On Day 4, participants were presented with two runs of the task as described. Thereafter, they were instructed to search for Target 2.
Data Analysis
Individual Participants
To assess automaticity, reaction time as a function of runs and set size was calculated for correct trials only. Par-ticipants were regarded as automatized when no main ef-fect of set size and no differences in reaction time (p>
.10) were found in three consecutive runs (two-way uni-variate analysis of variance [ANOVA] with set size (3) and runs (3) as factors). In all experiments, analyses were re-stricted to just those participants who automatized.
Group Data
Repeated measures ANOVAs with set size or with set size and runs as factors were applied to the group data. All post hoc pairwise comparisons were corrected accord-ing to Holm (1979).
Experiment 2
To adapt the VST to scanning requirements, we reduced the stimulus patterns per set size, decreased the number of trials (3456 presented within 36 runs separated into six blocks), and reduced practice to 2.5 hr on one day. Seventy-two participants (28 men, mean age ± SD: 22.74 ± 7.77 years, age range: 18–73 years) performed the shorter version of the VST within one practice session. Participants were presented with only one stimulus pattern per set size and trial type with each presented eight times per run leading to 96 trials per run. Participants were presented with six blocks with each block comprised of six runs separated by 30-sec breaks. Blocks were separated by 5- or 10-min breaks.
Experiment 3
The same VST as in Experiment 2 was used. For scanning reasons the number of trials per run was increased to 108 (number of practice runs was shortened to 23). Thus, each set size and trial type was presented 9 times per run. The number of runs after the switch was reduced to 4 (instead of 10) to shorten the total time for the ex-periment (2916 trials presented in 27 runs). Note that the number of practice trials before the switch remained the same as in Experiment 2 (2496 in Experiment 2 and 2484 in Experiment 3; the difference of 12 trials was due to scanning constraints). Twenty-four participants (7 men, mean age ± SD: 29.42 ± 8.66 years, age range: 18–47 years) were imaged at the beginning of training for 6 runs (648 trials). Thereafter, they practiced three blocks of 5 runs (1620 trials) each outside the scanner. During the second scan, the instruction for the target switch was presented after 2 runs, and 4 further runs were com-pleted after the switch (second scanning 648 trials).
Functional Magnetic Resonance Imaging
30.5-cm i.d., three-axis local gradient coil, and an end-capped quadrature birdcage radio-frequency head coil ( Wong, Boskamp, & Hyde, 1992). For each participant, two high-resolution (SPGR) anatomic images were ac-quired prior to functional imaging (first and second scanning) to allow subsequent anatomical localization and normalization of functional activation. Stimuli were back-projected onto a screen at the subject’s feet and were viewed with the aid of prism glasses attached to the inside of the radio-frequency head coil.
Functional Analysis
All data processing was conducted with the software package AFNI (Cox, 1996; Medical College of Wisconsin). Time shifting, using Fourier interpolation to adjust for differences in slice acquisition times, 3-D motion correc-tion, and edge detection algorithms were first applied to the functional data. One scan comprised 216 trials (two runs) and three scans were recorded early in practice. A scan consisted of six on–off blocks; that is, 36 trials were followed by a 30-sec rest period. After practice outside the scanner, one scan preswitch and two scans postswitch were recorded. The average percentage change in signal for the six ‘‘on periods’’ of each scan was calculated relative to the average signal during the rest periods. These percent change scores served as the basic unit of analysis and are subsequently referred to as ‘‘activa-tion.’’ Activation maps were converted to a standard stereotaxic coordinate system (Talairach & Tourneaux, 1988) and spatially blurred using a 4.2-mm full width at half-maximum isotropic Gaussian filter. Monte Carlo simu-lations revealed that a voxelwise threshold (p = .001) combined with a minimum cluster size criterion (174Al) resulted in a posterior voxelwise threshold ofp= 106 and a p < .01 false positive level for a cluster of activation. This threshold was used for all subsequent t tests. Basic task activation maps for each scan were identified with one-sample t tests against the null hypotheses of no change in activation. Following pre-vious studies, activation maps for all scans were com-bined (OR map) such that voxels were included if significant in any one scan (Hester et al., 2005; Ku¨bler, Murphy, & Garavan, 2005; Kaufman, Ross, Stein, & Garavan, 2003; Ku¨bler, Murphy, Kaufman, Stein, & Garavan, 2003). This is a more inclusive analysis in which significant activation from all scans are taken into account with no bias of the regions of interest (ROIs) toward a specific task section (early or late in practice). Brodmann’s area (BA) templates, as provided by AFNI, were applied to the OR map identifying significantly activated voxels within each BA. The re-sulting clusters were used as functionally and anatom-ically defined ROIs and activation was averaged over all the voxels of a cluster and over clusters within each BA resulting in 37 ROIs. For each ROI, activation at the beginning of practice (Scan 1), preswitch (Scan 4), and
postswitch (Scan 5) was compared using a repeated measures ANOVA with scans as within-subject factors; post hoc pairwise comparisons were corrected accord-ing to Holm (1979). To ensure that averagaccord-ing over clusters within a BA did not obscure effects that might be present in just one cluster, the repeated measures ANOVA was performed on each of the 96 individual clusters that were included > 100 Al of activated voxels.1 This analysis yielded identical results with two exceptions. One cluster in BA 8 and one cluster in BA 40 showed increased activation from pre- to postswitch and these clusters are listed separately in Table 1. Finally, bilateral clusters within each BA were also tested for hemispheric differences.
RESULTS
Experiment 1
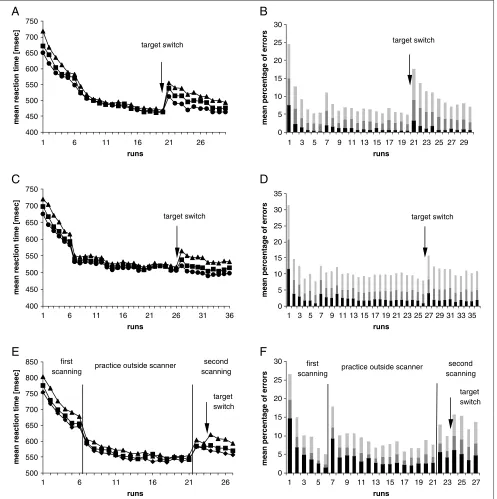
Five participants did not automatize, and from another, an entire block was lost, leaving 10 participants for analyses. A repeated measures ANOVA with runs (first run of practice, last run before the switch, and first run after the switch) and set size (8, 15, 20) as within-subjects factor found a main effect of run, F(2,18) = 237.8,p< .001; set size,F(2,18) = 42.9,p< .001; and a significant interaction,F(4,36) = 15.6, p< .001). Reac-tion time difference between set sizes 8, 15, and 20 were all significant (p< .05). With practice, the set size effect disappeared and reaction time became asymptotic (Fig-ure 2A). Before the instruction to search for a new target, reaction time was the same for all set sizes (all pairwise comparisons nonsignificant). After the switch, reaction time increased and the set size effect reap-peared (all pairwise comparisons p < .05). Reaction time after the switch was faster than at the beginning of training. It is important to note that the set size effect postswitch remained significant throughout the final 10 runs after the target switch (repeated measures ANOVA with set size as independent variable calculated for each run; all pairwise comparisons between set sizes within runs were significant, p < .05, see Figure 2A). In contrast, during practice before the switch, the main effect of set size disappeared after seven runs and as early as in run three pairwise comparison between set sizes 8 and 15 were nonsignificant. In the first run the error rate (wrong button presses and missing responses) was 25% (Figure 2B). The high error rate in run 7 coincided with the decrease in trial time to 800 msec. With practice, the error rate decreased to 5% before the switch, increased postswitch to 18%, and decreased again over the last 10 runs.
Experiment 2
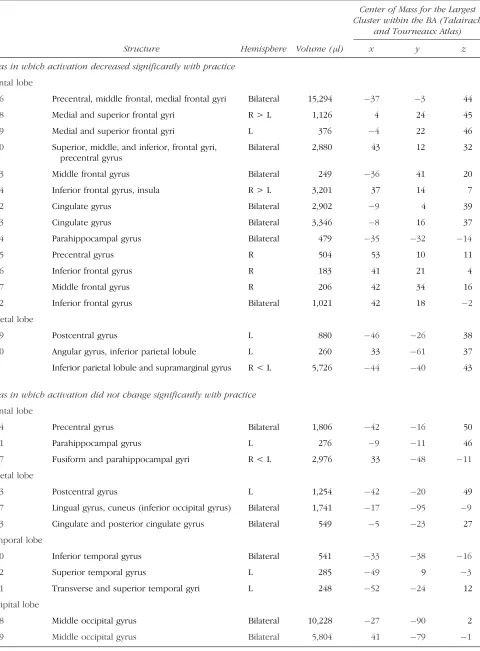
Table 1. Brodmann’s Areas with Significant Activation at Any One Time during Task Performance
Center of Mass for the Largest Cluster within the BA (Talairach
and Tourneaux Atlas)
BA Structure Hemisphere Volume (l) x y z
Areas in which activation decreased significantly with practice
Frontal lobe
6 Precentral, middle frontal, medial frontal gyri Bilateral 15,294 37 3 44
8 Medial and superior frontal gyri R > L 1,126 4 24 45
9 Medial and superior frontal gyri L 376 4 22 46
10 Superior, middle, and inferior, frontal gyri, precentral gyrus
Bilateral 2,880 43 12 32
13 Middle frontal gyrus Bilateral 249 36 41 20
24 Inferior frontal gyrus, insula R > L 3,201 37 14 7
32 Cingulate gyrus Bilateral 2,902 9 4 39
33 Cingulate gyrus Bilateral 3,346 8 16 37
44 Parahippocampal gyrus Bilateral 479 35 32 14
45 Precentral gyrus R 504 53 10 11
46 Inferior frontal gyrus R 183 41 21 4
47 Middle frontal gyrus R 206 42 34 16
2 Inferior frontal gyrus Bilateral 1,021 42 18 2
Parietal lobe
39 Postcentral gyrus L 880 46 26 38
40 Angular gyrus, inferior parietal lobule L 260 33 61 37
Inferior parietal lobule and supramarginal gyrus R < L 5,726 44 40 43
Areas in which activation did not change significantly with practice
Frontal lobe
4 Precentral gyrus Bilateral 1,806 42 16 50
31 Parahippocampal gyrus L 276 9 11 46
37 Fusiform and parahippocampal gyri R < L 2,976 33 48 11
Parietal lobe
3 Postcentral gyrus L 1,254 42 20 49
17 Lingual gyrus, cuneus (inferior occipital gyrus) Bilateral 1,741 17 95 9
23 Cingulate and posterior cingulate gyrus Bilateral 549 5 23 27
Temporal lobe
20 Inferior temporal gyrus Bilateral 541 33 38 16
22 Superior temporal gyrus L 285 49 9 3
41 Transverse and superior temporal gyri L 248 52 24 12
Occipital lobe
18 Middle occipital gyrus Bilateral 10,228 27 90 2
with runs (first run of practice, last run before the switch, and first run after the switch) and set size (8, 15, 20) as within-subject factors revealed a main effect of run,F(2,96) = 437.5,p< .001; set size,F(2,96) = 73.9, p < .001; and a significant interaction, F(2,96) = 12.4, p < .001 (Figure 2C). In the first run, all pairwise comparisons between set sizes were significant (all p< .01). Preswitch reaction time for set size 8 equaled that of set size 15, and reaction time for set size 15 equaled that of set size 20. In contrast to Experiment 1, reaction time difference between set sizes 8 and 20 remained significant (p< .01). After the switch, howev-er, the set size effect was much more pronounced (all pairwise comparisons significant, p < .001). Reaction time became asymptotic with practice and increased postswitch (Figure 2C). As in Experiment 1, after the
first practice block a significant decrease in reaction time and an increase of the error rate can be seen due to the shortened trial time. Again, it is important to note that the set size effect persisted in the final 10 runs of practice postswitch (repeated measures ANOVA with set size as independent variable calculated for each run; all pairwise comparisons between set sizes within runs were highly significant,p< .001). The error rate in the first run was 32%, decreasing to 8% preswitch and increasing to 16% postswitch (Figure 2D).
Experiment 3
Fifteen of 24 participants achieved criterial levels of automaticity.
Table 1. (continued)
Center of Mass for the Largest Cluster within the BA (Talairach
and Tourneaux Atlas)
BA Structure Hemisphere Volume (l) x y z
Areas in which activation changed significantly from pre- to post switch
Frontal lobe
8 Medial and superior frontal gyri" L 376 4 22 46
9 Superior, middle, and inferior, frontal gyri, precentral gyrus"
Bilateral 2,880 43 12 32
46 Middle frontal gyrus" R 206 42 34 16
Parietal lobe
3 Postcentral gyrus# L 1,254 42 20 49
39 Angular gyrus, inferior parietal lobule" L 260 33 61 37
40 Inferior parietal lobule and supramarginal gyrus"
R 1,549 40 45 43
Temporal lobe
41 Transverse and superior temporal gyri# L 248 52 24 12
Areas in which activation decreased significantly with practice and changed significantly from pre- to post switch
Frontal lobe
8 Medial and superior frontal gyri" L 376 4 22 46
9 Superior, middle, and inferior, frontal gyri, precentral gyrus"
Bilateral 2,880 43 12 32
46 Middle frontal gyrus" R 206 42 34 16
Parietal lobe
39 Angular gyrus, inferior parietal lobule" L 260 33 61 37
Behavioral Data
As in Experiments 1 and 2, a repeated measures ANOVA with runs (first run of practice, last run before the switch, and first run after the switch) and set size (8, 15, 20) as within-subject factors found a main effect of
[image:7.612.64.561.63.562.2]run,F(2,28) = 372.3,p< .001; and of set size,F(2,28) = 38.6, p < .001; and a significant interaction, F(2,96) = 3.3, p < .05. In the first run of practice reaction time differed significantly between all set sizes (all pairwise comparisons, p < .05). As in Experiment 2, the set size effect did not completely disappear at the end
of practice (pairwise comparison for set sizes 8 and 20 remained significant, p < .05). However, after the switch the set size effect reemerged fully with all pairwise comparisons reaching significance (p < .05; Figure 2E). After the participants were retransferred into the scanner reaction time increased significantly (repeat-ed measures ANOVA with set size and run as within subject factors, p < .05 for all set sizes compared between last run of practice and first run of the second scanning session, Figure 2E). The error rate in the first run was 27%, decreasing to 10% preswitch and increas-ing to 16% postswitch (Figure 2F).
Functional Data
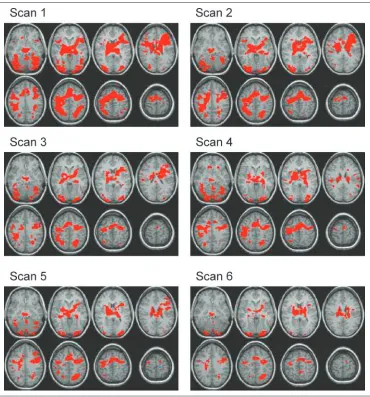
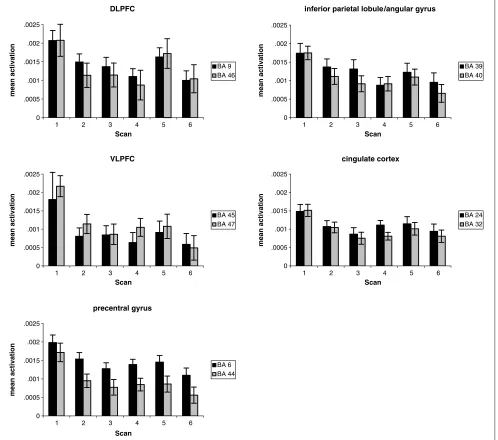
Early in practice we found widespread activation in a fronto–temporo–parietal–occipital network (Figure 3). A repeated measures ANOVA with scans (first scan of practice, last scan before the switch, and first scan after the switch) as within-subject factor was applied to each of 26 functionally defined ROIs. Activation in all frontal areas (BAs 6, 8, 9, 10, 13, 45, 46, and 47) and in some parietal areas (BAs 2, 39, and 40) decreased significantly with practice (pairwise comparisons between Scan 1 and the scan before the switch were significant, p < .05) (Figures 3, 4A, and 5 and Table 1). In the transverse and superior temporal gyrus (BA 41) activation remained unchanged, whereas in all other areas the pattern was of activation decreases, although pairwise comparisons did not reach significance (Figure 3 and Table 1).
After the switch we found very selective increases in activation in the bilateral dorsolateral prefrontal cortex (DLPFC; BAs 9 and 46; pairwise comparisons of runs pre-and postswitch werep< .05 for BA 9 andp= .056 for BA 46) (Figures 4b and 5) and in one cluster in BA 8 (p< .05); activation increased also in the angular gyrus and inferior parietal lobule (BA 39 and one cluster in BA 40,p < .01) bilaterally (Figure 5). Activation in the left postcentral gyrus (BA 3) and left transverse and superior temporal gyrus (BA 41) decreased significantly after the switch as compared to before the switch (bothp< .05). In all other areas, we found no difference in activation pre- and postswitch. Repeated measures ANOVA with runs and hemisphere as within-subjects factors found parietal BAs 37 and 40 more activated in the left (p< .05) and frontal BAs 8 and 13 more in the right (p < .05) hemisphere.
DISCUSSION
With our VST we were able to train participants to criterial levels of automaticity within a reasonable amount of time and to compel them to reestablish executive control over their automatized behavior. Learning curves of all three experiments show the typical logarithmic shape indicating rapid improvement
of performance early in practice and asymptotic perform-ance with further practice (Newell & Rosenbloom, 1981). They also show a prominent set size effect at the beginning of training that reduced dramatically with practice, indicating a transition from serial search to memory retrieval, a hallmark of automatic behavior. In contrast to Experiment 1, the set size effect did not disappear completely in Experiments 2 and 3. We attri-bute these effects to massed practice, which may have led to concentration problems and fatigue in late prac-tice and which may have provided less time for memory consolidation. Despite the set size effect not disappear-ing completely, it is very apparent that the set size ef-fect differed substantially between early and late in practice preswitch and also between pre- and postswitch. Noting that automaticity exists to a matter of degree, this renders the brain comparison at the different task stages meaningful. Had the set size effect in Experiment 3 disappeared completely preswitch (as in Experiment 1) we would expect the functional effects to be even more robust.
Widespread activation, as was observed at the begin-ning of practice, was not recapitulated postswitch. In-stead, of all the frontal areas activated at the beginning of the task, in all of which activation decreased signifi-cantly with practice, only the DLPFC showed increased activation when reestablishment of executive control
[image:9.612.187.557.61.458.2]over automatized behavior was required. The DLPFC is well known to play a crucial role in executive func-tioning, that is, in controlling overt, deliberate, inten-tional (nonautomatic) behavior (Fassbender et al., 2004; Collette & van der Linden, 2002; Wagner, Maril, Bjork, & Schacter, 2001).
Figure 3. Axial view of eight slices. Scans 1–3 early in practice, Scan 4 last scan before the switch, Scan 5 first scan after the switch, Scan 6 last scan of experiment. Activation decreased with practice. In few areas such as BA 9, activation increased after the switch.
[image:9.612.185.559.584.736.2]Neurons in the posterior parietal cortex (including BAs 5, 7, 39, and 40) receive combined information from sensory and motor areas. Their firing rate is increased when attention is directed to a target (Stein, 1989). This renders these cells suitable to control attention and motor behavior according to sensory input. Involvement of the parietal lobes in executive functioning is often observed and has been proposed as being necessary for the actual enactment of frontal commands (Ku¨bler, Murphy, Kaufman, et al., 2003). Accordingly, with in-creasing automaticity, activation decreased in inferior parietal lobule (BAs 39 and 40). We may speculate that the postswitch activation of angular gyrus and inferior parietal lobule (BA 39) reflects an increased attentional response or the creation and establishment of new
stimulus–response mappings according to the new task requirements identified by the DLPFC. After the switch the number of missing responses increased, which could account for the decreased activation in the left post-central gyrus (BA 3).
[image:10.612.55.553.64.504.2]The dynamics involved in the development of auto-maticity and, most importantly, in suppressing unwant-ed automatic behaviors are consequential for many everyday functions as well as being clinically relevant. Although common-day examples may range from turn-ing left to a colleague’s office rather than right to the more frequently visited vending machine or to driving on the ‘‘other’’ side of the road when holidaying abroad, there may be many important clinically relevant exam-ples of failures to exert control over habitual behaviors.
As just one example, compulsive drug use, which has been proposed after many episodes of drug use to adopt the characteristics of automated behavior (Tiffany, 1990), may be regarded as failed executive control over overlearned behavioral habits (Gerdeman, Partridge, Lupica, & Lovinger, 2003). The specific neuroanatomy found to subserve this executive control may constitute neurocognitive functions that are affected in this popu-lation and are thus potential targets for intervention.
Acknowledgments
The assistance of Alan Jones, Dr. Kevin Murphy, and Dr. Boris Kotchoubey is gratefully acknowledged. This study was sup-ported by NIDA Grant RO1 DA14100.
Reprint requests should be sent to Hugh Garavan, School of Psychology, Trinity College Dublin, Dublin 2, Ireland, or via e-mail: [email protected].
The data reported in this experiment have been deposited with the fMRI Data Center (www.fmridc.org). The accession number is 2-2006-121BN.
Note
1. The thresholded clusters were required to have a mini-mum size of 174Al. As this can result in clusters that are quite large and that envelop different anatomical regions, we then separated the clusters by Brodmann’s areas resulting in clus-ters that were both functionally and anatomically defined. It is for this region that the clusters entered into the cluster-level statistical analyses were smaller than the 174-Al criterion. How-ever, in an effort to reduce the number of clusters analyzed within a BA, we restricted the final cluster-level analysis to those Brodmann’s areas that contained at least 100Al of acti-vated voxels. In doing so, we excluded from the cluster analyses just 386Al of voxels from 12 Brodmann’s areas.
REFERENCES
Beauchamp, M. H., Dagher, A., Aston, J. A., & Doyon, J. (2003). Dynamic functional changes associated with cognitive skill learning of an adapted version of the Tower of London task.Neuroimage, 20,1649–1660. Buchel, C., Coull, J. T., & Friston, K. J. (1999). The
predictive value of changes in effective connectivity for human learning.Science, 283,1538–1541. Collette, F., & van der Linden, M. (2002). Brain imaging
of the central executive component of working memory.
Neuroscience and Biobehavioral Reviews, 26,105–125. Compton, B. J., & Logan, G. D. (1991). The transition
from algorithm to retrieval in memory-based theories of automaticity.Memory & Cognition, 19,151–158. Cox, R. W. (1996). AFNI: Software for analysis and visualization
of functional magnetic resonance neuroimages.Computers and Biomedical Research, 29,162–173.
Debaere, F., Wenderoth, N., Sunaert, S., Van Hecke, P., & Swinnen, S. P. (2004). Changes in brain activation during the acquisition of a new bimanual coordination task.Neuropsychologia, 42,855–867.
Fassbender, C., Murphy, K., Foxe, J. J., Wylie, G. R., Javitt, D. C., Robertson, I. H., & Garavan, H. (2004). A topography of executive functions and their interactions revealed by
functional magnetic resonance imaging.Brain Research, Cognitive Brain Research, 20,132–143.
Frutiger, S. A., Strother, S. C., Anderson, J. R., Sidtis, J. J., Arnold, J. B., & Rottenberg, D. A. (2000). Multivariate predictive relationship between kinematic and functional activation patterns in a PET study of visuomotor learning.
Neuroimage, 12,515–527.
Gerdeman, G. L., Partridge, J. G., Lupica, C. R., & Lovinger, D. M. (2003). It could be habit forming: Drugs of abuse and striatal synaptic plasticity.Trends in Neurosciences, 26,184–192.
Hester, R., Foxe, J. J., Molholm, S., Shpaner, M., & Garavan, H. (2005). Neural mechanisms involved in error processing: A comparison of errors made with and without awareness.
Neuroimage, 27,602–608.
Holm, S. A. (1979). Simple sequentially rejective multiple test procedure.Scandinavian Journal of Statistics, 6,65–70. Jueptner, M., Stephan, K. M., Frith, C. D., Brooks, D. J.,
Frackowiak, R. S. J., & Passingham, R. E. (1997). Anatomy of motor learning. 1. Frontal cortex and attention to action.Journal of Neurophysiology, 77,1313–1324. Kaufman, J. N., Ross, T. J., Stein, E. A., & Garavan, H.
(2003). Cingulate hypoactivity in cocaine users during a GO-NOGO task as revealed by event-related functional magnetic resonance imaging.Journal of Neuroscience, 23,7839–7843.
Kelly, A. M., & Garavan, H. (2005). Human functional neuroimaging of brain changes associated with practice.
Cerebral Cortex, 15,1089–1102.
Klapp, S. T., Boches, C. A., Trabert, M. L., & Logan, G. D. (1991). Automatizing alphabet arithmetic: II. Are there practice effects after automaticity is achieved?Journal of Experimental Psychology: Learning, Memory, and Cognition, 17,196–209.
Ku¨bler, A., Murphy, K., & Garavan, H. (2005). Cocaine dependence and attention switching within and between verbal and visuospatial working memory.European Journal of Neuroscience, 2,1984–1992.
Ku¨bler, A., Murphy, K., Kaufman, J., Stein, E. A., & Garavan, H. (2003). Co-ordination within and between verbal and visuospatial working memory: Network modulation and anterior frontal recruitment.Neuroimage, 20,1298–1308. Logan, G. D. (1988). Toward an instance theory of
automatization.Psychological Review, 95,492–527. Logan, G. D. (2002). An instance theory of attention
and memory.Psychological Review, 109,376–400. Logan, G. D., & Klapp, S. T. (1991). Automatizing alphabet
arithmetic: I. Is extended practice necessary to produce automaticity?Journal of Experimental Psychology: Learning, Memory, and Cognition, 17,179–195. Newell, A., & Rosenbloom, P. S. (1981). Mechanisms of
skill acquisition and the law of practice. In J. R. Anderson (Ed.),Cognitive skills and their acquisition(pp. 1–55). Hillsdale, NJ: Erlbaum.
Palmeri, T. J. (1997). Exemplar similarity and the development of automaticity.Journal of Experimental Psychology: Learning, Memory, and Cognition, 23,324–354. Poldrack, R. A., & Gabrieli, J. D. E. (2001). Characterizing
the neural mechanisms of skill learning and repetition priming: Evidence from mirror reading.Brain, 124,67–82. Poldrack, R. A., Sabb, F. W., Foerde, K., Tom, S. M., Asarnow,
R. F., Bookheimer, S. Y., & Knowlton, B. J. (2005). The neural correlates of motor skill automaticity.Journal of Neuroscience, 25,5356–5364.
Schneider, W., & Chein, J. M. (2003). Controlled and automatic processing: Behavior, theory, and biological mechanisms.Cognitive Science, 27,525–559.
Schneider, W., & Shiffrin, R. M. (1977). Controlled and automatic human information processing: I. Detection, search and attention.Psychological Review, 84,1–190. Shadmehr, R., & Holcomb, H. H. (1997). Neural correlates
of motor memory consolidation.Science, 277,821–825. Shiffrin, R. M., & Schneider, W. (1977). Controlled and
automatic human information processing: II. Perceptual learning, automatic attending, and a general theory.
Psychological Review, 84,127–190.
Stein, J. F. (1989). Representation of egocentric space in the posterior parietal cortex.Quarterly Journal of Experimental Physiology, 74,583–606.
Stroop, J. R. (1935). Studies of interference in serial verbal reactions.Journal of Experimental Psychology, 18,643–662.
Talairach, J., & Tourneaux, P. (1988).Co-planar stereotaxic atlas of the human brain.New York: Thieme.
Tiffany, S. T. (1990). A cognitive model of drug urges and drug-use behavior: Role of automatic and nonautomatic processes.Psychological Review, 97,147–168.
Toni, I., Rowe, J., Stephan, K. E., & Passingham, R. E. (2002). Changes of cortico-striatal effective connectivity during visuomotor learning.Cerebral Cortex, 12,
1040–1047.
Wagner, A. D., Maril, A., Bjork, R. A., & Schacter, D. L. (2001). Prefrontal contributions to executive control: fMRI evidence for functional distinctions within lateral prefrontal cortex.Neuroimage, 14,1337–1347.