Automated Processing of Shoeprint
Images Based on the Fourier Transform
for Use in Forensic Science
Philip de Chazal,
Member,
IEEE, John Flynn, and Richard B. Reilly,
Senior Member,
IEEE
Abstract—The development of a system for automatically sorting a database of shoeprint images based on the outsole pattern in response to a reference shoeprint image is presented. The database images are sorted so that those from the same pattern group as the reference shoeprint are likely to be at the start of the list. A database of 476 complete shoeprint images belonging to 140 pattern groups was established with each group containing two or more examples. A panel of human observers performed the grouping of the images into pattern categories. Tests of the system using the database showed that the first-ranked database image belongs to the same pattern category as the reference image 65 percent of the time and that a correct match appears within the first 5 percent of the sorted images 87 percent of the time. The system has translational and rotational invariance so that the spatial positioning of the reference shoeprint images does not have to correspond with the spatial positioning of the shoeprint images of the database. The performance of the system for matching partial-prints was also determined.
Index Terms—Image processing, forensic science, shoeprint, shoe wear, partial-print, automated system, Fourier transform.
æ
1
I
NTRODUCTIONS
HOEmarks—the mark made by the outside surface of the sole of a shoe (the outsole)—are distinctive patterns that are often found at crime scenes. Shoe marks can be broadly broken into two classes: 1) shoe impressions which contain 3-dimensional information (e.g., shoe impression at the beach) and 2) shoeprints which contain 2-dimensional information (e.g., shoeprint on a floor). Shoe marks are common at crime scenes and are believed to be present more frequently than fingerprints [1]. In [2], a study of several jurisdictions in Switzerland revealed that 35 percent of crime scenes had shoeprints usable in forensic science, while in [3], Girod found that 30 percent of all burglaries provide usable shoeprints.Shoe marks provide valuable forensic evidence. In many instances, shoe marks can be positively identified as having been made by a specific shoe to the exclusion of all other shoes. The identification is based on the physical match of random individual characteristics the shoe has acquired during its life. The evidence provided by a positively identified shoe mark is as strong as the evidence from fingerprints, tool marks, and typewritten impressions [1].
In other instances, the detail retained in a shoe mark may not be sufficient to uniquely identify an individual shoe but nevertheless it is still very valuable. Due to the wide variety of shoes available on the market, with most having distinctive outsole patterns, this implies that any specific model of shoe will be owned by a very small fraction of the
general population [1]. If the model of a shoe can be determined from its mark, then this can significantly narrow the search for a particular suspect.
An image of a shoe mark can be obtained using photography, gel, or electrostatic lifting or by making a cast when the impression is in soil. Subsequently, in the forensic laboratory, the image of the shoe mark is compared with the shoeprints and shoe impressions of known shoe samples. A process of detection and recovery of footwear impression evidence and of comparison of the impressions with suspect shoes is described in [1].
The photograph of the impression or of the lifted impression or cast can be subsequently scanned and a digital image produced. Forensic analysis requires compar-ison of this image against specific databases. These databases include:
1. Database of marks made by shoes currently and previously available on the market and
2. Database of shoe marks found at other crime scenes. Comparing crime scene shoe mark images to databases is currently a laborious task and it is commonly manually conducted by searching paper catalogues or computer databases. Due to the time consuming nature of the task, shoe mark evidence is not used as frequently as it could be. For example, in 1993, only 500 of 14,000 recovered prints in The Netherlands were identified [4]. Thus, computer-based methods that reduce the operator effort for this task offer great benefit to forensic scientists.
A number of semiautomatic methods have been pro-posed to assist forensic laboratories making these database comparisons [3], [5], [6]. In all methods, an operator uses a palette of basic shapes to build a model of a shoeprint pattern. The basic shapes model visible characteristics of the outsole, such as wavy patterns, concentric circles, logos, etc. This information is then used to match the print against a database of shoeprints that have been similarly modeled. . The authors are with the Department of Electronic and Electrical
Engineering, University College Dublin, Belfield Dublin 4, Ireland. E-mail: {philip.dechazal, john.flynn}@ee.ucd.ie, richard.reilly@ucd.ie. Manuscript received 22 Oct. 2003; revised 13 July 2004; accepted 19 July 2004; published online 14 Jan. 2005.
Recommended for acceptance by M. Pietikainen.
For information on obtaining reprints of this article, please send e-mail to: tpami@computer.org, and reference IEEECS Log Number TPAMI-0334-1003.
“erosion” and “dilation” operators applied to a digital image of the shoeprint. The spatial position of these shapes is recorded. For each type of geometric shape, the two-dimensional Discrete Fourier transform (DFT) was used to determine the spatial frequency of the shapes. The advan-tage of the DFT is that it is invariant to translations. Matching was achieved with a neural network processing the Fourier transform coefficients. Bouridane et al. [7] and Alexander et al. [8] utilize fractals to represent the shoe-prints and a mean square noise error method for determin-ing the final match. The performance of our system is compared to Bouridane et al.’s system in Section 7.
2
A
IMThe aim of this study was to develop an automated system to aid forensic scientists in rapidly identifying the model of a shoe from an image of a shoeprint (note that the system is not designed to match an image of a shoeprint to an individual shoe). In response to a reference shoeprint image, the fundamental system requirement was that it sort a database of shoeprint images based on the outsole pattern so that images from the same pattern group as the reference image were likely to be at the start of the list. Other required properties of the system were that it functioned with a minimum of user intervention, provide consistent output (i.e., the output of the system should be independent of the operator), and be able to properly process shoeprints irrespective of the spatial positioning of the image relative to the shoeprints images recorded in the database.
In Section 3, the shoeprint database used throughout this study is discussed. Section 4 presents the methodology adopted for this ranking problem. Tests and experiments that were performed are described Section 5. The results of optimizing and validation of the ranking performance of the system are presented in Section 6. Section 7 discusses the significant results and a comparison is made with previously published work. Some conclusions are drawn in Section 8.
3
S
HOEPRINTD
ATABASEPaper images of 1,276 shoeprints were provided by the Forensic Science Laboratory, Garda Headquarters, Dublin, Ireland. The paper images were collected in Dublin during January 2001. Shoeprints were obtained by inviting partici-pants to tread on an inkpad and then stamp on a 35cm by 22cm piece of paper. Information pertaining to the shoe, including manufacturer, style, size, and age of the shoe wearer, was also recorded with each shoeprint. No informa-tion regarding the identity of the wearer was recorded. The
group contained shoeprints obtained from a right-shoe and with 80 percent or more of the outsole print clearly identifiable to the observer. There were 914 prints in this group. The second group contained 322 shoeprints. These shoeprints were from right-shoes with less than 80 percent of the full-print clearly identifiable. The third group contained 26 shoeprints, which were from left shoes. There were 14 shoeprints in the fourth group and these prints were of poor quality due to acquisition errors such as smudging of the ink and double impressions (due to the user stamping twice on the paper).
3.1 Full-Prints
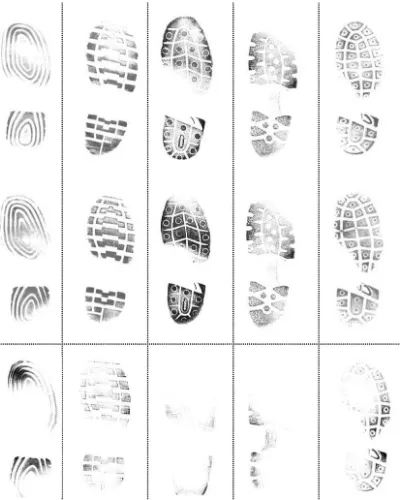
The first group was then further grouped into pattern categories. All shoeprints belonging to the same pattern category had identical outsole patterns (ignoring the effects of shoe wear, shoe size, and image quality). A panel of three human observers independently established the pattern category of each print. It was established that there were 578 separate pattern categories with 438 categories containing one shoeprint and 140 categories containing two or more shoeprint examples of the pattern. In order to test the system, a minimum of two prints from each category were required to ensure that, for each print used to test the system, there was at least one matching print. The 476 shoeprint images (the “full-prints”) comprising the latter 140 categories were the first set of prints used for validating the system. Fig. 1 shows images of shoeprints with other examples from the same pattern category. Fig. 2 shows the breakdown of the full-print group by size. The largest pattern category contained 11 examples.
3.2 Partial-Prints
Partial shoeprints are much more common at crime scenes than full shoeprints and can provide valuable forensic evidence. Hence, the performance of a system in processing partial images of shoeprints is of considerable interest.
3.2.1 Acquired Partial-Prints
3.2.2 Generated Partial-Prints
Due to the small numbers of partial-prints and because it was of interest to understand how the quality of the partial-print affected performance, extra partial partial-print images (see Fig. 3) were generated from each full-print image. They were generated as follows: The origin point was identified for each shoeprint and was the point that approximately divided the shoe into a left and right half and split the heel from the toe and midsole area. Four images containing approximately 50 percent of a full image (half-print images) were generated by splitting the image either vertically or horizontally about the origin point and assigning the pixel values on one side of the dividing line to the background color (white). Four other partial-print images containing approximately 25 percent of a full image (quarter-print images) were generated by splitting the image both vertically and horizontally about the origin point and assigning the pixel values in three of the four resulting quadrants to the background color.
4
M
ETHODSA flow diagram of the shoeprint analysis system developed in this study is shown in Fig. 4. The system processes a reference shoeprint image and produces a transformed image. The transformed reference image is then compared to each transformed database image and a measure of similarity calculated. Next, the similarity of the reference image to each pattern category is determined. On the basis of the similarity measures, the database categories are sorted so that categories that most likely have an identical pattern to the reference shoeprint appear at the start of the sorted list. The forensic scientist then reviews the sorted categories and identifies an occurrence (if one exists) of a database category that has the same pattern as the reference shoeprint image. If a matching database category is identified, then the associated database fields can provide shoe manufacturer style information of the input shoeprint. The frequency of the pattern category can also be established and the database queried to determine the average age of the typical wearer.
The Fourier transformation (FT) is a key element within the sorting algorithm, due to having translation and rotation properties as follows [9].
Let the imagef2be a rotated and translated replica of the imagef1with rotationand translationðx0; y0Þ, then
f2ðx; yÞ ¼f1ðxcosþysinx0; xsinþycosy0Þ:
[image:3.612.51.251.72.322.2]ð1Þ
[image:3.612.318.489.72.224.2]Fig. 1. Examples of five shoeprint pattern categories. The top row shows examples of images of full-prints and the bottom row shows examples of images of partial-prints.
[image:3.612.86.490.612.734.2]Fig. 2. Breakdown of the shoeprint pattern categories in the full-print group by category size: For example, “76(2)” indicates 76 pattern categories each containing two examples.
According to the Fourier translation and rotation proper-ties, the corresponding FT, F1, and F2 (with frequency variablesand) will be related by
F2ð; Þ ¼ej2 xð 0þy0ÞF1ðcosþsin;
sinþcosÞ: ð2Þ
The power spectral density (PSD) function can be calculated by squaring the absolute value of the FT. For imagesf1andf2, the corresponding PSD functionsM1andM2will be related by
M2ð; Þ ¼jF2ð; Þj2¼M1ðcosþsin;
sinþcosÞ: ð3Þ
Thus, the PSD is invariant to translation and the rotation of an image results in the same rotation of the PSD.
4.1 Image Transformation
The shoeprint images are subjected to many distortions in both the imprint process and the scanning process. Distortion of a database image relative to a matching reference image includes rotation, translation, and scanning noise, such as scanning borders. The aim of the transforma-tion stage is to reduce these distortransforma-tions and transform the image file into a standard format for further processing by the pattern matching stage. The steps of the image transformation are shown in Fig. 5 and are described below.
Scan Border. The paper images of the shoeprints were too large to be scanned using an A4-scanner and, hence, could only be digitized by an A3 or rotary-scanner. A rotary-scanner was used in this study and resulted in a black border around the shoeprint image being created in the digitizing process. This was removed by finding the
largest connected component of black value pixels at edge of the image. All the pixels in this component were then set to white. The images differ slightly in size and were approximately 4,200 pixels in the vertical dimension and 2,700 pixels in the horizontal dimension. The size of the image was then standardized to 4;0964;096 pixels by trimming the vertical dimension and padding the horizon-tal dimension with white pixels. This size was chosen for ease of processing in subsequent stages.
Downsample. There was an oversampling of the pertinent information content in the patterns in the images. To reduce the computational load, the images were down-sampled to 6464, 128128, 256256, and
512512 images. Experiments were conducted to deter-mine the best down-sample size.
Backgroup noise removal. To remove noise associated with scanning the white regions, all pixel values less than, or equal to the value 5 were set to 0 (pure white).
[image:4.612.78.491.76.213.2]Transformation. A zero-mean shoeprint image was calculated by subtracting the mean pixel value of the shoeprint image from each pixel value. The two-dimen-sional discrete Fourier transform (DFT) of the zero-mean shoeprint image was then calculated. The magnitudes of the DFT coefficients were squared to yield a periodogram estimate of the power spectral density (PSD). The coeffi-cients of the PSD represent the levels of different spatial frequencies within the entire image. These spatial frequen-cies in turn provide a description of the pattern contained in the image. The PSD coefficients are independent of the horizontal and vertical position of the shoeprint in the digital image. Finally, the log value of all the PSD coefficients was calculated and these values were used in all subsequent processing.
[image:4.612.66.508.79.362.2]Fig. 4. Shoeprint analysis system.
Rotation. The orientation of the digital image of the shoeprint was variable. Observation of the database images revealed that the rotation required to overlay one image on another was variable but never exceeded 30 degrees. To compensate for the variable orientation of the reference image to the database images, a set of PSDs corresponding to the rotation of the reference shoeprint image in one degree increments in the range of 30 degrees was calculated. The PSDs of the rotated reference images were calculated directly from the PSD of the unrotated reference image by using (3).
Masking—low-frequency removal. Some prints showed a gray-level variance across the prints which was due to differences in contact across the shoe as the print was taken. This variance appeared in the PSD as a very low-frequency component. To remove this unwanted component, only frequencies that had a Euclidean distance from the zero spatial-frequency point greater than 0.1 cycles-per-inch were selected for further processing (Fig. 5—masking operation). This threshold was chosen as a balance between capturing the useful very low-frequency components of a shoeprint pattern (e.g., the components corresponding to the outline of the outsole) and the removing of the frequency components due to gray-level variation caused by shoe contact.
Masking—high-frequency removal. Only PSD coeffi-cients that had a Euclidean distance less than a predeter-mined threshold from the zero spatial-frequency point were selected for further processing (Fig. 5—masking operation). The high-frequency masking operation served two purposes. First, it removed the high-frequency detail from the analysis. It was felt that the high-frequency detail would primarily contain information that was unique to the shoe (e.g., outsole scuffs and nicks) and it was desired to discard this information to focus on the underlying shoeprint pattern. Second, by applying a circular mask, spatial frequencies in all directions are treated equally by the pattern matching stage described in the next section. The thresholds trialed were 0.0625, 0.125, 0.25, and 0.5 cycles-per-pixel. Experiments were conducted to determine the best threshold.
4.2 Pattern Matching
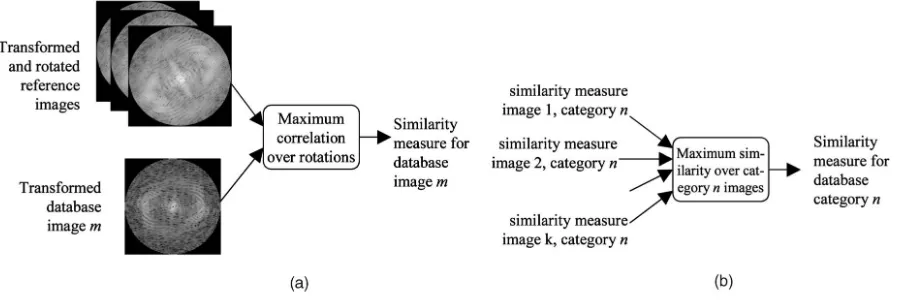
In order to compare a reference image with a database image, a measure of similarity between the images is required. For each database image a similarity measure with the input image is calculated, as shown in Fig. 6a. A similarity measure
is then determined for each database pattern category by choosing the highest similarity value amongst the shoeprint examples in the pattern category. The similarity measures calculated for each pattern category are then used to sort the database pattern categories from those most similar to least similar to the reference image. The images from the sorted database categories are then shown to a human expert who selects the final database pattern category that matches the reference image (if a match exists).
The similarity measure considered in this project was the 2D correlation coefficient [10]. For images f1 and f2, the correlation coefficient (r) is calculated using
^
f
f1ðx; yÞ ¼½f1ðx; yÞ mean fð Þ1 =std fð Þ1 ^
f
f2ðx; yÞ ¼½f2ðx; yÞ mean fð Þ2 =std fð Þ2
r¼ 1
P2
XP
i¼1
XP
j¼1 ^
f
f1ðx; yÞff^2ðx; yÞ;
ð4Þ
wheremeanðfÞis the average pixel value of imagef,stdðfÞis the standard deviation of the pixel values of imagef, and the size of the image is PP pixels. One advantage of this similarity measure is that it is invariant to the average and the standard deviation of the pixel values of an image. When comparing two PSDs with this similarity measure, the comparison will be invariant to the average gray-scale value of the two original prints and also invariant to the contrast between the highlights and shadows of the prints.
To calculate the measure of similarity between a reference and a database shoeprint image, the correlation coefficient of the PSD of each rotated image derived from the reference image with the PSD of the database image was calculated. The measure of similarity between the two shoeprints was the maximum value of the individual correlations.
4.3 Measuring System Performance
The system is designed to sort pattern categories of database shoeprint images in response to a reference image and present images of the sorted categories to the user for final evaluation. A system with higher performance will present fewer nonmatching categories before a matching category than a system with lower performance. In view of this, two performance metrics were defined as follows.
[image:5.612.63.512.72.223.2]4.3.1 Average Match Score (AMS)
The first metric of system performance measured the average percentage of the database categories that needed to be compared before a correct match was established. It was determined for each trial by counting the number of nonmatching shoeprint categories that occurred before the first correctly matched database category and expressing this as a percentage of the number of database categories. This was then averaged over different trials of the system. Fig. 7 depicts the process for determining the rank of the first match. This metric provides a summary performance figure and was used to compare different configurations of the system.
4.3.2 Cumulative Match Characteristic (CMC)
The second performance assessment characterizes the system performance by answering the question “what is the probability of a match if I look at the firstn percent of the database pattern categories?” The probability of a match (the cumulative match score) was estimated by determining the proportion of times during trials of the system a database pattern appeared in the first n percent of the sorted patterns and was from the same pattern category as the reference image. This performance characteristic is reported as cumulative match scores that are plotted on a graph [11]. The horizontal axis of the graph is the percentage of shoe categories reviewed and the vertical axis is the probability of a match.
5
E
XPERIMENTSExperiments were conducted to optimize the system using the full-prints. Once optimized, an assessment of the performance of the system using the full and partial-prints was conducted.
5.1 System Optimization
The system performance, in terms of average match score (AMS) at different image resolutions and masking radii, was determined and the best combination selected. For these experiments, the full-prints were used to test the algorithm using a cross-validation scheme (see Fig. 7). In turn, each of the 476 shoeprint images was withdrawn from the full database and became the reference image to the system. The remaining 475 shoeprint images became the system database images. The system was then used to match the reference image to database images. This protocol was conducted 476 times with a different image used as the input each time. By using the full-print images, it ensured that at least one matching print existed in the database for each withdrawn shoeprint image.
5.2 System Assessment
With the system optimized, a detailed look at the perfor-mance of the system processing full and partial-prints was determined. Using the full-prints, the cumulative match characteristic (CMC) was determined. Following this, the CMC and AMS was determined for processing the partial-print images. For this experiment, the 63 partial-partial-print images were employed. In turn, each of the 63 shoeprint images was used as the reference image to the system and matched to the 476 full-print images.
[image:6.612.78.497.71.283.2]A further set of tests was performed using the generated partial-print images. For each of the full-print images, eight partial-print images were generated (see Fig. 3) and the CMC and AMS determined for each type of generated partial-print image. To assess performance, the same cross-validation protocol as was used for the grouped full-prints was used (see Fig. 7).
6
R
ESULTS6.1 System Optimization
Table 1 shows the AMSs for different masking radii and image resolutions when using the full-prints. Best perfor-mance was achieved at an image resolution of 512 by 512 and a masking radii of 0.125 cycles-per-pixel. The perfor-mance of this configuration is determined in more detail in the next section.
6.2 Performance of the Optimized System
A baseline performance level was established by repeatedly determining the system performance when the list of database images was determined by random allocation (i.e., a random permutation of the sequence 1:475). One thousand trials were performed and the results averaged. Fig. 8 shows the CMCs for the full-prints, the acquired partial-prints, and baseline. Fig. 9 shows CMCs for the acquired partial-prints,
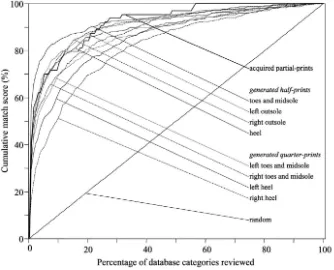
the eight types of generated partial-prints, and the baseline. Key values of these plots are shown in Table 2a.
The theoretical maximum performance for this system is a curve that passes through the upper left corner (the point (0, 100)) of Figs. 8 and 9. A system with observed greater performance will generate a curve to the left and above that for a control.
Table 2b shows the AMS for full-prints, the acquired partial-prints, and the generated partial-prints.
7
D
ISCUSSION7.1 Optimization of the System
As shown in Table 1, both masking radius and image resolution impact system performance. The lowest perfor-mance was achieved when processing the lowest resolution images (64 by 64 pixels) and using the smallest masking radius (0.0625 cycles per pixel). This configuration resulted in an average of 40.8 percent of the patterns needing to be scanned before a correct match was made. This represented a modest improvement on what was obtained with random allocation (50 percent).
At all resolutions greater than 64 by 64 pixels increasing the masking radius beyond a threshold degraded the performance. This supported our original hypothesis that the important pattern information is contained in the low-frequency portions of the spectrum.
The highest performance was achieved when processing the 512 by 512 pixel images and using a masking radius of 0.125 cycles-per-pixel. This configuration resulted in an average of 4.4 percent of the patterns requiring review before a correct match was made. Although it was not
TABLE 1
[image:7.612.119.455.458.730.2]Average Match Scores (%) for the System Processing the Full-Print Images for Different Masking Radii and Image Resolutions
attempted in this study, it is possible that performance may further improve if images with greater resolution are used.
7.2 Optimized System Performance: Full-Prints As expected, the cumulative probability of obtaining a correct match for random allocation was directly related to the number of shoe categories displayed, as is demonstrated by the straight-line for “random” in Figs. 8 and 9.
When processing full-prints, the system sorts the database images so that the first image is from the same pattern category as the reference image 65 percent of the time. This is a significant result considering that random sorting of the database images results in the first sorting pattern matching the reference image 0.7 percent of the time. The reference image was matched to a database category within the first 5 percent of the sorted database categories 87 percent of the time. On average, 4.4 percent of the database categories required review before a matching pattern category was found. In contrast, 50 percent of the sorted database categories required review before a successful match using random allocation.
7.3 Optimized System Performance: Partial-Prints The system was not able to sort database images as successfully in response to partial-prints as it achieved when processing full-prints. This is apparent by noting that the curve for the partial-prints is below and to the right of the full-print curve in Fig. 8. On average, 8.2 percent of the sorted database categories were reviewed before a success-ful match was made. Hence, even with partial-prints, the system is able to save the forensic scientist a considerable amount of searching.
7.4 Optimized System Performance: Generated Partial-Prints
[image:8.612.117.451.71.341.2]Results show that the system was more successfully able to process half-print images than quarter-print images. This can be easily verified by the observation that the curves for the half-print images in Fig. 9 are above and to the left of the quarter-print curves. This result was as expected as the half-print images contained more of the shoehalf-print. Partial-half-print images containing the toe and midsole sections of a shoeprint
Fig. 9. Cumulative match characteristic (CMC) of the optimized system matching images of the acquired prints and the generated partial-prints. Also shown is the CMC when pattern categories are determined by random allocation.
TABLE 2
were the easiest partial-prints to match. Here, 55 percent of the first-ranked database categories matched the reference image. Seventy eight percent of reference images were matched within the first 5 percent of the sorted database pattern categories. On average, 7.4 percent of the database categories were compared before a successful match with the reference image was made. Partial-prints of heels did not match as successfully as partial-prints of the toe and midsole.This result may be explained by the observations that 1) the heel section of an outsole wears more rapidly than other parts of the outsole, and 2) patterns of toe and midsole sections of outsoles are more variable than patterns of heels. The system performance when processing partial-print images of the left and right outsoles was approximately the same.
The quarter-print images containing the right side of the heel were proven to be the most difficult to match with the CMC of this configuration, shown below and to the right of all other CMCs in Fig. 9. With these prints, on average 18.5 percent of the sorted database categories, were compared before a match to the reference image was made. A possible explanation of this is that all shoeprints under test were prints from right shoes and the right side of the heel tends to wear much more rapidly than other areas of the outsole. This wear results in less distinct tread patterns for the right side of the heel. While this ranking performance is well below the ranking performance achieved with images of full-prints (4.4 percent), it is still much higher than the ranking performance achieved with random allocation (50 percent).
The results for the acquired partial-print images were similar to the results obtained with the generated left and right outsoles images.
7.5 Comparison with Other Systems
The shoeprints used in this study were acquired under very controlled circumstances and tend to be of higher quality than those normally obtained at crime scenes. In our experience, photographs of shoe impressions or shoeprints obtained from crime scenes do not have the same contrast as the shoeprints used in this study. As a consequence, the results obtained probably represent the upper performance limit of our shoeprint analysis system. Notwithstanding, the results obtained here demonstrate that an automated approach can dramatically reduce the time spent comparing reference shoeprints to database shoeprints. Additional improvements to the system may be achieved by using other forensic knowledge to aid the search. For example, the investigating officer may know that the suspect is in a particular age group. This knowledge could be used weight the rankings so that shoeprint patterns belonging to that age group appear first.
There is no study to our knowledge that can be directly compared to the results of this study. The nearest is the study performed by Alexander et al. [8] who looked at the problem of identifying a shoeprint from 145 full-print images. They report an accuracy of 88 percent in correctly identifying the image when the spatial and rotational position of the image exactly matched the matching database image. The perfor-mance of their system was sensitive to translation and rotational inaccuracies. Introducing a nine degree rotation caused accuracy to drop to less than 50 percent, while introducing a 13 pixel translation resulted in accuracy dropping to less than 10 percent. The authors included a copy of the shoeprint image to be matched in their database. By doing this, the authors were undertaking a much more
simple matching problem than the problem considered here, as any similarity measure should achieve a high matching score when matching an image to itself.
7.6 Utility of the System
The significance of the system presented in this study is that it provides an automated method for helping forensic scientists in rapidly identifying the model of a shoe from a shoeprint. The system has been found to work successfully with partial-prints. It is also removes operator bias. If implemented, the databases of such a system would need to be constantly updated as shoeprint information is only useful for a limited period. This is a result of the limited life of a pair of shoes and the constant fashion change in the shoe wear industry.
The amount of wear of the outsole of a shoe will also influence the performance of the system. The outsole pattern of a heavily worn shoe will be much less obvious and this will degrade the ability of our system to find a matching pattern. Extensions to this project include adapting the image transformation stage so that the system can process other forms of shoeprint images, including photographs of shoe marks and lifted impressions.
8
C
ONCLUSIONThis study developed a system that automatically sorts a database of shoeprint pattern categories in response to a reference shoeprint to accelerate the human observer identification of the tread pattern of the reference shoeprint image. Tests of the system have shown that when a reference image of a full-shoeprint is presented to the system, the first sorted image correctly matched the reference image 65 per-cent of the time. There is an 87 perper-cent probability that a matching image will be found within the first 5 percent of the sorted database patterns. The system was also able to successfully sort database images in response to reference partial-prints. The system has translational and rotational invariance so that the spatial positioning of the reference shoeprint image and the database shoeprint images need not correspond.
A
CKNOWLEDGMENTSThe authors would like to thank the Forensic Science Laboratory, Dublin for providing the database and for valuable input into the project. The authors would also like to thank B. O’Mullane for his contributions. The support of the Informatics Research Initiative of Enterprise Ireland is gratefully acknowledged.
R
EFERENCES[1] W.J. Bodziak,Footwear Impression Evidence Detection, Recovery and Examination,second ed. CRC Press, 2000.
[2] A. Girod, “Presentation at the European Meeting for Shoeprint/ Toolmark Examiners,” 1997.
[3] A. Girod, “Computer Classification of the Shoeprint of Burglar Soles,”Forensic Science Int’l,vol. 82, pp. 59-65, 1996.
[4] Z. Geradts and J. Keijzer, “The Image Data REBEZO for Shoeprint with Developments for Automatic Classification of Shoe Outsole Designs,”Forensic Science Int’l,vol. 82, pp. 21-31, 1996.
[5] N. Sawyer, “’SHOE-FIT’ A Computerised Shoe Print Database,”
pp. 1090-1104, Oct. 2000.
Philip de Chazal(M’94) received the BE degree in electronic engineering and the MBiomedE and PhD degrees in biomedical engineering from University of New South Wales, Sydney, Aus-tralia in 1989, 1995, and 1999, respectively. He was a research scientist for the CSIRO, Sydney, from 1990 to 1992, a biomedical engineer for MedCare Systems, Sydney from 1993 to 1999, and a research fellow at University College Dublin, Ireland, from 1999 to 2003. He is cofounder and currently the chief technical officer of BiancaMed, Ireland, a company providing intelligent computer-based analysis of medical signals. His research interests include signal processing and pattern recognition for biomedical applications and image processing for multimodal applications. Dr. de Chazal is a member of the IEEE Engineering in Medicine and Biology Society. He is a reviewer for the
IEEE Transactions on MultimediaandIEEE Transactions on Biomedical Engineering. He is a member of the IEEE.
John Flynn’sbiography and photo were unavailable at publication time.
for Psychiatric Research, New York. He is a member of the IEEE Engineering in Medicine and Biology Society and Signal Processing Society. He is a committee member of the IEEE United Kingdom and Republic of Ireland Section. Dr. Reilly is an associate editor forIEEE Transactions on Multimediaand also a reviewer forIEEE Transactions on Neural Systems and Rehabilitation Engineeringand theIEEE Transac-tions on Industrial Electronics. He is a senior member of the IEEE.