Development of a rig to study model
pile behaviour under repeating
lateral loads
&1 Muhammad ArshadMSc, ME
PhD Candidate, Department of Civil, Structural and Environmental Engineering, Trinity College Dublin, Dublin, Ireland
&2 Brendan C. O’KellyPhD, FTCD, CEng, CEnv, MICE
Associate Professor, Department of Civil, Structural and Environmental Engineering, Trinity College Dublin, Dublin, Ireland
1 2
This paper deals with an important problem of the effect of repeating lateral loads on large-diameter monopile foundations for offshore wind turbine (OWT) structures. The cycles of typically low-amplitude repeating lateral loads and moments generated by various environmental factors are resisted by horizontal earth pressures mobilised in the soil surrounding the pile. Laboratory testing on reduced-scale piles is an efficient and economical way to investigate such pile–soil behaviour. This paper presents the development of a new mechanical loading system to apply many thousands of repeating cycles of lateral load in different forms to a 1g model, with full control provided over the loading direction (i.e. one-way or two-way lateral loading), amplitude, frequency and waveform shape (e.g. sinusoidal, square or haversine). Compared with equivalent setups employing pneumatic or hydraulic actuators, the new loading system is able to produce similar performance at lower cost and also provides more control over the waveform shape. A programme of lateral load tests, each involving many thousands of load cycles, was performed on a rigid model pile installed in dry sand beds to demonstrate some of the main capabilities of the new system.
Notation
D pile outer diameter
Dl spring extension
d50 mean particle size e
^
non-dimensional parameter for moment arm
EI pile bending stiffness
g gravitational constant
H applied lateral load
H^ non-dimensional parameter for lateral load
L pile embedment length
M bending moment applied at pilehead M^ non-dimensional parameter for bending
moment
Nh vertical distance between loading node position and the bottom of chain loop when sliding node is at its mean position pa atmospheric pressure
c9 effective unit weight
h ^
non-dimensional parameter for pile rota-tion from its initial alignment
1. Introduction
At present, there is some uncertainty in the literature regarding the change in stiffness of the soil surrounding a monopile under long-term repeated lateral loading. In the case of rigid monopiles, the soil would fail rather than the piles failing by plastic hinges. For sandy soil, the API (2010) and DNV (2011) models always predict degradation of the absolute secant stiffness under repeated lateral loading, irrespective of the density state or number of load cycles. Achmuset al. (2009) reported degradation of the absolute secant stiffness for medium dense and dense sands with increasing number of load cycles. However model studies on monopiles in loose (Bhattacharya
et al., 2011; LeBlancet al., 2010) and dense (Cue´llaret al., 2012,
stiffness (cyclic) increases with the number of load cycles. LeBlanc (2009), Bhattacharya and Adhikari (2011) and Cue´llar
et al. (2012) suggested that the stiffness increase occurs as a
result of densification of the soil next to the pile. There are also differences of opinion regarding the rate of accumulation of lateral strain in the surrounding soil for piles subjected to one-way or two-one-way lateral loading. Under one-one-way loading, the magnitude of the load wave fluctuates between zero and the applied maximum load amplitude. In response, the pile tends to deflect (rotate) only in one direction from its initial (vertical) alignment. Under two-way loading, the pilehead is sequentially pulled in opposite directions, such that the pile tends to deflect (rotate) alternately in opposing directions from its mean vertical position (Penget al., 2011). For two-way lateral loading, the accumulative tilt of the pile usually follows the direction of the first quarter of the loading cycle (Long and Vanneste, 1994; Rosquoetet al., 2007). Some researchers (LeBlancet al., 2010; Klinkvort and Hededal, 2013; Zhuet al., 2013) have shown that two-way lateral loading produces higher rates of accumulation of lateral strain in the surrounding soil compared with one-way lateral loading. Long and Vanneste (1994), Lin and Liao (1999) and Penget al.(2011) were of the opinion that the opposite was the case. The findings of such studies awere based on results generated by experimental loading systems having limited operational capabilities, with all of these studies considering only one waveform shape (i.e. sinusoidal) and for a particular loading frequency.
In reality, the pile deflection (rotation) response under lateral loading arises from the soil behaviour and also from dynamic pile–soil interaction, which are dependent on the loading history and applied loading conditions. There are many examples of structures supported on pile foundation systems for which lateral loading may prove to be critical over gravitational forces. For instance, in a study related to offshore wind turbines (OWTs) supported by monopile foundation systems in the North Sea, it was found that the magnitude of dynamic lateral loading can be up to 66% of the gravitational loads (Byrne and Houlsby, 2003). This scenario is more onerous when the lateral loading is continuously repeating at varying frequency, load amplitude and direction (Arshad and O’Kelly, 2013). At some critical level of load amplitude and/or frequency, these repeating lateral loads can cause significant reductions in the lateral soil resistance for a monopile foundation structure (Ramakrishna and Rao, 1999). The required lateral load-carrying capacity of the pile depends on the type and purpose of the structure in which it is an integral part. The rotation of the pile from its initial (vertical) alignment must be limited in the range 0?17–2?0
˚
(Leeet al., 2010, 2011) for proper functioning of different types
of supported structures.
Under field loading, the proper operation of OWTs supported by monopile foundation systems generally necessitates limiting
the lateral pile deflection at seabed level to 0?11 m (Malhotra, 2011) or the pile rotation from its initial (vertical) alignment to 0?5
˚
(LeBlanc, 2009).The foundation response under repeated lateral loading is a major design consideration. An economical design procedure can be efficiently and confidently applied if experimental verifications are achievable, either through full-scale testing or model studies. In situ full-scale pile tests are expensive and time-consuming to perform. Hence the literature contains many reduced-scale model studies performed in the field (e.g. Gavin and O’Kelly (2007) and Igoe et al. (2013)) or in the laboratory employing different types of loading systems to validate numerical predictions and design rules, such as given by Achmuset al.(2009).
Model pile tests involving static lateral loading have been performed to determine ultimate lateral capacity (e.g. Reese
et al. (1974) and Ramakrishna and Rao (1999)) and to
investigate the influence of the piles’ cross-section and rigidity on lateral load-carrying capacity (Mahmoud and Burley, 1994;
Raoet al., 1998; Raongjant and Meng, 2011). Some of these
studies have focused on investigating the behaviour of tapered piles (Du¨hrkopet al., 2010; El Nagger and Wei, 1999), finned piles (Peng et al., 2011) and (or) piles subjected to many thousands of load cycles in the lateral direction (Du¨hrkopet al., 2010; LeBlancet al., 2010; Penget al., 2011; Cue´llaret al., 2012). Model testing results can be directly applied once the soil at site is the same for the scaled tests. The best way is to link the model tests with element test parameters. For example, Lombardiet al. (2013) linked their model tests with threshold strains that can be obtained from standard element tests such as the resonant column.
The reliability (acceptability) of laboratory model studies depends, among other factors, on the accuracy and efficiency of the loading system in simulating the actual field loading conditions through certain scaling laws. In the case of model studies for offshore structures, the experimental loading system must be capable of simulating the environmental loading, particularly that acting in the horizontal direction, with varying amplitude and frequency.
2. Forcing frequency, fundamental natural frequency and resonance
It is essential to consider the fundamental natural frequency of a wind-turbine structure for a proper description/evaluation of its dynamic behaviour. In the literature related to OWTs, the term ‘cyclic loading’ is generally used in connection with the harmonic variation of the repeating load wave in time domain. When the forcing (loading) frequency gets closer to the structure’s natural frequency, the repeating load can be termed as dynamic load, which tends to excite the structure dynami-cally, leading to resonance. Dynamic effects can be considered simplistically in a linear system through dynamic amplification factors. However this approach is strictly not valid for an OWT foundation structure owing to various non-linear ties in the system, as shown experimentally by Bhattacharyaet al.(2012), although the error may not be great. Hence, engineers need to adjust the cyclic load results to take into account the dynamic behaviour of the system.
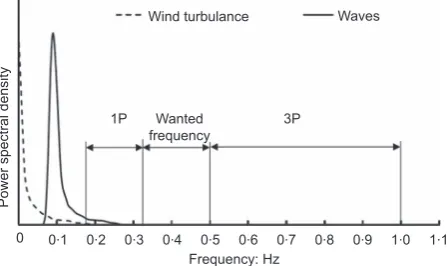
Major sources of forcing frequencies for OWTs are wind, wave, current and any out-of-line imbalances of the rotating electromechanical parts installed in the turbine’s nacelle-rotor system (Bhattacharyaet al., 2011). For a typical 5 MW OWT having rotational speeds of typically 10–20 rpm for the main rotor shaft, the first excitation frequency 1P (i.e. corresponding to one full revolution) occurs in the range 0?17–0?33 Hz. For a three-bladed turbine, the blade passing frequency of typically 0?5–1?0 Hz is denoted as the 3P frequency, which is heavily excited on account of the impulse-like excitation arising from the blades passing by the tower. In the North Sea environment, excitation from wind and waves usually occurs with frequen-cies of 0?01 and 0?1 Hz, respectively, as illustrated in Figure 1.
The region of ‘wanted frequency’ (i.e. between the 1P and 3P ranges) identified in this figure is referred to as the ‘soft–stiff’ zone; the region before the 1P range as the ‘soft–soft’ zone and
the region after the 3P range as the ‘stiff–stiff’ zone. ‘Soft–soft’ and ‘stiff–stiff’ zones are unsuitable for the design solution. The structure is considered too flexible if its natural frequency falls within the ‘soft–soft’ zone and too rigid (heavy and expensive) within the ‘stiff–stiff’ zone. Another important reason for avoiding the ‘soft–soft’ frequency region is that wind turbulence and wave excitation frequencies usually fall within this zone (LeBlanc, 2009). For wind-turbine structures, this invariably leads to the development of higher stresses in the support structure/foundation, which is an unfavourable situation in considering fatigue life. This dynamic interaction of the soil–pile system produces greater strain in the surrounding soil and may lead to higher stiffness degradation (Achmuset al., 2009) or soil stiffening (Cue´llaret al., 2012; LeBlancet al., 2010). It is therefore important to ensure that excitation frequencies having high energy levels do not coincide with the support structure’s natural frequency. DNV (2011) suggests that the natural frequency of the structure should not come close to the 1P or 3P frequency regions, remaining away from these zones by a margin of at least 10%. A detailed insight into the dynamic of the soil-structure behaviour for OWTs is given by Adhikari and Bhattacharya (2011, 2012), Bhattacharya et al. (2011, 2012, 2013), Bhattacharya and Adhikari (2011) and Lombardiet al. (2013).
3. Scaling issues for model testing
To relate the results from reduced-scale physical modelling with the corresponding results of the prototype system, certain conditions must be met to preserve constitutive and kinematic similarities between the systems. Examples of the derivation of scaling laws for offshore monopile foundations have been reported by Lai (1989), Muir Woodet al.(2002), LeBlancet al. (2010), Bhattacharya et al. (2011) and Cue´llar et al. (2012). However, the satisfaction of such scaling conditions for similarity in granular soils is not trivial (Bhattacharya et al., 2011; Donget al., 2001), especially for a complex problem such as OWTs where one has dynamics, aerodynamics, soil– structure interaction and fluid flow around the foundations.
Among other technical difficulties of performing physical tests with geomaterials, the direct scaling of the particle grain dimensions is particularly problematic as it may introduce undesired forces into play unless a certain minimum ratio is maintained between mean grain size (d50) and a characteristic dimension (pile diameter in the present investigation) of the model (Sedranet al., 2001; Verdureet al., 2003). Moreover, constitutive laws describing the load–deformation behaviour of the soil are stress-level dependent, which implies that for 1g
conditions, homologous points of the soil foundations for the model and prototype may experience different deformational responses. For instance, the load–deformation response of structures founded on sand is governed, among other factors, by the magnitude of mean effective confining pressure, which is
Wind turbulance Waves
3P Wanted
frequency 1P
0
Power spectral density
0.9 0.8 0.7 0.6 0.5 Frequency: Hz 0.4
0.3 0.2
[image:3.595.54.278.597.730.2]0.1 1.0 1.1
different for the model and prototype. Laboratory model tests on sand at 1g (i.e. at low confining pressure) are generally performed at a lower density index compared with full-scale in order to match the angle of shearing resistance and take into account the dilation (LeBlancet al., 2010). Similitude relation-ships in the form of non-dimensional parameters (NDPs) can be applied to relate the results for the model with the prototype, and vice versa (see LeBlancet al., 2010). These NDPs consider the pile’s geometry, material properties, applied loading and its lateral displacement (rotation) response, as given in Table 1, with due consideration of the pile tip displacement under repeating lateral loads.
4. Existing systems for lateral loading of model piles
Over the past two decades, a number of different systems have been developed to apply monotonic and (or) repeating lateral loads in performing laboratory studies on model piles. The methods of operation of these systems can be broadly categorised as mechanical (Raoet al., 1998), electromechanical (Basack, 2005; LeBlanc, 2009; LeBlancet al., 2010), pneumatic and (or) hydraulic (Chandrasekaranet al., 2010; El Nagger and Wei, 1999; Kumar and Rao, 2012). As discussed and presented in these experimental studies, the loading systems have varying complexities in their operation and capabilities to simulate the field conditions. For instance, some loading systems (Rao et al., 1998; El Nagger and Wei, 1999) can apply only monotonic lateral loading in a certain range. Others can apply one-way repeating load and have been used in studies to apply limited numbers of lateral loading cycles (Chandrasekaran et al., 2010; Kumar and Rao, 2012; Qin, 2010). A few systems (Basack, 2005; LeBlanc et al., 2010; Peng et al., 2006) have been designed to apply many thousands of load cycles for one-way and two-one-way loading conditions, with sufficient control provided over the load amplitude and frequency. A detailed discussion of existing loading systems is beyond the scope of this paper and the reader is referred to the publications cited above for further information.
The novel rig for model pile studies developed at Trinity College Dublin (TCD) which is presented in this paper is not only capable of applying many thousands of load cycles under one-way and two-way loading conditions but is also efficient in generating different waveform shapes within the frequency range compatible with offshore environmental loading.
5. Development of the new rig for model
pile studies
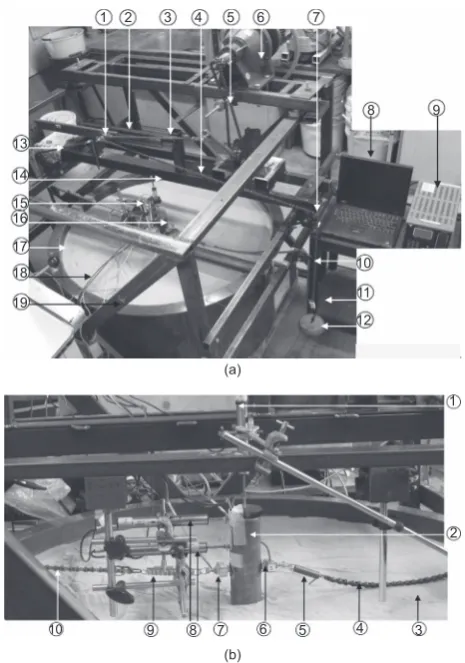
5.1 General layout and components
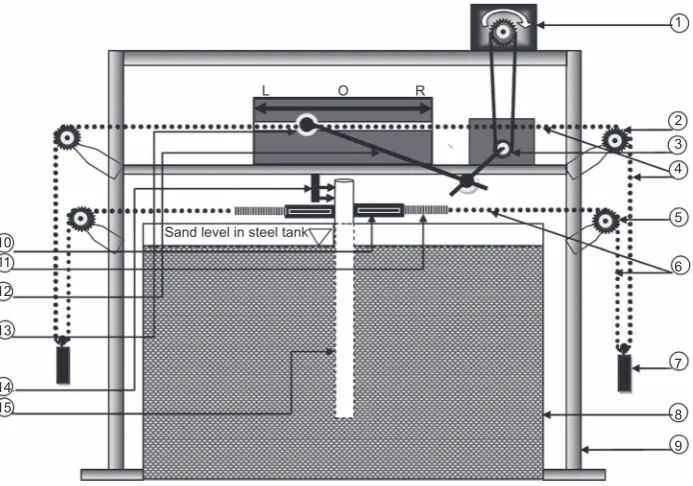
Figure 2 shows the general layout of the new rig that is used to apply repeating lateral loads to the head of an instrumented model pile. The pile (identified as (15) in the figure) is installed in a soil bed that is contained in a steel tank (8) having an internal diameter of 0?95 m, overall depth of 0?60 m, and which is reinforced by box sections welded around its outer perimeter. The driving torque to the loading system is provided by a three-phase 1?5 kW AC motor (1), which torques gearing through a system of metallic chain linkages – that is, a bicycle chain. The drive motor and gearing are mounted on a reaction frame (9). The steel tank and soil bed within are isolated from the reaction frame and hence any vibrations produced by the operation of the mechanical loading system. In the present set-up, the chains had a pitch length of 12?7 mm, pin length of 6?0 mm and roller diameter of 7?2 mm. The speed control unit for the motor provides control over the speed of rotation of the motor shaft and hence the loading frequency. Rotation of gearx(3) moves the sliding node (13) to-and-fro between points L and R. The sliding node is connected to gearxby an articulated arm (12). The travel range of the sliding node is controlled by adjusting the location of the pivot point (pin joint) and the arm length. Referring to the right-hand side (RHS) of the schematic arrangement shown in Figure 2: one end of the RHS chain is connected to the sliding node and its other end to the RHS of the pilehead by way of a miniature load cell (10) and spring (11). As shown in the figure, this chain loops, engaging with 80 mm diameter upper (2) and lower (5) cogs, from which a dead weight (7) can be attached to a specific chain linkage by way of a load hanger. Under two-way loading, a similar arrangement is used to apply and measure the loading to the left-hand side (LHS) of the pilehead. The loading system can be operated from a very low frequency of 0?01 Hz up to 2?0 Hz by simply adjusting the speed of rotation of the drive motor. Another determining factor in achieving the desired frequency is the stiffness of the spring(s). Loading frequencies in the range 0?1–2?0 Hz have been used by different researchers (Cue´llaret al., 2012; LeBlanc et al., 2010; Lombardiet al., 2013; Peng et al., 2011) in performing model studies at 1gon monopile foundations for OWTs.
5.2 Working mechanism
The working mechanism of the new loading system depends on the required loading scheme, with the range of possibilities described in the next section of the paper. Referring to
Moment loading
M^~ M
L3Dc’
Horizontal loading
H^~ H
L2Dc’
Rotation
h ^
~ ffiffiffiffiffiffip
a
Lc’ r
Moment arm (i.e. vertical distance between initial level of sand bed surface and point of horizontal load application)
e
^
~ ffiffiffiffiffiffi M HL r
Figure 3, repeating lateral loading behaviour is obtained through the transfer of loads (supplied by the loading weights and hangers) from the upper chain segments to the lower chain segments, and vice versa; that is, tension forces are generated in the upper and lower chains alternately. The RHS lower chain segment (6) goes from the spring (8) to the bottom of the chain loop, passing over the lower cog (5). The RHS upper chain segment (4) goes from the sliding node (2) to the bottom of the chain loop, passing over the upper cog (3).
In addition to the applied hanger loads and speed of the drive motor, other governing inputs for the loading scheme are as outlined below.
(a) The locations of the attachment points for the RHS and (or) LHS load hangers along the chain loops, with reference to the centres of the upper cogs; that is, the loading node position on the vertical chain-loop length. Referring to Figure 3, the vertical chain-loop length (VCLL) equals the horizontal chain-loop length (HCLL) when the sliding node (2) is at its mid-range (i.e. point O), which represents zero wave amplitude. The loading node position determines the loading impact on the pilehead; that is, the duration and portion of the load cycle for which a particular chain segment (upper or lower) remains under the action of the applied tension force. For example, with the loading node
position for the RHS chain loop located on the upper chain segment (4), the tension force applied by the loading weight and hanger (7) remains in the upper RHS chain segment for a greater proportion of the load cycle. When the sliding node (2) moves to locationR, the bottom section of the RHS chain loop is at its lowest position.
(b) The stiffness of the connecting spring(s) (8) which contributes to generating the required waveform shape. If the spring(s) is removed (i.e. lower chain segment(s) connected directly to the pilehead), then an almost square wave form is produced by the loading system owing to the abrupt action and interaction of the loading to the pilehead. In other words, for a particular load amplitude, the loading frequency is also determined by the response time (stiffness) of the spring(s).
A synchronised adjustment/correlation between the range of node movement (i.e. points L to R in Figure 3) and elongated length(s) of the spring(s) under loading to get the desired loading scheme is a difficult task. This is more onerous for two-way than one-two-way loading. This task was completed incremen-tally by experimental trials.
For demonstration purposes, Tables 2 and 3 show the relative positions of the sliding node and loading hangers at interim stages for loading under one-way and balanced two-way sinusoidal load waves.
10 Sand level in steel tank
L O R
11
12
13
14 15
1
6
7
8
9 2
3
4
[image:5.595.121.468.148.391.2]5
Figure 2.Schematic diagram of the TCD rig for model pile studies, set up for two-way lateral loading. Key: 1, drive motor; 2, upper right cog; 3, gear x; 4, upper right chain segment; 5, lower right cog; 6, lower right chain segment; 7, right loading weight with
1
2
L
HCLL
O R
8 9
3
4
5
6
7 VCLL
Nh
10 Loading node position
Bottom of chain loop when sliding node is at
[image:6.595.94.482.143.370.2]midrange (point O)
Figure 3.Schematic diagram of new loading system, set up for two-way lateral loading. Key: 1, slot for sliding node; 2, sliding node; 3, upper right cog; 4, upper right chain segment; 5, lower
right cog; 6, lower right chain segment; 7, right loading hanger with weights; 8, right spring; 9, right load cell; 10, pilehead; HCLL and VCLL, horizontal and vertical chain-loop lengths, respectively
Stage
Sliding node position
Spring response
Relative position of chain and load hanger
Load cell
measurement Remark
1 L O R D
l
Time
Load
Load cycle starts from maximum applied load amplitude, with lower right chain segment under tension.
2 L O R
Time
Load
Extension in spring (and hence tension force) reduces as sliding node moves towards the LHS.
3 L O R D
l = 0
Time
Load
With the sliding node at point L, the spring has returned to its original length and the hanger load tends to shift onto the upper right chain segment.
4 L O R
Time
Load
As the sliding node moves from points L to R, the spring extends and the load applied to the pilehead increases again.
5 L O R
Time
Load
When the sliding node reaches point R, the spring is under maximum elongation and the maximum lateral load is applied to the pilehead, completing one full sinsuoidal cycle.
[image:6.595.57.553.459.743.2]5.2.1 One-way sinusoidal load wave
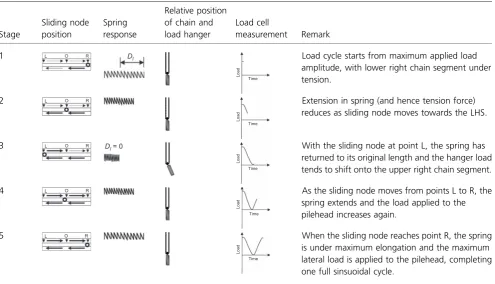
For this configuration, only one load hanger with dead weights is attached to the chain system (RHS chain in the scenario considered below (see Table 2 and Figure 2)). During set up, with the sliding node positioned at point L, the RHS load hanger is attached to the chain link at the bottom of the RHS chain loop system. The range of sliding node movement (i.e. distance between points L and R) is adjusted such that it equals the extension (Dl) of the RHS spring, located between the lower chain segment and load cell, in response to the applied load. For instance, suppose that at the start of the load cycle considered, the sliding node is at its extreme right position (point R), in which case the RHS spring is elongated by lengthDlunder the force applied by the RHS load hanger with weights (see stage 1, Table 2). At this stage, the pilehead experiences the maximum lateral tension force. With the movement of the sliding node from point R towards point L (stage 2, Table 2), the extension in the spring reduces, such that when the sliding node is positioned at its extreme left position (point L), the spring experiences no extension (stage 3, Table 2); in other words, no lateral load is applied to the pilehead. At this moment, the tension force in the upper right chain segment due to the load hanger with weights is completely carried by the torque of the drive motor. With the sliding node moving from point L to R, the spring extends and the lateral load applied to the pilehead increases again, reaching its maximum value when the sliding node reaches point R (stage 5, Table 2), thereby completing one full sinusoidal cycle. For one-way sinusoidal wave loading, the vertical distance between the loading node position and the bottom of the chain loop remains practically zero when the sliding node is at its mean position.
5.2.2 Balanced two-way sinusoidal load wave
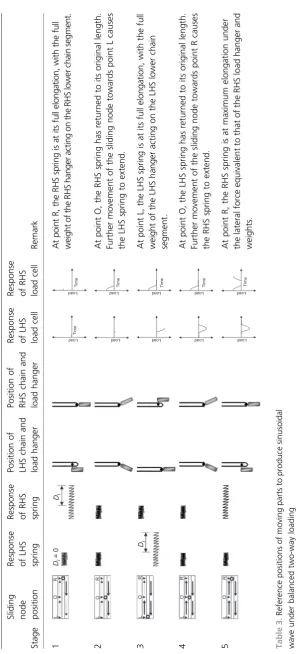
For this configuration, load hangers with weights are attached to the RHS and LHS chains (see Table 3 and Figure 3). During set-up, with the sliding node located at point O, the load hangers with weights are attached at the bottom of the RHS and LHS chain loop systems. As long as the sliding node remains in the right-half span of node movement (i.e. between points O and R), the RHS lower chain segment and spring remain under varying tension force, with the pile tending to deflect towards the right side from its initial (mean) vertical position. Similarly, when the sliding node moves within the left-half span, a varying tension force acts in the LHS lower chain segment and spring, with the pile tending to deflect towards the left side. During set-up, the half-span length is adjusted such that it equals the extension (Dl) of the spring at the maximum load amplitude; that is, under the action of lateral force equivalent to load hanger with weights. With the sliding node located at pointR, the maximum tension force acts in the RHS lower chain segment (see stage 1, Table 3). As the sliding node moves away from pointR, the lateral tension force applied to the RHS of the pilehead reduces, with the force shifting to the RHS upper chain segment. On reaching point O (i.e. at midrange: stage 2, Table 3), the RHS lower chain
segment applies zero force to the pilehead. As the sliding node moves within the left-half span, the tension force in the LHS lower chain segment increases. When the sliding node reaches pointL, the pilehead experiences the maximum load amplitude acting towards the LHS (stage 3, Table 3). A full sinusoidal cycle is completed when the sliding node reaches pointRagain; that is, the maximum load amplitude is achieved in the RHS lower chain segment (stage 5, Table 3).
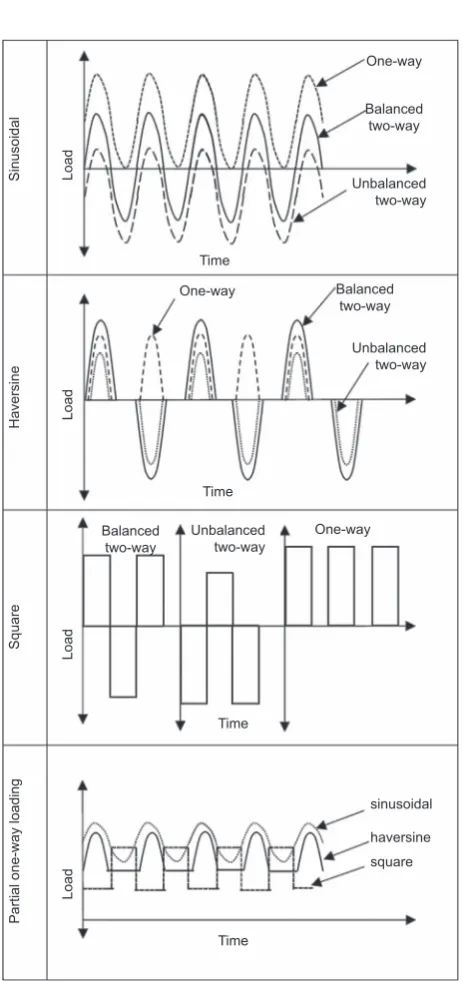
5.3 Capabilities of the new loading system
The new loading system was designed to generate many thousands of load cycles of varying load amplitude, frequency and waveform shape. The load amplitude depends on the magnitudes of the weights applied to the RHS and (or) LHS load hangers. Referring to Figure 3, the required waveform shape (i.e. sinusoidal, square, haversine etc.) can be obtained by adjusting the length Nh(i.e. distance between the loading node position and the bottom of the chain loop when the sliding node is at midrange) and (or) by using springs with different stiffnesses. Control over the frequency of the load wave is primarily achieved by adjusting the speed of the drive motor and to a less extent by the spring stiffness. The loading scheme can be arranged to produce
(a) one-way loading, achieved when only one load hanger with dead weights is used, with the magnitude of the load wave fluctuating between zero and the applied maximum load amplitude
(b) one-way loading, with the magnitude of the load wave fluctuating between the applied maximum load amplitude and some value above the zero value, hereafter termed as partial one-way loading
(c) balanced two-way loading when equal weights are applied to the two load hangers
(d) unbalanced two-way loading when unequal weights are applied to the two hangers.
For balanced or unbalanced two-way loading of any waveform shape, the RHS load cell shows zero force when the LHS load cell measures a tension force, and vice versa. The resultant shape of the load wave for the whole system is obtained by superimposing the load–time curves measured by both load cells. For demonstration purposes, different shapes of repeating lateral load waves were generated in the present study for maximum load amplitudes in the range of 30–45% of the pile’s ultimate lateral load-carrying capacity under monotonic loading. These percentages correspond to the fatigue and serviceability limit states respectively (DNV, 2011). The experimental scenarios considered in this paper are presented qualitatively in Figure 5.
applied as a sinusoidal wave and the load to its RHS could be applied as a haversine wave. Such scenarios can be generated by using springs having different elastic moduli and (or) changing the locations of the attachment points for the load hangers on the chains.
6. Experimental demonstrations
An extensive programme of testing was performed on a model pile installed in dry, dense sand beds to demonstrate the performance and repeatability of the new loading system in producing one-way and two-way sinusoidal lateral loading conditions. These tests were performed in a constant tempera-ture environment at 20¡2
˚
C.6.1 Model pile
The 540 mm long model pile was manufactured from brass tubing having outer and inner diameters of 53?0 and 51?4 mm, respectively, which produced a bending stiffness (EI) of 4?33 kN m2. Its lower end was closed using 3 mm thick brass plate to represent a fully plugged tubular pile. The model pile was instrumented over its embedment length using eight strain gauges of type TML-PL-10-11, manufactured by Tokyo Sokki Kenkyujo Co. Ltd, Japan. These gauges were arranged in a line at 50 mm centre-to-centre spacings and attached to the pile’s outer wall surface using an epoxy adhesive, with the lowermost gauge located at a distance of 20 mm above the pile tip. They had gauge length and width dimensions of 10 and 5 mm, respectively, a gauge factor of 2?07 and full Wheatstone Bridge circuit configuration. A thin cover layer of epoxy was applied over the attached gauges, and also locally on their lead connections, in order to provide protection from potential damage during handling of the pile, its installation in the sand beds and under repeated lateral loading of the pile.
6.2 Sand characterisation and sand bed preparation,
including pile installation
In the present investigation, the model pile was partially embedded in dense sand beds contained within the 0?95 m diameter by 0?6 m deep steel tank. The sand beds were prepared using dry sub-angular to sub-angular medium silica sand having ad50of 0?27 mm, coefficient of uniformity of 1?85 and coefficient of curvature of 1?0. The sand was air-pluviated into the tank, raining in six layers, each 100 kg in mass, which produced deposited layers of approximately 90 mm in thickness. After depositing the first two layers, the model pile was aligned vertically at the centre of the tank, with temporary support to the pilehead provided by tensioned horizontal steel wires which were secured radially to the wall of the tank. Four more layers of sand were deposited, bringing the sand bed to its full depth of 0?54 m, and producing a pile embedment length of 0?36 m. This installation scenario represents a ‘wished in place’ closed-ended pile. The test sand had minimum and maximum dry density values of 1388 and 1662 kg/m3, respectively, which equate to maximum and minimum void ratio values of 0?92 and 0?60 respectively. This preparation technique produced sand beds with a
dry density of 1577¡6 kg/m3for the 15 sand beds prepared in the present investigation (density index range of 70–74%). At maximum density, the dry sand had a peak friction angle of 39
˚
, determined from 60 mm square shearbox tests. Geometrically the pile set-up, with a pile embedment length to outer diameter (L/D) ratio of 6?8, is categorised as a short rigid pile, which encompasses L/Dratios of up to 10 (Penget al., 2011; Tomlinson, 2001). This scenario typically represents a field monopile (made of steel) for an OWT foundation system at 1/100 scale. Regarding possible boundary effects associated with the relative dimensions of the tank and model pile under the repeated lateral loading scenarios investigated in the present study: (a) a soil cushion (sand in our case) having a depth of three to four times the pile diameter located below the pile tip is considered sufficient to absorb the vertical stress field (LeBlancet al., 2010); (b) with the ratio of the tank diameter to pile diameter greater than 17, side wall boundary effects were not significant (Davie and Sutherland, 1978; Raoet al., 1996).6.3 Instrumentation and data acquisition
Figure 5 illustrates the arrangement of load cells and linear-variable displacement transducers (LVDTs) used to measure the load–displacement (rotation) behaviour of the model pile. The two horizontally mounted miniature load cells (series LCM-703, range of ¡250 N, manufactured by Omega Engineering Ltd, UK) recorded the magnitudes of the repeating lateral loads applied to the pilehead by the loading system. Along the section of the pile protruding above the sand bed surface, two horizontally mounted LVDTs, one located 50 mm directly above the other, recorded lateral displacements of the pilehead (see Figure 4). This arrange-ment allowed the determination of the rotation (tilt) of the rigid pile from its initial vertical alignment, the depth to its point of rotation along its embeded length and its lateral displacement at the sand bed surface level. A third LVDT, mounted coaxially with the pile, measured the pile’s vertical displacement response. The LVDTs (series TR-0050, manufactured by Novotechnik Ostfildern, Germany) had a maximum range of 50 mm with linearity up to 0.075%. Figure 6 shows photographs of the partially embedded instrumented pile undergoing two-way lateral loading applied by the newly developed apparatus.
The outputs from the load cells, LVDTs and strain gauges were recorded by a System-7000 data acquisition system (Vishay Precision Group, USA). This system simultaneously scanned each sensor/channel at ten data points/s, with a measurement accuracy of¡0?05% full-scale and 0?5 microstrain resolution. An ethernet interface allowed flexible positioning of the sensor displays on a laptop computer in numeric and graphic modes using Windows-based ‘Smart-Strain’ software.
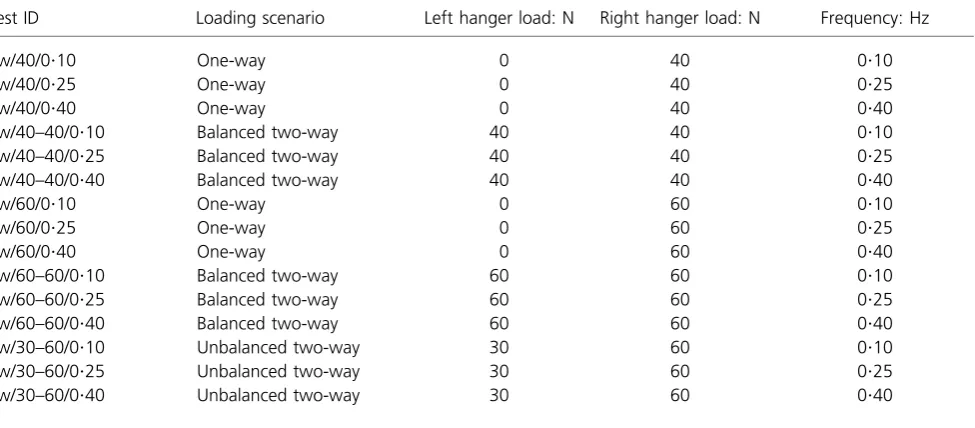
6.4 Testing programme
beds, prepared as described in Section 6.2. In these tests, the effects of different loading scenarios (balanced and unbalanced two-way and one-way loading), load amplitudes and frequen-cies were investigated, each test involving 6000 lateral loading cycles applied to the pilehead. The different tests are listed in Table 4 and identified as follows: loading direction (1w, one-way; 2w, two-way)/load amplitude (N)/frequency (Hz). For example, 1w/40/0?1 indicates one-way lateral loading having an amplitude and frequency of 40 N and 0?1 Hz; 2w/30–60/0?4
indicates two-way lateral loading, 30 N in one direction, 60 N in the other (i.e. unbalanced), at a frequency of 0?4 Hz.
The ultimate static lateral load-carrying capacity of the model pile set-up at the same embedment depth of 0?36 m in the sand beds was estimated at 140 N, which corresponds to a point on the load–rotation curve where, apparently, plastic deformation of the surrounding sand starts. At this point, the pile had rotated 1?5
˚
from its initial vertical alignment and its lateral deflection at the sand bed surface level was approximately 7 mm; that is, 0?13 times the pile outer diameterD.In previous studies of rigid model piles performed at 1g, the ultimate load-carrying capacity was usually estimated for lateral pile deflections of 0?1–0?2D(Cue´llaret al., 2012; Penget al., 2011; El Sawwaf, 2006) occurring at the
sand bed surface. In the present study, the load amplitudes of 40 and 60 N investigated correspond to the fatigue and serviceability limit states, respectively, in relation to the pile’s ultimate static lateral load-carrying capacity of 140 N (DNV, 2011).
6.5 Experimental results
Figures 7 to 9 present the experimental results in terms of the pile’s rotation from its initial vertical alignment against number of load cycles. The same pile, embedment depth and sand bed preparation method were used for all of the tests. The experimental data are discussed below in terms of the effects of loading direction, amplitude and frequency. Using similitude relationships in the form of non-dimensional parameters (e.g. see Table 1), such data can be used to interpret the prototype behaviour. As the model pile was closed-ended and experienced no vertical loading other than self-weight, its settlement was negligible, with a maximum of 0?2 mm vertical movement recorded after 6000 cycles of lateral loading.
The structural behaviour of a rigid (mono) pile under lateral loading is defined by its rotation as a rigid body. However, since the pile’s stiffness is not infinite, and provided a high-resolution data-acquisition system such as the System-7000 is used, some bending strains at microstrain level can be measured by strain gauges bonded to the pile shaft. These data are usually employed for evaluations/interpretations related to the pile’s bending moment profile, the lateral soil reaction and deformations
Sinusoidal
Haversine
Square
Partial one-way loading
Load
Load
Load
Load
Time
One-way
One-way
One-way Time
Time
Time
Balanced two-way
Balanced two-way
Balanced two-way
Unbalanced two-way
sinusoidal
haversine
square Unbalanced
two-way
[image:10.595.60.292.126.618.2]Unbalanced two-way
Figure 4.Loading scenarios and generated wave shapes
50 mm
90 mm
Sand bed surface level Lower right chain segment Right spring
Right load cell Pilehead
[image:10.595.319.547.147.254.2]LVDTs in horizontal direction LVDT in vertical direction
occurring in the soil strata over the pile embedment length. However, to follow the scope of this paper, data obtained from the 8 strain gauges mounted along the shaft of the model pile over its embedment depth are not included here and will be used in a companion paper.
6.5.1 Effect of loading direction
Figure 7 considers the same load amplitude of 60 N (service-ability limit state) and indicates that the measured angle of rotation of the pile under unbalanced two-way loading was significantly greater compared with balanced two-way loading. Both of these scenarios were more onerous that one-way loading. Similar experimental observations have been reported from 1gtesting of model piles by LeBlanc (2009) and LeBlanc
et al.(2010). For these three loading scenarios, approximately
80% of the accumulated rotation measured at 6000 load cycles (i.e. end of the tests) had occurred by the 500th load cycle (Figure 7). At 500 load cycles, unbalanced two-way loading produced 180% and 75% greater rotation compared with one-way and balanced two-way loading respectively. The corresponding percentages for the 6000th load cycle were 120% and 70%.
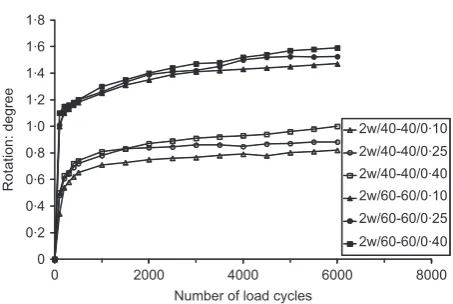
6.5.2 Effect of load amplitude
Figures 8 and 9 indicate that the pile rotation was significantly dependent on the load amplitude (LA), particularly for one-way loading. For example, with LA increased by 50% (i.e. from 40 to 60 N), the pile rotation produced at the 500th load cycle increased by 600% and 100% for one-way and balanced two-way loading respectively. At 6000 load cycles, the corresponding percentages were 400% and 80%. Based on the calculated gradients of the data plots between 2000 and 6000 load cycles in
Figures 8 and 9, it can be interpreted that the sand surrounding the pile tended to reach the elastic shakedown state more rapidly for the lower LA of 40 N, as compared with 60 N.
6.5.3 Effect of loading frequency
In relative terms, the effect of loading frequency was more pronounced for the lower LA of 40 N, as compared with 60 N, particularly for one-way loading. For example, between the 500th and 6000th load cycles under one-way loading, the pile rotation for 0?4 Hz was approximately 75% greater compared with 0?1 Hz (Figure 8). At the higher LA of 60 N, the corresponding figure was approximately 10%. Under balanced and unbalanced two-way loading, the respective figures were approximately 20% and less than 10% (Figure 9). The increase in pile rotation was not proportionall to the increase in LF; for example, under one-way loading, the LF increments from 0?1 to 0?25 Hz and 0?1 to 0?4 Hz produced increases in pile rotation of 40% and 60% respectively (Figure 8). Under balanced two-way loading, the increase in pile rotation was considerably lower, with corresponding values of 8% and 22% (Figure 9). For unbalanced two-way loading, the LF range investigated was found to have a negligible effect on the pile rotation response (Figure 7).
In the existing literature, the effect of LF on accumulated pile rotation (deflection) is not clear. Our experimental findings are in broad agreement with Penget al.(2011), who reported that up to a certain limit of LF and for a given LA, pile deflection (lateral response) increased with increasing LF. Other researchers (Giannakos et al., 2012; Kagawa, 1986) have reported that at higher LF, the surrounding soil becomes stiffer and hence lower deformations are expected under long-term repeating lateral loads.
Test ID Loading scenario Left hanger load: N Right hanger load: N Frequency: Hz
1w/40/0?10 One-way 0 40 0?10
1w/40/0?25 One-way 0 40 0?25
1w/40/0?40 One-way 0 40 0?40
2w/40–40/0?10 Balanced two-way 40 40 0?10
2w/40–40/0?25 Balanced two-way 40 40 0?25
2w/40–40/0?40 Balanced two-way 40 40 0?40
1w/60/0?10 One-way 0 60 0?10
1w/60/0?25 One-way 0 60 0?25
1w/60/0?40 One-way 0 60 0?40
2w/60–60/0?10 Balanced two-way 60 60 0?10
2w/60–60/0?25 Balanced two-way 60 60 0?25
2w/60–60/0?40 Balanced two-way 60 60 0?40
2w/30–60/0?10 Unbalanced two-way 30 60 0?10
2w/30–60/0?25 Unbalanced two-way 30 60 0?25
[image:11.595.52.540.144.358.2]2w/30–60/0?40 Unbalanced two-way 30 60 0?40
7. Conclusion
A new loading system has been developed to apply many thousands of repeating lateral load cycles to a 1gmodel, with full control provided over the loading direction (i.e. one-way or two-way), amplitude, frequency and waveform shape (e.g. sinusoidal, square or haversine). The new loading system is easy to operate and can create realistic repeating cycles of lateral loadsing. Hence it is particularly suited to investigations of monopiles for offshore structure foundations. Compared with equivalent
set-ups employing pneumatic or hydraulic actuators, the new loading system is able to produce similar performance at lower cost and also provides more control over the waveform shapes.
A programme of lateral load tests, each involving 6000 load cycles, was performed on ‘wished in place’ rigid model piles installed in dense sand beds. These tests were performed at load amplitudes (LAs) corresponding to the fatigue and serviceability limit states (40 and 60 N, respectively, in the present investigation) to demonstrate some of the main capabilities of the new loading system. The following trends were observed from the experimental data: (a) two-way loading produced significantly greater rotation of the pile from its initial vertical alignment compared with one-way loading; (b) for two-one-way loading, unbalanced loads produced greater pile rotation than balanced loads; (c) the higher LA of 60 N produced significantly greater pile rotation, particularly for one-way loading; (d) the effect of loading frequency was not as
0.0 0.5 1.0 1.5 2.0 2.5 3.0
0 2000 4000 6000 8000
Rotation: degree
Number of load cycles
[image:12.595.59.292.144.476.2]1w/60/0.10 1w/60/0.25 1w/60/0.40 2w/60-60/0.10 2w/60-60/0.25 2w/60-60/0.40 2w/30-60/0.10 2w/30-60/0.25 2w/30-60/0.40
Figure 7.Effect of loading direction on pile rotation for the same load amplitude of 60 N
0 0.2 0.4 0.6 0.8 1.2
1.0 1.4 1.6 1.8
0 2000 4000 6000 8000
Rotation: degree
Number of load cycles
1w/40/0.10
1w/40/0.25
1w/40/0.40
1w/60/0.10
1w/60/0.25
1w/60/0.40
Figure 8.Pile rotation for one-way loading at different load amplitudes and frequencies
(a)
(b)
1 2 3 4 5 6 7
11 10 16
15 14 13
12 17
18
19
8 9
1
6 5 4 3
2
7
[image:12.595.315.547.146.300.2]10 9 8
[image:12.595.318.541.581.730.2]significant as loading direction or LA. From the series of tests performed, it was found that the characteristics of the repeating lateral loads were more pronounced for the model pile’s fatigue limit state than its serviceability limit state. A more comprehensive programme of repeating lateral load tests is required to further understand the physics behind the problem.
Acknowledgement
The first author gratefully acknowledges a postgraduate research scholarship award from Trinity College Dublin.
REFERENCES
Achmus M, Kuo Y-S and Abdel-Rahman K(2009) Behavior of
monopile foundations under cyclic lateral load.Computers
and Geotechnics36(5): 725–735.
Adhikari S and Bhattacharya S(2011) Vibrations of
wind-turbines considering soil-structure interaction.Wind and
Structures14(2): 85–112.
Adhikari S and Bhattacharya S(2012) Dynamic analysis of wind
turbine towers on flexible foundations.Shock and Vibration
19(1): 37–56.
API (American Petroleum Institute)(2010)Recommended
Practice for Planning, Designing and Constructing Fixed Offshore Platforms — Working Stress Design, API RP 2A-WSD (R2010), 22nd edn. API Publishing Services, Washington, DC, USA.
Arshad M and O’Kelly BC(2013) Offshore wind-turbine
structures: a review.Proceedings of the Institution of Civil
Engineers – Energy166(4): 139–152.
Basack S(2005) Development of an apparatus for imparting
lateral cyclic load on model pile foundation. InProceedings of the International Conference on Mechanical Engineering,
Dhaka, Bangladash,paper AM10.
Bhattacharya S and Adhikari S(2011) Experimental validation
of soil-structure interaction of offshore wind turbines.Soil
Dynamics and Earthquake Engineering31(5–6): 805–816.
Bhattacharya S, Lombardi D and Muir Wood D(2011) Similitude
relationships for physical modelling of monopile-supported offshore wind turbines.International Journal of Physical
Modelling in Geotechnics11(2): 58–68.
Bhattacharya S, Cox J, Lombardi D and Muir Wood D(2012)
Dynamics of offshore wind turbines supported on two foundations.Proceedings of the Institution of Civil
Engineers – Geotechnical Engineering166(2): 159–169.
Bhattacharya S, Nikitas N, Garnsey J, Alexander NA, Cox J,
Lombardi D, Muir Wood D and Nash DFT(2013) Observed
dynamic soil–structure interaction in scale testing of offshore wind turbine foundations.Soil Dynamics and
Earthquake Engineering54(2013): 47–60.
Byrne BW and Houlsby GT(2003) Foundations for offshore
wind turbines.Philosophical Transactions of the Royal
Society of London361(1813): 2909–2930.
Chandrasekaran S, Boominathan A and Dodagoudar G(2010)
Experimental investigations on the behaviour of pile groups in clay under lateral cyclic loading.Geotechnical and
Geological Engineering28(5): 603–617.
Cue´llar P, Georgi S, Baeßler M and Rucker W(2012) On the
quasi-static granular convective flow and sand
densification around pile foundations under cyclic lateral loading.Granular Matter14(1): 11–25.
Davie JR and Sutherland HB(1978) Modeling of clay uplift
resistance.Journal of the Geotechnical Engineering Division,
ASCE104(6): 755–760.
DNV (Det Norske Veritas)(2011) DNV-OS-J101: Design of
Offshore Wind Turbine Structures. DNV, Oslo, Norway.
Dong P, Newson TA, Davies MCR and Davies PA(2001) Scaling
laws for centrifuge modelling of soil transport by turbulent fluid flows.International Journal of Physical Modelling in
Geotechnics1(1): 41–45.
Du¨hrkop J, Grabe J, Bienen B, White DJ and Randolph FM(2010)
Centrifuge experiments on laterally loaded piles with wings.
InProceedings of the 7th International Conference on
Physical Modelling in Geotechnics, Zurich, Switzerland (Springman S, Laue J and Seward L (eds)). CRC Press/ Balkema, Rotterdam, the Netherlands, vol. 2, pp. 919–924.
El Nagger MH and Wei JQ(1999) Response of tapered piles
subjected to lateral loading.Canadian Geotechnical Journal
36(1): 52–71.
El Sawwaf M(2006) Lateral resistance of single pile located near
geosynthetic reinforced slope.Geotechnical and
Geoenvironmental Engineering132(10): 1336–1345.
Gavin KG and O’Kelly BC(2007) Effect of friction fatigue on pile
capacity in dense sand.Geotechnical and Geoenvironmental
Engineering133(1): 63–71.
Giannakos S, Gerolymos N and Gazetas G(2012) Cyclic lateral
response of piles in dry sand: finite element modeling and validation.Computers and Geotechnics44(2012): 116–131. 0
0.2 0.4 0.6 0.8 1.0 1.2 1.4 1.6 1.8
0 2000 4000 6000 8000
Rotation: degree
Number of load cycles
2w/40-40/0.10
2w/40-40/0.25
2w/40-40/0.40 2w/60-60/0.10
2w/60-60/0.25
[image:13.595.52.279.145.297.2]2w/60-60/0.40
Igoe D, Gavin K and O’Kelly B(2013) An investigation into the use of push-in pile foundations by the offshore wind sector.
International Journal of Environmental Studies70(5): 777–
791.
Kagawa T(1986) Cyclic and loading-rate effects on pile
responses. InProceedings of the 3rd International Conference on Numerical Methods in Offshore Piling, Nantes, France. Editions Technip, Paris, France, pp. 417–432.
Klinkvort RT and Hededal O(2013) Lateral response of
monopile supporting an offshore wind turbine.Proceedings of the Institution of Civil Engineers – Geotechnical
Engineering166(2): 147–158.
Kumar ND and Rao SN(2012) Lateral load: deflection response
of an embedded caisson in marine clay.Marine
Georesources and Geotechnology30(1): 1–31.
Lai S(1989) Simlitude for shaking table test on
soil-structure-fluid model in 1-g gravitational field.Soils and Foundations
29(1): 105–118.
LeBlanc C(2009)Design of Offshore Wind Turbine Support
Structures — Selected Topics in the Field of Geotechnical Engineering. PhD thesis, Aalborg University, Aalborg, Denmark.
LeBlanc C, Houlsby GT and Byrne BW(2010) Response of stiff
piles in sand to long-term cyclic lateral loading.
Ge´otechnique60(2): 79–90.
Lee J, Kim M and Kyung D(2010) Estimation of lateral load
capacity of rigid short piles in sands using CPT results.
Geotechnical and Geoenvironmental Engineering136(1): 48–56.
Lee J, Kyung D, Hong J and Kim D(2011) Experimental
investigation of laterally loaded piles in sand under
multilayered conditions.Soils and Foundations50(5): 915–927.
Lin SS and Liao JC(1999) Permanent strains of piles in sand due
to cyclic lateral loads.Geotechnical and Geoenvironmental
Engineering125(9): 798–802.
Lombardi D, Bhattacharya S and Muir Wood D(2013) Dynamic
soil–structure interaction of monopile supported wind turbines in cohesive soil.Soil Dynamics and Earthquake
Engineering49(2013): 165–180.
Long JH and Vanneste G(1994) Effects of cyclic lateral loads on
piles in sand.Journal of the Geotechnical Engineering
Division, ASCE120(1): 225–244.
Mahmoud M and Burley E(1994) Lateral load capacity of single
piles in sand.Proceedings of the Institution of Civil
Engineers – Geotechnical Engineering107(3): 155–162.
Malhotra S(2011) Design and construction considerations for
offshore wind turbine foundations in North America. In
Wind Turbines(Al-Bahadly I (ed.)). InTech, Rijeka,
Croatia, pp. 231–264.
Muir Wood D, Crewe AJ and Taylor CA(2002) Shaking table
testing of geotectnical models.International Journal of
Physical Modelling in Geotechnics2(1): 1–13.
Peng J, Clarke B and Rouainia M(2006) A device to cyclic lateral
loaded model piles.Geotechnical Testing Journal29(4): 1–7.
Peng J, Clarke B and Rouainia M(2011) Increasing the resistance
of piles subject to cyclic lateral loading.Geotechnical and
Geoenvironmental Engineering137(10): 977–982.
Qin H(2010)Response of Pile Foundations Due to Lateral Force
and Soil Movements. PhD thesis, Griffith University, Nathan, Australia.
Ramakrishna VGST and Rao SN(1999) Critical cyclic load levels for
laterally loaded piles in soft clays. InProceedings of the International Conference on Offshore and Nearshore
Geotechnical Engineering, Panvil, Mumbai, India(Sing SK and
Lacasse S (eds)). Balkema, Rotterdam, the Netherlands, pp. 301–307.
Rao SN, Ramakrishna VGST and Rao MB(1998) Influence of rigidity
on laterally loaded pile groups in marine clay.Geotechnical
and Geoenvironmental Engineering124(6): 542–549.
Rao SN, Ramakrishna VGST and Raju GB(1996) Behavior of
pile-supported dolphins in marine clay under lateral loading.
Journal of Geotechnical Engineering, ASCE122(8): 607–612.
Raongjant W and Meng J(2011) Experimental investigation on
seismic behavior of single piles in sandy soil.Earthquake
Engineering and Engineering Vibration10(3): 417–422.
Reese LC, Cox WR and Koop FD(1974) Analysis of laterally loaded
piles in sand.Proceedings of the 6th Annual Offshore Technology Conference, Houston, TX, USA, pp. 473–484.
Rosquoet F, Thorel L, Garnier J and Canepa Y(2007) Lateral
cyclic loading of sand-installed piles.Soils and Foundations
47(5): 821–832.
Sedran G, Stolle DF and Horvath RG(2001) An investigation of
scaling and dimensional analysis of axially loaded piles.
Canadian Geotechnical Journal38(3): 530–541.
Tomlinson MJ(2001)Foundation Design and Construction,
7th edn. Prentice Hall, Upper Saddle River, NJ, USA.
Verdure L, Garnier J and Levacher D(2003) Lateral cyclic
loading of single piles in sand.International Journal of
Physical Modelling in Geotechnics3(3): 17–28.
Zhu B, Byrne BW and Houlsby GT(2013) Long-term lateral cyclic
response of suction caisson foundations in sand.Geotechnical
and Geoenvironmental Engineering139(1): 73–83.
WHAT DO YOU THINK?
To discuss this paper, please email up to 500 words to the editor at [email protected]. Your contribution will be forwarded to the author(s) for a reply and, if considered appropriate by the editorial panel, will be published as discussion in a future issue of the journal.
International Journal of Physical Modelling in Geotechnics