Convergence or divergence – Transition in agriculture
of Central and Eastern Europe and Commonwealth
of Independent States revisited
Csaba Csaki, Attila Jambor*
Corvinus University of Budapest, Budapest, Hungary
*Corresponding author: attila.jambor@uni-corvinus.hu
Citation: Csaki C., Jambor A. (2019): Convergence or divergence – Transition in agriculture of Central and Eastern Europe and Commonwealth of Independent States revisited. Agricultural Economics – Czech, 65: 160–174.
Abstract: The agriculture of Central and Eastern European (CEE) countries as well as of the Soviet Union was an often studied area in the 1970´s and 1980´s among agricultural economists. After the system collapse, the transition of the agricultural sectors of these regions has gained importance. However, around the millennium, this topic was less studied. This paper aims at analysing the agricultural performance of CEE and Commonwealth of Indepen-dent States (CIS) countries between 1997 and 2016 and iIndepen-dentifying whether the system change and transition have brought changes and convergence in agricultural productivity to EU-15 levels. In doing so, the paper uses conver-gence theory and associated methods (Kernel density and Markov transition probability) to underpin its arguments. Results suggest that CEE and CIS countries have experienced a limited convergence to Western-European standards. However, there still exists a significant performance gap between the two regions with CEE countries standing closer to EU-15 averages. Reasons behind diverging performances are numerous as discussed at the end of the paper. Keywords: accession; Central and Eastern European countries; Commonwealth of Independent States; convergence; productivity
Central and Eastern European (CEE) countries, together with the countries of the Commonwealth of Independent States (CIS), have experienced unprec-edented changes in their agriculture during the past 25 years. First of all, both regions have shifted their economies from centrally planned to market-oriented structures, also affecting agriculture to a great extent. Second, thirteen CEE countries joined the European Union in 2004, 2007 and 2013, thereby becoming new members of the common European market again with serious agricultural impacts. Third, the role of Rus-sia has changed significantly both economically and politically in Asia, also affecting agri-food sectors of the CIS countries. Last but not least, the global economic and food crisis, started in 2007/08, also affected both regions to a great extent.
Despite these changes, the analysis of the long-term performance of these countries in agriculture is some-how missing in the literature. Although many studies
exist on the various aspects of the story, the evidence seems to be scrappy. The aim of this paper is to analyse the long-term performance of the agriculture sector of the CEE and CIS countries, thereby putting the dif-ferent elements of the puzzle together. In doing so, the paper analyses whether there was a convergence in agricultural performance to the level of EU-15 countries or not.
LITERATURE REVIEW
CEE agriculture: Evidence from the past
es-timating these impacts. Bach et al. (2000), for instance, analysed the economic impact of extending the CAP (Common Agricultural Policy) to Central and Eastern European Countries (CEEC). By applying the GTAP (Global Trade Analysis Project) model based on 1995 data, they found that agricultural production would increase substantially in the region after accession together with significant welfare gains.
Bchir et al. (2003) investigated the impact of EU en-largement on the Member States with a CGE (Comput-able General Equilibrium) approach based on 2001 data and analysed three scenarios. On the whole, they provisioned that EU accession would provoke huge swings on relative prices and big fluctuation in the real exchange rate of (New Member States) NMS, raising serious concerns for agriculture. They also forecasted that the impact of accession on EU-15 members would be negligible, whereas CEEC would face huge and not always beneficial consequences (deterioration of terms of trade by removed barriers; inefficient sectors will lag behind in competitive terms).
Another strand of the literature analysed the real impacts of EU accession on regional agriculture from various aspects. Gorton et al. (2006), for instance, analysed the international competitiveness of Hun-garian agriculture by calculating domestic resource cost (DRC) ratios using 2000–2002 data and making estimations for 2007 and 2013. They projected that EU enlargement will have a negative impact on the in-ternational competitiveness of Hungarian agriculture by increasing land and labour prices. Similar esti-mations were conducted by Erjavec (2006), based on partial equilibrium modelling for 1973–2000 data, forecasting that the CEE countries will gain from higher prices and budgetary support, indicating real improvements in most agricultural sectors on recent production levels. Ivanova et al. (2007) analysed Bul-garian agriculture after EU accession also by a par-tial equilibrium model based on data for 1992–2000 and found that accession would have a very positive effect on the crop sector in Bulgaria, whereas the ef-fect is the opposite on the livestock sector.
Ciaian and Swinnen (2006) analysed the capitalisation of subsidies in land prices in Central and Eastern Eu-rope with partial equilibrium modelling for 1992–2005 data and concluded that decoupling of payments shifts policy rents from landowners to farmers, but constrains productivity-enhancing restructuring. The authors also showed that with unequal access to subsidies, small tenants may even lose out from the subsidies. Hartvigsen (2014) investigated land reform and land
fragmentation processes in CEE countries and showed high fragmentation of ownership and land use, ham-pering agricultural development.
Bojnec and Fertő (2008) analysed the agri-food trade competitiveness with the EU-15 of the newly accessed Member States and concluded that trade has increased as a result of enlargement, though there have been ‘catching-up’ difficulties for some coun-tries in terms of price and quality competition, more in higher value-added processed products. Qineti and Lubos (2011) analysed the agrarian trade trans-formation in the Visegrad countries and found that the value and volume of export and import operations increased significantly. Jámbor (2014) analysed the in-tra-industry trade of CEE countries with EU-15 coun-tries and showed that products of different quality have been traded, implying serious consequences for regional competitiveness. Bojnec and Fertő (2015) analysed the price and quality competitiveness as well as comparative advantage in EU countries agri-food trade and found that New and Old Member States have become more similar in successful agri-food competitiveness and comparative advantages. Jámbor et al. (2016) analysed the country and industry spe-cific determinants of intra-industry agri-food trade in the Baltic countries and showed that the general assumptions apply to the region.
production of agri-food raw materials turned out to be lagged behind.
Baráth and Fertő (2017) analysed productivity and convergence in European agriculture and despite acknowledging different performances, supported the convergence hypothesis. Zahorsky and Pokrivcak (2017) assessed the agricultural performance of CEE countries by using total factor productivity indica-tors and concluded that inputs are used inefficiently in most countries of the region.
CIS agriculture: Evidence from the past
Contrary to the case of the CEE, the number of stud-ies analysing CIS countrof stud-ies’ agriculture and food sec-tors is limited. Csáki and Lerman (1997) were among the first to analyse land reform and farm restructuring in Central and Eastern Europe and CIS in the 1990s and showed that achievements fell short of original expectations, both in scope and in character. They also showed that the accomplishments of agrarian reform were modest due to many factors, including political and legal uncertainty, lack of a supportive environment, high risk, and inadequate mechanisms for farm restructuring and individual exit.
However, some years later, Lerman (2005) con-cluded in another article that the CIS countries could be characterised as reluctant reformers, while the CEE countries achieved significantly higher levels of economic and institutional reform, thus resulting in better performance. The engine of growth was more radical land reform and deeper individualisa-tion and restructuring of agriculture. Rozelle and Swinnen (2004) reached similar conclusions, stating that differences in CEE and CIS countries’ agricul-tural performance originated in the nature of the lag between reform and turnaround in output and pro-ductivity. Similarly, Lerman (2009) investigated land reform, farm structure and agricultural performance in CIS countries and concluded that better agricultural performance is achieved by countries that were more advanced on the path of reform, irrespective of how the reform is measured. The author also added that the lack of proper data makes CIS related agriculture based analysis pretty hard.
Moreover, there exists a number of studies ana-lysing different aspects of the agricultural sectors of the CIS countries, published by the IAMO Institute. These studies mainly concentrate on single countries and on specific sectors and the summary of these is far beyond the scope of this article (Petrick 2014;
Petrick and Djanibekov 2016; Mogilevskii et al. 2017). The FAO Regional Office for Europe and Central Asia was also very active at this topic (Lerman et al. 2016; Lerman and Sedik 2017).
Convergence theory and its applications to agriculture
There are many different ways to define and measure convergence in economics. In the dictionary, conver-gence is defined as ‘the act of converging and espe-cially moving toward union or uniformity’ (de Jong 2018). Convergence in economic theory generally refers to the Solow model, showing that poorer re-gions keep growing faster than richer ones. Theory therefore suggests that all regions will end up in being more or less equally rich, converging to a common state. The classic models were challenged around the millennium by Fujita et al. (1999), inventing the idea of new economic geography, explaining growth models of economic centres and agglomerations.
According to Islam (2003), economists have different perceptions of convergence as follows: convergence within an economy versus between economies; con-vergence in terms of growth rate versus income levels; σ-convergence versus β-convergence; unconditional (absolute) convergence versus conditional convergence; global convergence versus local or club-convergence; income-convergence versus TFP-convergence (Total Factor Productivity); deterministic convergence versus stochastic convergence. An excellent review on these convergence theories is given by de Jong (2018).
and Fisheries Fund (EMFF) and Instrument for Pre-Accession Assistance (IPA) all serve or have served the goal of convergence.
Regarding the application of the convergence theory to agriculture, there are various methods to approach this issue. According to de Jong (2018), price, produc-tivity and income are the three areas where conver-gence is analysed empirically in agricultural markets. His analysis, for instance in the European dairy sector, has not found structural convergence patterns in any of the three dimensions.
As for price convergence, most studies come from the price transmission literature, analysing whether price fluctuations are softened by the retail sector or not. Sosvilla-Rivero and Gil-Parejo (2004) studied price convergence for various consumer price indices in Europe and found some evidence for convergence of traded goods. Conclusions of price transmission empirical research vary greatly depending on the sec-tor tested, the methodology chosen and the frequency of the data used in the analysis (von Cramon-Taubadel et al. 2006). However, price transmission is generally found to be imperfect, meaning that a price change at the producer level is not fully transmitted to consumers. Bakucs et al. (2014), by applying a meta-analysis on the existing literature, showed that price asymmetries are more likely to exist in sectors with higher numbers of fragmented farm producers, higher political interests and higher concentration of retailer powers.
As to productivity convergence, Timmer et al. (2010) examined the gap between European and Amer-ican productivity growth and suggested that EU productivity levels were less than half of the USA. The authors investigated the patterns of convergence across the European countries from 1980 to 2005 but could not find convergence in agriculture. Mat-thews (2014) reached similar conclusion when stat-ing that productivity growth in CEE agriculture has been consistently lower than that of EU-15, while the gap has even grown from 2002 to 2011. Cechura et al. (2014) looked at catching up and falling behind processes in the European milk sector and showed a considerable amount of productivity differences. They found, however, no signs that poorly performing farms were catching up to better performing ones. On the contrary, Baráth and Fertő (2017) analysed productivity and convergence in European agricul-ture and found some evidence to support the con-vergence hypothesis, though they also showed that significant differences still existed between EU-15 and CEE levels.
Last but not least, the study of income conver-gence is probably the most widely studied part in the literature as it is linked to the topics of economic development and economic inequality. If compared to prices and productivity issues, income is found to be the most important by the majority of the stud-ies as it is most directly felt by people (de Jong 2018). Studies in agricultural economics mainly focus on the convergence of GDP/GNI per capita across countries and regions as well as the income distribution of farm-ers. Brasili et al. (2006) analysed the convergence of agricultural incomes in the EU and USA and found evidence on income convergence. Hansen and Teuber (2011) analysed the impact of the CAP on regional convergence and found that inequality in revenues increased while cross-sectional inequality softened.
METHODOLOGY
This paper uses the productivity convergence option out of the possibilities described above to measure convergence. In doing so, it uses partial productiv-ity measures (land and labour productivproductiv-ity) to con-duct its analysis. Although many other methods like data envelopment analysis (DEA), stochastic frontier analysis (SFA), total factor productivity (TFP) exist to analyse productivity in agriculture, they require lots of data. This paper aims at taking a more holistic view and does not intend to be too technical in nature. Moreover, given the diversity of structural differences in European and CIS agriculture, the same production function for all countries would not hold.
As to the choice of empirical method to test conver-gence, various methods exist to analyse convergence across regions. Monfort (2008) provides an excellent review on the topic (Table 1).
The empirical analysis was done with the STA-TA software package. Data on productivity come from the FAO database and are analysed from 1997 to 2016 due to data availability FAO (2018). FAO data on land and labour productivity are calculated by dividing agricultural value added by agricultural land and labour size, respectively. Agricultural value added data are measured in constant 2010 US dollars at the farm gate level.
The list of CEE countries: Bulgaria, Czech Re-public, Estonia, Hungary, Latvia, Lithuania, Poland, Romania, Slovakia and Slovenia. Croatia is omitted from the analysis because of the lack of reliable data. CIS countries contain Armenia, Azerbaijan, Belarus, Kazakhstan, Kyrgyz Republic, Moldova, Russia, Tajikistan, Ukraine and Uzbekistan. Geor-gia and Turkmenistan were omitted due to the lack of appropriate data. For comparison purposes, our sample was divided into three different productivity classes: high-productive countries (with productiv-ity exceeding EU-15 average by at least 25%); low-productive countries (with productivity below 75% of EU-15 average) and average-productive countries with the rest.
PERFORMANCE OF AGRICULTURE AFTER TRANSITION
After a quick review of the literature on empirical studies on CEE and CIS agricultural performance, descriptive statistics are provided in order to analyse the performance of the respective agricultural sectors in the previous 20 years.
The performance of agriculture in both regions can be measured by a number of different indicators. Some of the most important trends are about to be identi-fied here, thereby setting the scene. As to agricultural value added in the CIS countries, a number of different trends is observable (Figure 1).
[image:5.595.60.533.113.410.2]Generally, agricultural value added has been con-tinuously growing in each and every country of the CIS analysed, though numbers reflect high diversity among countries. In absolute terms, Russian values highly outperformed the region, realising more than 62 billion USD of value from the sector in 2013–2016, followed by Ukraine (13 billion USD at the same time), reflecting favourable conditions for agricultural pro-duction. At the other end, agricultural value added of Kyrgyzstan and Moldova was below 1 billion USD
Table 1. Properties of measures of inequality and convergence
Measure /quantitative (Q)Visual (V) Range Main characteristics
Beta-convergence beta-coefficient Q 0–∞ estimated rather than computed
Sigma-convergence
coefficient
of variation Q 0–1 in particular when the mean value is near zerosensitive to changes in the mean, Gini index Q 0–1 sensitive to changes in inequality around the median/mode
Atkinson index Q 0–1 in lower or upper tail of the distribution param-weight given to gaps between incomes eterised through the ‘aversion to inequality’
Theil index Q 0–∞ does not have a straightforward interpretationgives equal weights across the distribution;
mean logarithmic
deviation (MLD) Q 0–∞
gives more weight to gaps between incomes in the lower tail of the distribution; does not have a straightforward interpretation
Analysis of distribution
Kernel estimation V – no possibility of identifying individual regionsno possibility of statistical inference;
cumulative
frequency V – no possibility of identifying individual regionsno possibility of statistical inference;
Salter graphs V – no possibility of identifying individual regionsno possibility of statistical inference; Markov chain
analysis Q – and of identifying individual regionspossibility of statistical inference
in 2013–2016. In relative terms, Tajikistan’s agricultural value added growth was the highest (+235%) from 1997–2000 to 2013–2016, while Moldova’s performance in this regard was the lowest (+32%), respectively.
As to agricultural value added in the CEE, a different picture becomes observable (Figure 2). On the one hand, agricultural value added was the highest in Poland and Romania, exceeding 12 billion USD and 10 billion USD in 2013–2016, respectively, while Estonian and Slove-nian output was well below 1 billion USD at the same time. On the other hand, contrary to the situation of
the CIS, agricultural value added seems not to have increased significantly in any of the countries ana-lysed from 1997–2000 to 2013–2016 except Slovakia (+127%), Latvia (+65%) and Estonia (+56%). While NMS average agricultural value added growth was 16% from the first to the last period, CIS average growth was 72%, suggesting some divergence between the two regions in this respect. Consequently, convergence appeared between CIS and EU-15 agricultural output levels but not between CEE and EU-15 levels. Still, a considerable gap has remained for both regions
[image:6.595.75.520.103.308.2]com-Figure 1. Agricultural value added in CIS, 1997–2016, billion USD Source: own composition based on FAO (2018) data
Figure 2. Agricultural value added in CEE, 1997–2016, billion USD Source: own composition based on FAO (2018) data
0 2 4 6 8 10 12 14 A rm en ia A ze rb ai ja n Be la ru s K az ak hs ta n K yr gy z M ol do va Ta jik ist an U kr ai ne U zb ek ist an C IS a ve ra ge
1997–2000 2001–2004 2005–2008 2009–2012 2013–2016
Re
pu
bl
ic
Agricultural value added
0 2 4 6 8 10 12 14 16 Bu lg ar ia C ze ch Es to ni a H un ga ry La tv ia Li th ua ni a Po la nd Ro m an ia Sl ov ak ia Sl ov en ia C EE a ve ra ge EU -1 5 av er ag e C IS a ve ra ge
1997–2000 2001–2004 2005–2008 2009–2012 2013–2016
Re
pu
bl
ic
[image:6.595.76.527.516.729.2]pared to the EU-15 level. However, one should notice that in this period, the structure of CEE agriculture has considerably changed towards less intensive ag-ricultural production, resulting in less value added.
Agricultural trade has also experienced important changes during the transition period in both regions analysed. As evident from Figure 3, agri-food trade deficit was the biggest in Russia (–15 billion USD) in 2013–2016, while surplus was the biggest in Ukraine at the same time (8 billion USD). Ukraine seems to have been the only country with a considerable trade sur-plus in the region in the period analysed and note that the country has increased its agri-food trade balance 12 times from 1997–2000 to 2013–2016. CIS average values are highly determined by Russia and note that deficits were the biggest right after the economic crisis (in period 2009–2012).
Agricultural and food trade balance shows a some-what different picture in the CEE (Figure 4). Poland
had the highest surplus in 2013–2016 (8.5 billion USD), followed by Hungary (3.9 billion USD) and Bulgaria (1.6 billion USD). Note that Poland was a net agricul-tural and food importer in 1997–2000. The biggest agri-food trade balance growth also pertained to Po-land (10 times), Lithuania (also 10 times) and Bulgaria (+628%) from the first to the last period analysed. Compared to EU-15 levels, the CEE mainly followed western-European trade patterns, while its perfor-mance was much better than that of the CIS. Note that CEE countries mainly trade with EU-15 countries and among themselves, reflecting positive impacts of the European integration (Csáki and Jámbor 2016).
[image:7.595.63.538.362.725.2]Regarding productivity-based indices, also reflecting convergence patterns as discussed in the literature review section, a somewhat different picture applies for both regions. In the CIS, Armenia led the role in agricultural land productivity, showing an output of 1 400 USD/ha in 2013–2016, which is well above
Figure 3. Agri-food trade balance in CIS, 1997–2016, billion USD Source: own composition based on FAO (2018) data
Armenia
Azerbaijan
Belarus
Kazakhstan
Kyrgyz Republic
Russian Federation
Ukraine
CIS average
1997–2000 2001–2004 2005–2008 2009–2012 2013–2016
–30 –25 –20 –15 –10 –5 0 5 10
regional levels (Figure 5). This performance is partly due to the importance of the fruits and vegetables sector in Armenia’s agriculture sector. Moreover, Azerbaijan and Belarus also performed relatively well – CIS average was almost 1 400 USD/ha in 2013–2016. Although agricultural land productivity seems to have been increasing in most countries, this increase was very much limited as evident from Figure 5.
A similar picture is observable for CEE countries in terms of agricultural land productivity (Figure 6). All countries expect Bulgaria and Slovenia could in-crease agricultural land productivity to some extent from 1997–2000 to 2013–2016, though this growth was limited in most cases (Slovak values should be taken with care due to data reliability issues). The region in gen-eral shows high diversity in terms of land productivity with Slovak and Slovenian values around EU-15 levels and with a high productivity gap for the vast majority of the countries to western standards. The gap is even bigger for CIS countries, suggesting a productivity lag
of 4 times to CEE and 8 times to EU-15 levels. A limited convergence is observable in this regard.
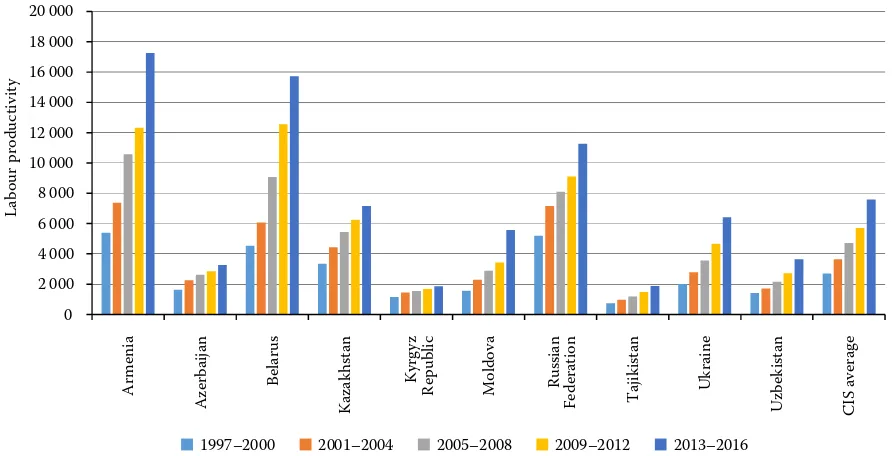
[image:8.595.61.535.91.445.2]As to labour productivity, CIS countries have ex-perienced a significant increase in this regard with Moldova (+257%), Belarus (+247%) as well as Armenia and Ukraine (+219%) showing the highest growth from 1997–2000 to 2012–2016 and Kyrgyzstan the lowest (+58%) (Figure 7). Absolute numbers were also the highest for Armenia, Belarus and Russia, all exceeding 10 000 USD per worker. CIS average also increased in terms of labour productivity in agriculture from the first to the last period analysed by almost three times. This trend is mainly due to the gen-eral decrease of agricultural labour force (exit from agriculture) together with economic development, resulting in lower shares of agriculture in GDP and output, requiring less people in the sector. Productivity growth is also related to the massive use of modern agricultural technologies, which has become more available in CIS countries through transition.
Figure 4. Agri-food trade balance in CEE, 1997–2016, billion USD Source: own composition based on FAO (2018) data
Bulgaria
Czech Republic
Estonia
Hungary
Latvia
Lithuania
Poland
Romania
Slovakia
Slovenia CEE average
EU-15 average
CIS average
–20 –10 0 10 20
1997–2000 2001–2004 2005–2008 2009–2012 2013–2016
Figure 5. Agricultural land productivity in the CIS, 1997–2016, USD/ha Source: own composition based on FAO (2018) data
0 200 400 600 800 1 000 1 200 1 400 1 600 A rm en ia A ze rb ai ja n Be la ru s K az ak hs ta n K yr gy z M ol dov a Ru ssi an Ta jik ist an U kr ai ne U zb ek ist an C IS a ve ra ge
1997–2000 2001–2004 2005–2008 2009–2012 2013–2016
Re pu bl ic Fe de ra tio n Land productivity
Figure 6. Agricultural land productivity in the CEE, 1997–2016, USD/ha Source: own composition based on FAO (2018) data
0 200 400 600 800 1 000 1 200 1 400 1 600 1 800 2 000 Bu lg ar ia C ze ch Es to ni a H un ga ry La tv ia Li th ua ni a Po la nd Ro m an ia Sl ov ak Sl ov en ia C EE EU -1 5 C IS a ve ra ge
1997–2000 2001–2004 2005–2008 2009–2012 2013–2016
Re pu bl ic Re pu bl ic Land productivity
Agricultural labour productivity also increased in CEE countries from 1997–2000 to 2013–2016 (Fig-ure 8). This was the area where convergence to EU-15 levels was most observable. The highest labour produc-tivity growth pertained to Slovakia (+217%) and Ro-mania (+214%) from 1997–2000 to 2013–2016, while the lowest was observable for the Czech Republic (+72%) and Poland (+80%) at the same period. How-ever, CEE countries started to increase their labour productivity from much higher levels than CIS countries (Figure 8), the gap between CIS and CEE labour produc-tivity was still four times in the last period (and 8 times
for EU-15 at the same time). In terms of convergence, CEE countries started to approach western standards as in 1997–2000, CEE agricultural labour productivity was 36% of the EU-15, while in 2013–2016, it was 63%.
[image:9.595.76.518.521.720.2]LIMITED CONVERGENCE
By applying the Kernel density functions and Markov chains to our sample as described in the methodology section, further patterns of CEE and CIS agricultural performance become available. As evident from Fig-ure 9, there is no clear distribution of land productivity visible for the years analysed. There is a peak around 1000 EUR/ha but in terms of convergence, Figure 9 shows status quo. If convergence occured, the peak
should move to the right over time. The persistent gap of low productivity regions seems to have remained here.
[image:10.595.74.521.96.324.2]The Markov transition probability matrices seem to end up in the same conclusion. For CEE coun-tries, each and every country analysed was below 75% of EU-15 averages in term of land productivity in 1997–2000 and actually all countries remained there in the last period except Armenia reaching EU-15 aver-age performance (Table 2). In other words, the station-arity in distribution shows that most countries stayed in the low productivity class.
Figure 7. Agricultural labour productivity in the CIS, 1997–2016, USD/worker Source: own composition based on FAO (2018) data
0 2 000 4 000 6 000 8 000 10 000 12 000 14 000 16 000 18 000 20 000 A rm en ia A ze rb ai ja n Be la ru s K az ak hs ta n K yr gy z M ol do va Ru ssi an Ta jik ist an U kr ai ne U zb ek ist an C IS a ve ra ge
1997–2000 2001–2004 2005–2008 2009–2012 2013–2016
Re pu bl ic Fe de ra tio n Labour productivity
Figure 8. Agricultural labour productivity in the CEE, 1997–2016, USD/worker Source: own composition based on FAO (2018) data
0 10 000 20 000 30 000 40 000 50 000 60 000 Bu lg ar ia C ze ch Es to ni a H un ga ry La tv ia Li th ua ni a Po la nd Ro m an ia Sl ov
ak CEE
EU -1 5 C IS a ve ra ge
1997–2000 2001–2004 2005–2008 2009–2012 2013–2016
[image:10.595.76.522.525.720.2]Similar conclusions can be drawn for CEE countries as well (Table 3). Eight countries out of ten were low performers in terms of land productivity in 1997–2000 and seven actually remained to be so in 2013–2016 (except Slovakia). Moreover, Slovenia’s land produc-tivity was around EU-15 averages in both periods analysed. On the whole, the lack of mobility is evi-dent in both cases.
In terms of labour productivity, results suggest the lack of convergence even more. The Kernel density plot shows some more diversity among the countries analysed in labour productivity, especially in the lower end (Figure 10). However, the lack of convergence here is at least as evident as in Figure 9 – density does not change in time.
The Markov transition probability matrices also underpin arguments above. For both regions, labour
productivity was less than 75% of EU-15 averages for all countries analysed in 1997–2000 and this actu-ally remained in 2013–2016. None of the countries was able to increase its labour productivity to EU-15 levels in 20 years, suggesting that the productivity gap remained and convergence seems to be still far away (Table 4–5).
POSSIBLE REASONS BEHIND
[image:11.595.88.507.102.333.2]Possible reasons behind different performance as well as the lack of convergence are numerous. First of all, both regions have faced serious challenges in creating a market conforming trade and policy environment. The process of moving towards a mar-ket economy, including land privatisation, changing the structure of the economy or de-collectivisation
[image:11.595.305.532.670.741.2]Figure 9. Kernel density plot for land productivity Kernel function was based on the Gaussian method Source: own composition based on FAO (2018) data
Table 2. Transition probability matrix for CIS for land productivity (from 1997–2000 to 2013–2016)
Initial
distribution < 75% 76–124% > 125% 10 < 75% 0.9091 0.0909 0.0000 0 76–124% 0.0000 0.0000 0.0000 0 > 125% 0.0000 0.0000 0.0000
Source: own composition based on FAO (2018) data
Table 3. Transition probability matrix for CEE for land productivity (from 1997–2000 to 2013–2016)
Initial
distribution < 75% 76–124% > 125% 9 < 75% 0.8181 0.0909 0.0000 1 76–124% 0.0000 0.0909 0.0000 0 > 125% 0.0000 0.0000 0.0000
Source: own composition based on FAO (2018) data
2005 2007 2009 2011
2006 2008 2010 1997/2012
1999/2014 2001/2016 2003
1998/2013 2000/2015 2002 2004
0
0.
00
02
0.
00
04
0.
000
6
D
en
sit
y
0 2 000 4 000 6 000 8 000
[image:11.595.64.291.671.741.2]was such a shock that agriculture of many Western European countries could not have even survived (Csáki 2005).
Political changes above were followed by a seri-ous institutional change, which, in majority of cas-es, was not a well-thought and organised process. Short-term agricultural interests and the lack of long-term strategies have determined the way new institutions have come into existence, resulting in inefficient implementation of even the good ideas (Csáki and Lerman 1997).
EU accession has also played an important role in determining the performance of CEE agriculture. CEE countries have become part of the European common market, offering many possibilities but
also different challenges. The way the countries used pre-accession EU-provided facilities such as SAPARD, ISPA and PHARE made also impact upon post accession performance. Countries focusing on competitiveness enhancement and production im-provement benefited more from these resources as far as post accession sectoral performance (Swinnen and Rozelle 2006). Slow adjustment to the relatively complicated administrative procedures also played a role in this regard.
[image:12.595.82.510.102.357.2]Meanwhile, the CIS seems to have remained less organised in implementing the necessary reforms. The local political environment had a more signifi-cant role as there was no EU benchmark and outside pressure to make inevitable changes. Such a lack
[image:12.595.64.290.667.740.2]Figure 10. Kernel density plot for labour productivity Kernel function was based on the Gaussian method Source: own composition based on FAO (2018) data
Table 4. Transition probability matrix for CIS for labour productivity (from 1997–2000 to 2013–2016)
Initial
distribution < 75% 76–124% > 125% 10 < 75% 1.0000 0.0000 0.0000 0 76–124% 0.0000 0.0000 0.0000 0 > 125% 0.0000 0.0000 0.0000
Source: own composition based on FAO (2018) data
Table 5. Transition probability matrix for CEE for labour productivity (from 1997–2000 to 2013–2016)
Initial
distribution < 75% 76–124% > 125% 10 < 75% 1.0000 0.0000 0.0000 0 76–124% 0.0000 0.0000 0.0000 0 > 125% 0.0000 0.0000 0.0000
Source: own composition based on FAO (2018) data
0
0.
0000
1
0.
00
00
2
0.
00
00
3
0.
000
04
D
en
sit
y
0 50 000 100 000 150 000 200 000 250 000 Labour productivity (USD/worker)
1998/2013 2000/2015 2002 2004 1997/2012
1999/2014 2001/2016 2003
2006 2008 2010 2005
[image:12.595.305.532.668.739.2]of pressure and changes is reflected in the remaining productivity gaps described above.
The performance of the CEE countries after accession also reflects the structure of farming (Lerman 2005). The structure except Poland and Slovenia is the result of a difficult process of land privatisation and farm restructuring. The relatively consolidated farm struc-ture with the dominance of small farms proved to be advantageous for these two countries and especially for Poland. The consolidated structure brought higher levels of asset endowment as well. In countries with so-called “dual” farming structure, both ends of the farming are still suffering from a kind of “transition phenomena” (Swinnen and Rozelle 2006). The small farms are generally too small and farmers are inexpe-rienced and lack resources, while the large ones still have some heritage of the collective farming system with some embedded inefficiencies.
Moreover, the failure of ideas to create a new ‘Eu-ropean farm model’ also played a role after the EU accession. The lack of effective farm consolidation and political will prevented the agriculture of many CEE countries from becoming more efficient, thereby maintaining previous production and output levels. With 2018 hindsight, previous ideas have remained dreams without proper action.
By ranking individual countries performance, Jámbor et al. (2016) suggest that Poland and the Baltic countries can be treated as the winners of EU accession in agri-culture, while Romania and Bulgaria proved to have used their potentials to the least. Their results also suggest that focusing on high value added agri-food products should be the strategy to reach develop-ment in the agriculture sector, though the majority of countries focused on the production of agri-food raw materials.
Recent protectionist agricultural policies, mainly observable in Russia after 2012, also proved to be in-efficient in the short run in terms of productivity enhancement. Embargo-driven domestic agricultural recovery policies have shown many different signs of restructuring, though its long-term effects are questionable. Furthermore, the general lack of CIS-based research from local agricultural economists was also not in favour of efficiency development.
On the whole, it seems that because of various rea-sons, CEE and CIS countries as a whole showed some signs of convergence to EU-15 standards in terms of land and labour productivity. However, it should be noted that CEE countries have outperformed CIS in agricultural land and labour productivity and this
performance was mainly due to the greater readiness of governments to implement a comprehensive pack-age of economic and social reforms, just as described by Lerman (2001).
Limited convergence in the CEE, however, is espe-cially a problem if the vast amount of EU funds directed to the agricultural development of the CEE region is taken into account. The study seems to echo conclu-sions made 20 years ago by Csáki and Lerman (1997): countries brave and fast enough to make changes had more benefits than those focusing on short-term agricultural advantages.
CONCLUSION
The paper analysed convergence patterns of CEE and CIS countries to EU-15 levels. In doing so, it ap-plied the Kernel density plots and Markov transition probability matrices and showed that some conver-gence in agricultural land and labour productivity appeared from 1997 to 2016. This argument was also underpinned by simple descriptive statistics. It seems that CIS agricultural land and labour productivity is still far away from EU-15 levels, while a considerable gap also existed (and have not significantly decreased) for CEE countries. While the Kernel density plots suggested similar patterns of productivity over time, suggesting limited convergence, the Markov transi-tion probability matrices showed the lack of perfor-mance enhancers – the vast majority of CEE and CIS countries had land as well as labour productivity below 75% of EU average and could not improve this performance at all.
Reasons behind different performance are numer-ous and are also dependent on regional and country specificities. However, it seems evident that the way of transition to the market economy was selected, together with institutional, land structure and pre-accession policies have definitely played a role. EU ac-cession proved to be a very important determinant for performance of CEE countries, while local policies also acted similarly for CIS countries. On the whole, limited convergence in the long run suggests badly focused agricultural policies in both regions.
REFERENCES
Bakucs Z., Falkowski J., Fertő I. (2014): Does market struc-ture influence price transmission in the agro-food sector? A meta-analysis perspective. Journal of Agricultural Eco-nomics, 65: 1–25.
Baráth L., Fertő I. (2017): Productivity and convergence in European agriculture. Journal of Agricultural Econom-ics, 68: 228–248.
Bchir H., Fontagne L., Zanghieri P. (2003): The impact of EU enlargement on Member States: a CGE approach. CEPII Working Paper No. 2003–10.
Bojnec Š., Fertő I. (2008): European enlargement and agro-food trade. Canadian Journal of Agricultural Economics, 56: 563–579.
Bojnec Š., Fertő I. (2015): Are new EU member states catch-ing up with older ones on global agri-food markets? Post-Communist Economies, 27: 205–215.
Brasili C., Fanfani R., Gutierrez L. (2006): Convergence in the agricultural incomes: A comparison between the US and EU. In: Contributed Paper to the International Associa-tion of Agricultural Economists Conference, Gold Coast, Australia, August 12–18, 2006.
Cechura L., Grau A., Hockmann H., Levkovych I., Kroupo-va Z. (2014): Catching up or falling behind in Eastern European agriculture – the case of milk production. In: 142nd EAAE Seminar Growing Success? Agriculture
and rural development in an enlarged EU, Corvinus Uni-versity of Budapest, Budapest, Hungary, May 29–30, 2014. Ciaian P., Swinnen J.F.M. (2006): Land market imperfections
and agricultural policy impacts in the new EU member states: A partial equilibrium analysis. American Journal of Agricultural Economics, 88: 799–815.
von Cramon-Taubadel S., Loy J.-P., Meyer J. (2006): The im-pact of cross-sectional data aggregation on the meas-urement of vertical price transmission: an experiment with German food prices. Agribusiness, 22: 505–522. Csáki C. (2005): Agricultural reforms in Central and Eastern
Europe and the former Soviet Union Status and perspec-tives. Agricultural Economics, 22: 37–51.
Csáki C., Jámbor A. (2013): The impact of EU accession: lessons from the agriculture of the new member states. Post-Communist Economies, 25: 325–342.
Csáki C., Jámbor A. (2016): Ten years of EU membership: How agricultural performance differs in the new member states. Eurochoices, 15: 35–41.
Csáki C., Lerman Z. (1997): Land reform and farm restructur-ing in East Central Europe and CIS in the 1990s: Expecta-tions and achievements after the first five years. European Review of Agricultural Economics, 24: 428–452.
Erjavec E., Donnellan T., Kavcic S. (2006): Outlook for CEEC Agricultural Market After EU Accession. Eastern European Economics, 44: 83–103.
FAO (2018): FAO. Available at http://www.fao.org/faostat/en/ Fujita M., Krugman P.R., Venables A.J., Fujita M. (1999):
The spatial economy: cities, regions and international trade (Vol. 213). MA: MIT press, Cambridge.
Gorton M., Davidova S., Banse M., Bailey A. (2006): The in-ternational competitiveness of Hungarian agriculture: Past performance and future projections. Post-Communist Economies, 18: 69–84.
Gorton M., Hubbard C., Hubbard L. (2009): The folly of EU policy transfer: Why the CAP does not fit Central and Eastern Europe. Regional Studies, 43: 1305–1317. Islam N. (2003): What have we learnt from the convergence
debate? Journal of Economic Surveys, 17: 309–362. Hansen H., Teuber R. (2011): Assessing the impacts of EU’s
common agricultural policy on regional convergence: sub-national evidence from Germany. Applied Economics, 43: 3755–3765.
Hartvigsen M. (2014): Land reform and land fragmenta-tion in Central and Eastern Europe, Land Use Policy, 36: 330–341.
Ivanova N., Peneva M., Mishev P., Golemanova A., Erjavec E. (2007): Bulgarian Agriculture and EU Accession. Post-Communist Economies, 19: 263–280.
Jámbor A. (2014): Country-specific determinants of hori-zontal and vertical intra-industry agri-food trade: The case of the EU new member states. Journal of Agricultural Economics, 65: 663–682.
Jámbor A., Somai M., Kovács S. (2016): 10 years of EU mem-bership: Diverging performances in new member states agriculture. Ekonomicky Casopis, 64: 458–476.
de Jong W. (2018): Structural convergence between the dairy sectors of the EU-27 Member States. MSc Thesis, Agricul-tural Economics and Rural Policy, Wageningen UR. Lerman Z. (2005): Agriculture in transition economies: from
common heritage to divergence. Agricultural Economics, 26: 95–114.
Lerman Z. (2009): Land reform, farm structure, and agri-cultural performance in CIS countries. China Economic Review, 20: 316–326.
Lerman Z., Sedik D., Yusupov Y., Stanchin I., Kazakevich I. (2016): Wheat production and regional food security in CIS: The case of Belarus, Turkmenistan, and Uzbekistan. FAO Regional Office for Europe and Central Asia, Policy Studies on Rural Transition No. 2016–1.
Lerman Z., Sedik D. (2017): Cooperatives in Kyrgyzstan: Findings from a survey of cooperatives and users. In: Hen-drikse G., Cliquet G., Ehrmann T., Windsperger J. (eds): Management and Governance of Networks. Contributions to Management Science. Springer, Cham.
capreform.eu/what-is-happening-to-eu-agricultural-pro-ductivity-growth/
Mogilevskii R., Abdrazakova N., Bolotbekova A., Chalbas-ova S., Dzhumaeva S., Tilekeyev K. (2017): The outcomes of 25 years of agricultural reforms in Kyrgyzstan. IAMO Discussion Paper No. 162. IAMO, Halle (Saale).
Monfort P. (2008): Convergence of EU regions: Measures and evolution. European Commission, Regional Policy – Working Paper No. 1, Brussels.
Petrick M. (2014): Modernising Russia’s cattle and dairy sec-tors under WTO conditions: Insights from East Germany. IAMO Discussion Paper No. 150. IAMO, Halle (Saale). Petrick M., Djanibekov N. (2016): Obstacles to crop
diver-sification and cotton harvest mechanisation: Farm survey evidence from two contrasting districts in Uzbekistan. IAMO Discussion Paper No. 153. IAMO, Halle (Saale). Qineti A., Lubos S. (2011): The agrarian trade transformation
in the Visegrad countries. In: Proceedings European
Asso-ciation of Agricultural Economists in its series 2011 Interna-tional Congress. Zurich, Switzerland, Aug 30–Sept 2, 2011. Rozelle S., Swinnen J.F.M. (2004): Success and failure of re-form: Insights from the transition of agriculture. Journal of Economic Literature, 42: 404–456.
Sosvilla-Rivero S., Gil-Pareja S. (2004): Price convergence in the European Union. Applied Economics Letters, 11: 39–47. Swinnen J.F.M., Rozelle S. (2006): From Marx and Mao to the Market: The Economics and Politics of Agricultural Transi-tion. Oxford University Press, UK.
Timmer M.P., Inklaar R., O’Mahony M., van Ark B. (2010): Economic Growth in Europe: A Comparative Industry Perspective. Cambridge University Press, New York. Zahorsky T., Pokrivcak J. (2017): Assessment of the
Agri-cultural Performance in Central and Eastern European Countries. AGRIS on-line Papers in Economics and In-formatics, 9: 113–123.