Consumer Prices
NESC Secretariat Papers
Paper No. 9
Consumer Prices
Noel Cahill
November 2013
The NESC Secretariat Papers provide analysis of economic, social or environmental evidence and policy. The views are those of the authors and do not represent the collective view of the Council.
Table of Contents
1. Introduction 2
2. Consumer Price Comparisons 3
3. Inflation 9
4. Factors that Contribute to Price Differences 15
5. Selected Sectors 21
6. Conclusions 25
Appendix:
Comparison of Prices in Tesco in Dublin and Belfast on 18 April 2013 28
Bibliography 31
List of Boxes
Box 1: Trends in Price Level Indices over Time 4
List of Tables
Table 1: Irish Price Level Relative to EU and UK by Sector, 2012 5 Table 2: Percentage Change in Consumer Prices for Ireland, UK
and the Euro Area, 2008 to 2012 7
Table 3: Annual Average Rate of Inflation (HICP) in Ireland and
the Euro Area, 1999 to 2012 11
Table 4: Hourly Labour Costs in Euro Terms by Sector for Ireland,
the Netherlands and the UK in 2011 (€) 19
List of Figures
Figure 1: Irish Consumer Price Level Relative to
EU (15) =100, 1995 to 2012 3
Figure 2: Irish Consumer Price Level Relative to UK=100, 1995 to 2012 6 Figure 3: Inflation in Ireland and the Euro Area, 1997 to 2012
(Annual Percentage Change in HICP) 9
Figure 4: Goods Inflation in Ireland and the Euro Area, 1997 to 2012 10 Figure 5: Services Inflation in Ireland and the Euro Area, 1997 to 2012 10 Figure 6: Hourly Labour Costs in the Business Sector in EU Member
1.
Introduction
1This paper examines Irish consumer prices. It describes how prices in Ireland compare to other EU countries and the changes that have occurred since the mid-1990s. The primary purpose of this paper is to examine the factors that contribute to Irish prices being relatively high compared to other EU economies. The contribution of different types of costs is considered including retail operating costs, the cost of goods, labour costs and other costs. The role of differences in competition, regulation and demand are discussed.
The paper also examines the sectoral influences on Irish prices in groceries and pharmaceuticals. While food prices have fallen in recent years, a price premium relative to the UK seems to remain. Expenditure on pharmaceuticals is a minor part of total consumer expenditure but this area is of interest as it is characterised by an unusually large price premium and distinctive price-setting mechanisms. Finally the paper summarises the range of factors that are capable of explaining above average consumer prices in this country.
The paper is structured as follows. Section 2 outlines how Irish prices compare to other EU economies. Section 3 describes Ireland’s comparative experience of inflation and discusses the factors that have influenced this. Section 4 examines the general factors that contribute to relatively high consumer prices in Ireland drawing on insights that have emerged from research on this issue, particularly from Forfás and the Competition Authority. The influences on prices in two sectors, groceries and pharmaceuticals, are examined in Section 5. Conclusions are presented in Section 6.
1
2.1
Eurostat Comparisons
According to Eurostat, Irish consumer prices in 2012 were on average 9.1 per cent above the EU (15) average. Ireland’s consumer prices in 2012 were the fifth highest in the EU with only Denmark, Sweden, Finland and Luxembourg having higher prices.
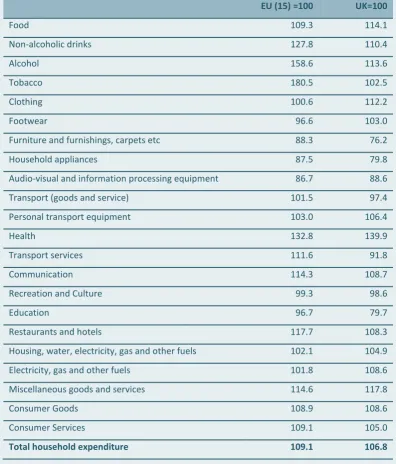
[image:8.595.125.468.385.589.2]This differential has changed over time (see Figure 1). Eurostat points out that changes in the comparative price level index are not purely driven by price changes as there are some changes in the items used to construct these indices over time (see discussion in Box 1). Ireland’s price level relative to other EU countries has fallen since its peak in 2008 when Ireland’s consumer prices were 24.4 per cent above the EU (15) average and second only to Denmark’s within the EU. In 1995 Ireland’s consumer prices were almost 5 per cent below the EU (15) average. Prices relative to the EU (15) average rose sharply in the final years of the 1990s and continued rising up to 2003.
Figure 1: Irish Consumer Price Level Relative to EU (15) =100, 1995 to 2012
Source: Eurostat.
Ireland’s price differential relative to the EU (15) for goods and services in 2012 was approximately the same (around 9 per cent in each case). For several years prior to 2012 the differential had been larger for services than for goods. In 2008 the price index for Irish services was 28.6 per cent above the EU (15) average while Irish goods prices were 18.6 per cent above average. The price premium for services has fallen more rapidly than for goods.
In relation to goods the largest differentials were for tobacco (80.5 per cent) and alcohol (58.6 per cent) in 2012 (see Table 1). These differentials are not surprising in that these items are heavily
80.0 90.0 100.0 110.0 120.0 130.0 140.0
taxed in Ireland. There was also a considerable price differential for food (9.3 per cent) and non-alcoholic beverages (27.8 per cent). The clothing price index was approximately in line with the EU (15) average while the remaining categories of consumer goods–footwear; furniture and floor covering; household appliances and audio-visual equipment—have prices below the EU (15) average.
In terms of services, the largest price differential is for health in which Irish prices are estimated to be exceptionally high at 32.8 per cent above the EU (15) average in 2011. Health is mainly provided on a non-market basis in most countries. For non-market services, these relative price indices (unlike those used for the purposes of calculating inflation over time) are not based on actual prices paid by consumers but on the estimated total price (derived from the cost of providing the service) of the service, most of which is paid by the State. After health, the highest Irish services prices are for restaurants and hotels (17.7 per cent above the EU (15) average) and communications (14.3 per cent above average).
Box 1: Trends in Price Level Indices over Time
The use of Eurostat’s price level indices (PLIs) to measure the trend in Ireland’s relative price level over time is subject to a number of caveats. These indices are primarily designed to measure price differences between countries at a given point in time rather than trends over time. The Harmonised Index of Consumer Prices (HICP) is used to measure changes in prices over time but does not allow comparisons of price levels across countries.
There are a number of methodological differences between the HICP and the PLIs used to compare price levels, including the following. First, the PLI series is not a pure price series like the HICP; it is affected by changes in the composition of the product samples as well. Second, the HICP covers a basket of products that is representative of the country in question; the basket of products covered is different for each country. The calculation of the PLIs seeks to measure price levels across countries in a comparable way. The products covered include those that are representative of a country’s consumption and those that are not representative. If only representative products were included, international comparability would not be feasible (Eurostat, 2012).
At an aggregate level the movement over time of Ireland’s price level relative to the euro area is fairly consistent with the trend in inflation in Ireland and the euro area as measured by the HICP. Over the years 2000 to 2012, the annual rate of inflation in Ireland as measured by the HICP (all items) was 2.4 per cent while the annual rate of inflation for the euro area was 2.2 per cent over the same period. Over this period Ireland’s price level relative to the euro area as measured by the Eurostat PLI showed a modest increase of 1.5 per cent.
However, when one goes beyond the aggregate level, this broad consistency between the two series is not evident. For example, the annual rate of inflation in Ireland for food over the period 2000 to 2012 was 1.3 per cent. This was considerably lower than annual rate of food inflation for the euro area of 2.3 per cent. Despite Ireland’s relatively lower rate of food inflation over this period, Ireland’s price level index for this category increased relative to the euro area (according to the Eurostat PLI) by 7.2 per cent.
Table 1: Irish Price Level Relative to EU and UK by Sector, 2012
EU (15) =100 UK=100
Food 109.3 114.1
Non-alcoholic drinks 127.8 110.4
Alcohol 158.6 113.6
Tobacco 180.5 102.5
Clothing 100.6 112.2
Footwear 96.6 103.0
Furniture and furnishings, carpets etc 88.3 76.2
Household appliances 87.5 79.8
Audio-visual and information processing equipment 86.7 88.6 Transport (goods and service) 101.5 97.4 Personal transport equipment 103.0 106.4
Health 132.8 139.9
Transport services 111.6 91.8
Communication 114.3 108.7
Recreation and Culture 99.3 98.6
Education 96.7 79.7
Restaurants and hotels 117.7 108.3 Housing, water, electricity, gas and other fuels 102.1 104.9 Electricity, gas and other fuels 101.8 108.6 Miscellaneous goods and services 114.6 117.8
Consumer Goods 108.9 108.6
Consumer Services 109.1 105.0
Total household expenditure 109.1 106.8
Source: Eurostat.
Note: Where the index is above 100, it means that the Irish level is above the EU (15) or UK level while if the index is below 100 the Irish price level is below that of the EU (15) or the UK.
the UK (28.2 per cent for medium-scale customers). SEAI figures show that Irish residential gas prices were below the euro area average at that time (SEAI, 2013).
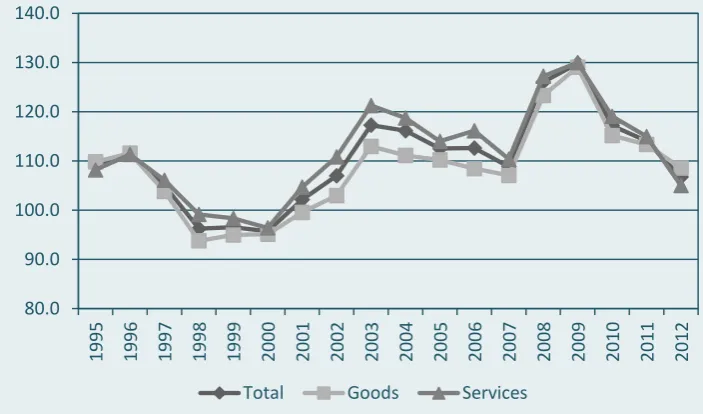
[image:11.595.117.469.301.508.2]The price differential for Irish consumer prices relative to the UK in 2012 was 6.8 per cent. The price premium relative to the UK was lower for services (5.0 per cent) than for goods (8.6 per cent). The UK differential has been more volatile than the corresponding differential with the EU (15) due to the greater influence of the exchange rate (see Figure 2). There was a substantial fall in Irish prices relative to the UK in the late 1990s due to the decline in the value of Ireland’s currency at that time and Irish prices were below UK prices for a few years. There was a sharp rise in the Irish price differential relative to the UK in 2008 and 2009 while this was substantially reversed in the following two years
Figure 2: Irish Consumer Price Level Relative to UK=100, 1995 to 2012
Source: Eurostat.
The largest differences for goods prices with the UK in 2012 were in regard to food (14.1 per cent), alcohol (13.6 per cent) and clothing (12.2 per cent). The clothing index is particularly volatile; in 2011, the Irish clothing price index was below that of the UK. Irish prices were below the UK average for three goods categories: furniture and furnishings; household appliances and audio-visual equipment.
It may seem surprising that for some goods categories Irish prices are now shown as lower than those of the EU (15) and the UK. The Eurostat price indices are less accurate in terms of measuring differences for specific categories such as clothing than for the economy as a whole. However it is worth noting that the inflation figures show large absolute price declines in Ireland across the main goods categories while there have been either smaller declines or price increases in recent years in the EU (15) and UK (see Table 2). The inflation figures are produced separately from the relative price indices.
80.0 90.0 100.0 110.0 120.0 130.0 140.0
1995 1996 1997 1998 1999 2000 2001 2002 2003 2004 2005 2006 2007 2008 2009 2010 2011 2012
Table 2: Percentage Change in Consumer Prices for Ireland, UK and the Euro Area, 2008 to 2012
Ireland UK
Euro (17 countries)
Food -6.9 17.8 5.4
Non-alcoholic drinks 0.3 25.3 9.3
Alcohol -9.2 17.3 7.7
Tobacco 21.4 34.9 22.3
Clothing -20.6 -5.7 3.1
Footwear -26.3 -7.4 3.8
Furniture and furnishings etc -22.0 12.5 4.2 Household appliances -10.4 12.9 -1.5 Audio-visual and information
processing equipment -37.2 -30.0 -25.7 Transport goods and services 7.6 20.5 11.5
Motor cars -15.9 5.1 0.8
Health 8.2 12.5 6.4
Transport services 21.6 38.5 12.2 Communications 2.7 14.6 -6.1 Recreation and culture -4.0 3.4 1.5
Education 23.4 29.6 5.7
Restaurants and hotels -3.0 13.5 7.0 Housing, water, electricity, gas and
other fuels -0.8 16.0 11.4 Actual rentals for housing -17.4 9.4 6.2 Electricity, gas and other fuels 15.1 23.5 17.0
Miscellaneous goods and services 10.9 9.7 9.1 Consumer goods -3.2 11.6 7.5 Consumer services 3.2 14.2 7.1
HICP (all items) -0.2 13.4 7.3
2.2
National Consumer Agency and Other Surveys
The National Consumer Agency (NCA) has undertaken a number of surveys of prices in Ireland, north and south of the border. A 2008 survey by the NCA found that branded goods in Dunnes and Tesco were 28-31 per cent more expensive in the south compared to the north (National Consumer Agency, 2008). The survey also found that own-brand goods were 11 to 17 per cent more expensive in the south compared to the north. These price differentials existed after adjusting for VAT and excise duties. While this survey covered a limited range of goods, it had the advantage of illustrating the existence of substantial price differentials for identical products. The Eurostat figures indicate a substantial fall in the overall price premium relative to the UK since 2008. However the Eurostat figures show a continuing Irish premium relative to the UK in some areas including food.
To provide an update of the picture shown by the NCA survey of 2008 the NESC Secretariat undertook some comparisons of branded products north and south of the Border. Prices were compared in Tesco in Dublin and Belfast using online shopping facilities. The comparisons were based on a shopping list used by the NCA in regular comparisons across supermarket groups with some modifications on account of the fact that the same products were not always available in both Dublin and Belfast.
The results of this comparison are presented in an appendix to this paper. The total difference is that prices for this shopping list are around 9 per cent higher in Tesco in Dublin compared to Belfast. However, the price difference varies hugely for different products so that a different shopping list would give a different result. If the special offers in both jurisdictions are excluded, the price difference rises to 12.2 per cent. This differential is lower than that shown by Eurostat figures for the Irish / UK food price differential of over 13 per cent. In the case of over half of the prices, the percentage difference of the Dublin price over Belfast is in double or triple digits; for example, fresh foods are 18 per cent more expensive in Dublin. Two categories in this comparison are less expensive in Dublin. These are bread and frozen foods and this would seem to be due to the inclusion of Irish brands in these categories.
3.1
Inflation Trends
The price differential for Ireland’s consumer prices has varied over time. This suggests that an examination of inflation trends can help to understand how this price differential has come about. In 1995 Ireland’s relative consumer price level was below the EU (15) average. As can be seen in Figure 3, Ireland’s inflation was above the euro area average from the late 1990s to 2003. It fell to the euro area average for 2004 and 2005 while it subsequently rose above average in 2006 and 2007. Ireland had negative consumer price inflation in 2009 and 2010 (i.e., prices fell) while since then it has remained below average.
While inflation generally has been low in recent years, some categories of consumer expenditure have continued to show substantial price increases including transport services, education, energy, health and tobacco (see Table 2).
[image:14.595.131.469.524.670.2]Inflation measures changes in prices based on the average household’s pattern of expenditure. The experience of price changes will vary in accordance with different expenditure patterns. Research by the Vincentian Partnership has compared the changes in an estimated Minimum Essential Cost of Living (MESL) to changes in the Consumer Price Index (CPI). It was found that over the period 2008 to 2013 that the MESL had increased by 3.2 per cent in comparison to a fall in the CPI of 0.15 per cent. The MESL gives a higher weighting than the CPI to essential items of expenditure such as food, electricity and home heating. Hence this research indicates that those whose expenditure is concentrated on essential items will have continued to experience rising prices despite broad stability in the CPI over this period (Vincentian Partnership for Social Justice, 2013).
Figure 3: Inflation in Ireland and the Euro Area, 1997 to 2012 (Annual Percentage Change in HICP)
Source: Eurostat.
-3.0 -2.0 -1.0 0.0 1.0 2.0 3.0 4.0 5.0 6.0
Ireland’s above average inflation has been stronger and more persistent for services than for goods (Figures 4 and 5). Ireland had above average goods inflation in the period up to 2003 but, since then, Irish goods inflation has been below the euro area average. By contrast Irish services inflation remained above the euro area average until 2008.
[image:15.595.125.473.298.423.2]Over the period 1999 to 2012, the average rate of Ireland’s inflation was 0.3 percentage points above the euro area average; this includes the effects of negative and below average inflation in recent years (Table 3). Irish goods inflation on average over this period was actually below the euro area average. Irish services inflation, however, was on average 1.4 percentage points above the euro area average over this period.
Figure 4: Goods Inflation in Ireland and the Euro Area, 1997 to 2012
Source: Eurostat.
Figure 5: Services Inflation in Ireland and the Euro Area, 1997 to 2012
Source: Eurostat.
-6.0 -4.0 -2.0 0.0 2.0 4.0 6.0
Ireland Euro area (17 countries)
-2.0 0.0 2.0 4.0 6.0 8.0 10.0
[image:15.595.127.472.539.704.2]Table 3: Annual Average Rate of Inflation (HICP) in Ireland and the Euro Area, 1999 to 2012
Total Goods Services
Ireland 2.4 1.4 3.6 Euro area 2.1 2.0 2.2
Source: Eurostat.
3.2
Understanding Ireland’s Inflation
Ireland’s above average prices at present can in part be understood as the result of the above average inflation that existed in Ireland from the late 1990s up to 2007. This raises the question as to why Ireland experienced this period of above average inflation. This section considers a number of possible explanations.
Exchange Rates
The small open economy model of inflation, based on the theory of purchasing power parity (PPP), views inflation in an economy such as Ireland’s as being determined by external inflation and the change in the exchange rate. Much of the Irish research on inflation has focussed on the ability of this theory to explain Irish inflation. Within a monetary union there is no exchange rate with other members of the union. However, when trade patterns differ there will be differences in the average exchange rates of the members of a monetary union.
Honohan and Lane (2003) emphasised the impact of the depreciation of Ireland’s nominal effective exchange rate by 17 per cent between late 1996 and 2000 on Ireland’s above average inflation during the early years of Ireland’s euro membership. They point to Ireland’s much greater reliance on imports from non-euro countries (the UK and the US) and hence the disproportionate impact of a weak currency on Ireland’s import costs. The subsequent strengthening of the euro led to a decline in Irish inflation in 2004 and 2005, consistent with this explanation.
In 2008 and 2009 sterling weakened substantially against the euro resulting in a competitive gain for the UK. The initial direct impact of the weakness of sterling was a substantial increase in Irish consumer prices measured in euro terms relative to the UK in 20082. The fall in the value of sterling relative to the euro meant a loss of competitiveness for Irish businesses that competed with the UK including retailers in the Republic in competition with northern retailers. In time the effect of the
2
stronger euro contributed to a reduction in Ireland’s absolute price level in 2009 and 2010 (i.e., negative inflation) through lower import prices.
Demand
While the depreciation of the currency in the late 1990s can explain above average inflation at that time and continuing into the early years of the last decade, it cannot explain why Ireland had persistently high services inflation up to 2008; goods inflation has been below average since 2004. The persistence of high services inflation in Ireland points to the significant role of strong demand in the Irish economy as a factor driving higher inflation and cost increases. This strong demand was driven by credit creation and the housing boom. Honohan and Lane (2003) found that fiscal policy also helped to sustain inflation; after 2000 there was a sharp fall in the budget surplus of over 5 per cent of GDP in just two years.
The fact that inflation has been below average since 2008 is consistent with demand as a major explanatory factor in Ireland’s inflation. A recent paper by Bermingham et al. (2012) presents econometric evidence linking the strength of the domestic economy and inflation in Ireland; the fall of inflation since the economic crisis was as large as expected in the model used by the authors. This short discussion of Ireland’s inflation trends suggests that Ireland’s relatively high level of consumer prices can in part be understood as a legacy of the strong demand of the boom years. This applies more to services than to goods. It is in services3 that Ireland has experienced inflation that has been substantially and persistently above the euro area average and only partly reversed during the years of recession.
Costs
Another perspective views inflation as being driven by cost increases. Kenny and Mc Gettigan (1997) found a stable relationship between Irish wages, adjusted for productivity and aggregate consumer prices. However, they also found clear evidence of ‘the bidirectional nature of the feedback between wages and prices over the long term’ (1997: 190). Wages respond to prices and are driven by common factors such as demand so that it is difficult to identify the role of wage growth as an independent contributor to price inflation. Likewise it is also difficult to identify the role of other cost factors as contributors to price inflation. However, when costs have increased, these higher costs can become a factor in sustaining high prices even if the underlying cause of the initial rise in prices lies elsewhere.
Balassa-Samuelson Effect
Some analysts interpreted Ireland’s above average inflation in the previous decade as a result of above average productivity growth in the traded sector; this involved applying the Balassa-Samuelson theory to Ireland’s inflation.
This theory was originally developed to explain the strong positive correlation between average price levels and average income levels across countries; i.e., prices are generally higher in richer
3
equalising of the prices of traded products. Any temporary deviations would be eliminated by profitable arbitrage except to the extent that it is blocked by trade barriers. This price-equalising effect applies to traded products such as computers but not to non-traded commodities (such as hair cuts). The theory also assumes that productivity differences between high- and low-income countries are much more pronounced for traded rather than non-traded commodities and that this determines wage differences between countries. Low productivity in the traded sector results in low wages in lower income countries. These low wages also apply to the non-traded sector and result in lower non-traded prices and hence lower overall price levels for low-income countries. An implication of the Balassa-Samuelson theory is that lower income countries that are experiencing above average productivity growth will, other things being equal, also experience above average inflation. Hence this theory would predict that above average productivity in Ireland’s traded sector would lead to above average inflation.
Mac Coille and McCoy (2012) estimated that the Balassa-Samuelson effect could explain a substantial proportion of Ireland’s inflation differential with the euro but could not fully explain it. Honohan and Lane (2003) argue that little if any of Ireland’s above average inflation is a reflection of the Balassa-Samuelson effect. They argue that Ireland’s boom was largely one of employment growth rather than exceptional productivity growth and point to the statistical overstatement of productivity growth in manufacturing. Gros (2001) also questions the applicability of the Balassa-Samuelson effect to Ireland’s inflation. He points out that, even when Ireland had substantially lower income than the EU, Irish prices were close to the EU and euro averages. This is atypical in that poorer countries usually have lower prices so that Ireland differs from the typical starting point for the Balassa-Samuelson hypothesis. The Balassa-Samuelson hypothesis is based on labour mobility between the traded and non-traded sectors but assumes labour is not mobile internationally. However in the case of Ireland there is substantial labour mobility with the UK so Irish wage levels and hence non-traded prices are not necessarily determined by wages in the Irish traded sector. Hence Gros argues that there is a strong theoretical reason for the absence of a Balassa-Samuelson effect for Ireland.
Inflation in Other Members of the Euro
Following the adoption of the euro the standard deviation of inflation rates remained low and was much lower for the decade following the adoption of the euro compared to the previous decade (Leddin & Walsh, 2013). However, while this was the general pattern, there was significantly higher inflation in a number of euro members including Ireland, Spain, Portugal and Greece compared to the euro area average.
those countries including Ireland that also had above average inflation this meant very low real interest rates and added to demand and inflationary pressures.
While Ireland differs from Spain, Portugal and Greece in having above average consumer prices, these other countries could also be considered to have price levels that are in a sense too high, in view of the loss of cost competitiveness experienced. From this perspective there is a common challenge for these countries to reverse the effect of above average inflation in earlier years.
Conclusion
This section examines the factors that contribute to the level of Irish consumer prices being on average relatively higher than the EU (15) and the UK. The key factors that could lead to higher prices are as follows: differences in indirect taxes, demand, costs, competition and regulation (Competition Authority, 2009). For alcohol and tobacco, very high indirect taxes contribute to above average prices in Ireland relative to the EU (15). Evidence on the other factors is now discussed.
4.1
Cost differences
Retail Operating Costs
An obvious potential source of higher consumer goods prices in Ireland could be higher retail operating costs; i.e. costs such as labour, rents, rates faced by retailers. These costs are a sub-set of economy-wide costs. Costs are considered in more general terms below; this section focuses on retail costs.
Forfás commissioned an analysis of retailers’ costs from Farrell Grant Sparks (FGS Consulting) (Forfás, 2008). This study compared retail costs across eight cities including Dublin, Belfast, London, Manchester and Maastricht for four different types of retailers (convenience, multiple, department store and retail park). The costs of running an identical retail operation (based on the cost structure of Irish retailers) were compared across eight cities. The study acknowledged that this approach may over estimate the cost competitiveness of the Irish operations if the retailers outside Ireland were structured differently to achieve lower costs.
Based on the replies to the questionnaires from retailers, the Forfás/FGS study estimated that retail operating costs in Ireland represented from 20 to 25 per cent of the retail sales revenue. The remaining 75 to 80 per cent of revenue was for the cost of the goods and the profit margin. Operating costs of retailers were estimated for the following areas: labour costs; property costs including rent; transport and distribution; utilities; security and cleaning; advertising and marketing; local authority rates; and other business services.
The Forfás study found that operating costs for retailers in Ireland were 25 per cent higher in Dublin compared to Belfast. Based on the estimate that these operating costs represent 20 to 25 per cent of revenue, the Forfás report suggested that these higher operating costs ‘add approximately 5 to 6 per cent to the total cost base of retailers in Dublin versus those operating in Belfast’ (Forfás, 2008: 3)4. This was much less than the price differences for selected grocery products that had been identified by the NCA survey in 2008. The other cities in the Republic of Ireland (ROI) in the study were estimated to be more cost competitive than Dublin (in terms of retail operating costs).
In view of the fact that the stronger euro relative to sterling did not appear to be translating into lower import costs, Forfás recommended that a review of competition in the retail-related import/distribution sector should be undertaken. Such a study was subsequently undertaken by the Competition Authority and is discussed below.
4
Cost of Goods
Another possible reason for above average consumer goods prices is that the cost of the goods themselves is higher (as against retail operating costs). The price of the same goods can vary across markets arising from the practise of exporters setting different prices for different markets. The 2009 report of the Competition Authority found that exporters frequently ‘price to market’; i.e., ‘they will set their mark-up in each country according to the demand conditions they face’ (Competition Authority, 2009: 77). This was explained by the Competition Authority as follows:
This means that exporters will vary their desired mark-up over marginal cost across different markets depending on the elasticity of demand they face. For example, UK exporters are fully aware of the strong position that ROI importers are in due to the euro/stg exchange rate and will price (higher) accordingly; UK exporters would have also been aware of strong consumer demand and high disposable incomes in the ROI when setting import prices. UK exporters may also have been aware that the level of competition in the ROI market is not as strong compared to the UK/Northern Ireland (NI) where there is a greater number of large-scale retailers (Competition Authority, 2009: 19).
A paper by Alessandria and Kaboski (2011) analysed the prices charged by US exporters of the same products to different countries. They found large differences in prices charged with the richest country in the dataset paying 48 per cent more per unit than the poorest country (for the same product). This paper found strong evidence that pricing to market contributed substantially to absolute differences in consumer prices across countries.
Insofar as pricing to market is a factor in higher prices in Ireland it raises the question as to why this is the case. The Competition Authority quote above referred to the exchange rate, disposable income, the strength of demand and competition. Consumer demand has now been weak for some years and in this context it would seem less likely that pricing to market would mean higher prices in Ireland. The prices of almost all goods categories have fallen since 2008. However situations where identical branded items are sold at a premium that appears larger than can be explained in terms of costs suggest that pricing to market continues to be a factor in some Irish prices being higher.
Beyond Retail Operating Costs
The total impact of Irish costs on consumer prices is wider than that identified in the Forfás retail study. Production costs were not included in that study since the focus was on explaining price differences across the border for the same products so that differences in production costs by definition were not relevant. Production costs are covered by other Forfás reports; the most recent results from Forfás surveys of business costs are discussed below. Where goods are produced in Ireland for Irish consumption, the Irish costs and the efficiency of production will affect Irish consumer prices if the wholesale prices are not purely determined externally.
cent cost premium for retail operating costs could be considerably lower by now. One cost that has been artificially frozen against the general trend of falling costs is those leases that are covered by upward-only rent reviews.
The most recent Forfás survey of business costs on was published in April 2013 (Forfás, 2013a). This report compared costs in Ireland to trading partners across a range of areas: labour costs, property, transport, utilities and credit costs. There have been dramatic falls in construction and rental costs for both office and industrial space for new businesses. Forfás found that Dublin was the sixth cheapest for renting prime office space out of 16 locations benchmarked and the sixth most expensive out of 14 locations for prime industrial space. Retail rents, a cost of particular relevance to consumer businesses, are not covered in this Forfás survey. Ireland’s diesel costs were just above the euro area average in 2012. Forfás found the cost of credit for new loans in Ireland was above the euro area average; Irish interest rates for the stock of outstanding loans were below average. In the second semester of 2012, SEAI data show that electricity prices for business users were from 1 per cent to 15 per cent above the euro area average. For the price category with the highest market share among business customers, Irish electricity prices were 9 per cent above the euro area average (SEAI, 2013).
While property and rental costs have fallen, some businesses will be locked into former higher prices, either through the purchase of property at higher prices or entering long term leases at higher rental prices. These higher property costs became part of the cost base of some businesses and may be a factor in sustaining higher consumer prices.
Labour Costs
There are a range of measures that can be used to compare labour costs. Labour costs can be compared for the economy as a whole, for the business sector or individual sectors; costs can be measured in annual, monthly or hourly terms; and costs can be measured in terms of common currency (in euro terms) or in purchasing power standard (PPS) terms (i.e., adjusting for differences in purchasing power).
Since our focus is on explaining differences in consumer prices, it is more relevant to compare costs in euro terms rather than adjusting for differences in purchasing power; costs in euro terms are the costs employers have to pay. If one uses labour costs in purchasing power parity terms, the data has been adjusted using the variable that one is seeking to explain (price). If the focus is on living standards, it is wages in purchasing power parity terms that matter.
The most comprehensive way to measure labour costs is on an economy-wide basis. The European Commission’s AMECO database provides information on ‘compensation per employee’, a broadly defined economy-wide measure of labour costs. This measure of labour costs indicates that, in 2012, Irish costs were 10.2 per cent above the EU (15) average and 9.3 per cent above the UK. There are a number of qualifications to this measure of labour costs. It is derived from the national accounts so all forms of employee compensation are taken into account, including bonuses and pension contributions for high level staff. It is an annual measure so does not take account of differences in hours worked.
were 3.9 per cent above the euro area average while for the business sector hourly labour were 2.8 per cent below the euro area average (Figure 6). Hourly labour costs for the business sector in Ireland were 11.6 per cent below Germany, approximately the same as Italy but substantially higher than the UK (25.1 per cent). UK labour costs in euro terms have fallen a lot since 2007 due to a large fall in sterling so that UK labour costs are now substantially lower than all of the EU (15) countries except Spain, Greece and Portugal.
Figure 6: Hourly Labour Costs in the Business Sector in EU Member States in 2012 (€)
Source: Eurostat.
There is a considerable variation in the pattern across different sectors (see Table 4). Eurostat provides labour cost data by sector in 2011 for a limited number of EU member states. In 2011, Irish labour costs for food service and accommodation were almost one quarter lower than in the Netherlands although more than 30 per cent above the UK. The highest Irish labour costs were in education; Irish costs were still marginally below the Netherlands in this sector but almost double the UK level.
€0.00 €5.00 €10.00 €15.00 €20.00 €25.00 €30.00 €35.00 €40.00 €45.00 Spain
seems unable in itself to explain why Irish prices are above the EU (15) and euro averages5 since Irish hourly labour costs are close to the euro area average. However, a key qualification to this is that Irish labour costs are substantially above the UK average. The differential between Irish and UK labour costs is substantially more than the price differential.
Table 4: Hourly Labour Costs in Euro Terms by Sector for Ireland, the Netherlands and the UK in 2011 (€)
Ireland Netherlands
United Kingdom
Business economy 23.31 31.13 18.83
Manufacturing 24.92 31.95 19.52 Construction 21.46 31.29 19.27 Services of the business economy 22.76 30.72 18.57 Wholesale and retail trade 19.01 26.84 15.68 Transportation and storage 23.27 28.66 18.31 Accommodation and food service 13.64 18.35 10.27 Information and communication 32.15 40.77 25.55 Financial and insurance activities 37.38 52.25 33.02 Real estate activities 20.22 36.46 18.41 Professional, scientific and technical 27.81 40.87 24.83 Administrative and support services 18.49 21.53 14.94 Public administration and defence 27.88 39.63 24.17
Education 39.55 40.57 20.68
Human health and social work activities 25.59 31.32 19.23 Arts, entertainment and recreation 18.18 28.38 15.74 Other service activities 18.24 28.49 16.18
Source: Eurostat.
5
4.2
Differences in Competition
In 2009 the Competition Authority was requested by the Tánaiste to undertake a study on competition in the ‘retail-related import/distribution sector’. This followed on from the conclusions of the Forfás study that differences in retail operating costs appeared unable to explain the extent of the price differentials in grocery prices north and south of the border. This study pointed out that there are several possible factors that lead to price differences and that competition was one such factor. The Competition Authority (2009) found that grocery retailing in the ROI was in general more concentrated than in the UK and that there was a different mix of retailers so that competition operated differently at local levels. By contrast the same study found that the clothing sector was much less concentrated.
4.3
Differences in Regulation
These arise in some sectors and are discussed below in relation to groceries and pharmaceuticals.
4.4
Differences in Demand
There is wide variation in the price differences across different sectors of expenditure as shown in Section 2 above. This section focuses on two sectors of interest: groceries and pharmaceuticals. Food has not been a major contributor to inflation in Ireland but is an area of significant expenditure and one where there seems to be a continuing price premium in Ireland (although prices have fallen substantially in recent years). Pharmaceuticals are, on average, a very small component of total consumer expenditure. However, this category is of interest as it is characterised by unusually large price premiums for some products and distinctive mechanisms for setting prices.
5.1
Groceries
In addition to general factors that contribute to higher prices in the ROI, the report of the Competition Authority (2009) identified a number of factors specific to the grocery sector that contribute to higher prices. First, the report found a relatively high level of concentration in the retail and wholesale chain in the ROI. In conjunction with consumers being less price sensitive this led to ‘relatively little pressure on retailers to price aggressively’ (:v). Second, the ROI grocery distribution system is less efficient than the UK’s system where retailers use fully developed central distribution systems (i.e., the retailers deliver a large variety of goods in a single visit). In Ireland, Tesco has the most developed central warehousing and distribution system. Centralised distribution has continued to develop among other retailers in Ireland in recent years. NI is part of this UK distribution system and the costs of transporting goods across the Irish Sea to NI are shared out across the UK retail network. Third, the Competition Authority considered that the Retail Planning Guidelines make it more difficult for new retailers to establish a significant presence in the ROI.
A study by Forfás (2013b) reviewed the impact of removing the cap on the size of retail premises in Ireland. According to this study it is not known whether the cap on store size had deterred new entrants from entering the Irish market. The literature cited in the Forfás report did not provide strong evidence that the retail cap resulted in higher costs; the interpretation by Forfás of the research evidence was that ‘economies of scale recede close to the current Irish limit for convenience stores (i.e. above 3,000 square metres)’. However, since economies of scale varied Forfás concluded that there was some scope to increase the limit to ensure that it was not a constraint on economies of scale. Forfás also pointed to the potential for different effects in different areas. It considered that a removal of the cap could have beneficial effects in terms of competition and lower prices in large population centres but that in smaller centres removal of the cap could reduce competition and lead to higher prices.
5.2
Pharmaceuticals
6An indication of high pharmaceuticals prices in Ireland is that Irish expenditure per capita on pharmaceuticals in 2010 was the third highest in the OECD. An ESRI study found that, despite a number of reforms introduced in recent years, the prices of both patent-protected and generic
6
pharmaceutical products in Ireland were high relative to other EU member states (Brick et al., 2013). Comparisons published by the Sunday Business Post (3 March 2013) have illustrated that the prices paid for a number of generic medicines (i.e., medicines no longer patent protected that are supplied by competing producers) by the HSE are dramatically higher than the prices paid for the same products by UK’s National Health Service (NHS). For example, the Irish price for citalopram used for the treatment of depression and anxiety attacks was seven times the UK price.
The pharmaceuticals market is highly regulated in Ireland and elsewhere. The State is the dominant buyer of pharmaceutical products: it was estimated that in 2007, 85 per cent of total pharmaceutical expenditure in Ireland was accounted for by public pharmaceutical expenditure under the primary care reimbursement scheme (PCRM) (Gorecki et al., 2012).
Components of the Price Level
The final price of pharmaceutical products is made up of several components:
the manufacturer’s price (known as the ex-factory price);
the wholesale margin;
the retail margin and dispensing fee;
VAT (21 per cent).
The maximum ex-factory price for pharmaceutical products is governed by agreements between the HSE and the Irish Pharmaceutical Healthcare Association (IPHA) and the Association of Pharmaceutical Manufacturers in Ireland (APMI). These agreements have a huge influence on prices. They are the basis for all prices in the market, both in situations where the HSE pays for the pharmaceuticals and where the patient bears the cost (Gorecki et al., 2012). The IPHA represents the major research-based pharmaceutical companies that provide branded products. Pharmaceuticals that are covered by patents are all branded products but some are no longer patent protected. In the case of some products that have gone off patents, generic equivalents are produced by several generic manufacturers. The generic manufacturers are represented by the APMI in Ireland.
It is possible to import pharmaceuticals from another member state without authorisation of the patent holder and the prices of these imports are not set in these agreements. However, where the HSE is reimbursing the cost of such imports, it sets a price that is close to that determined in the HSE/IPHA and HSE/APMI agreements.
Gorecki et al. (2012) found evidence of vigorous competition at wholesale level and that the market appeared to work well at this level. The recession and changes in HSE policies have put financial pressure on wholesalers.
long term illnesses), the price is based on the wholesale cost plus a retail mark-up of 20 per cent and a dispensing fee. This mark-up has been reduced from 50 per cent. In the case of purchases of prescription medicines not covered by a State scheme the pharmacist is free to set the price. A report by the National Consumer Agency (2013) shows that there is huge variation in the prices charged by pharmacies for private prescriptions within the same area.
Setting the Ex-Factory Price
Different methods are used to set the ex-factory price of new, patented products and products that are no longer patent protected. For new patented pharmaceuticals the ex-factory price is set on the basis of the average price charged in nine other member states. The ex-factory prices for off-patent pharmaceuticals were revised in agreements with the IPHA and APMI in 2012. Under these agreements prices are set at a percentage of the original patented price with the generic price set somewhat lower than the (off-patent) brand price.
With several providers of generic pharmaceuticals, competition might be expected to lead to prices far below the brand price. This, however, has not been the experience in Ireland: generic prices are close to the (off-patent) brand price. The Irish market for pharmaceuticals is small and generic penetration is relatively low. This contrasts with the UK where is there is a high level of generic use. Doctors in the UK are trained to prescribe by generic name rather than the brand name. Generic prices for reimbursement by the UK’s National Health Service (NHS) are reviewed on a quarterly basis.
The negotiation of generic drug prices by the HSE has been problematic. According to Michael Barry, Director of the National Centre for Pharmacoeconomics , ‘we haven’t had an effective generic drugs market in this country for many, many years’ and ‘prices come about through negotiation and clearly it hasn’t been possible to negotiate with the generic manufacturers a significant reduction in the price of generics’7. The combination of limited effective competition and unsatisfactory negotiations has led to the outcome of exceptionally high generic prices in Ireland.
Recent legislation seeks both to promote the greater use of generic products and to reduce their prices. The Health (Pricing and Supply of Medical Goods) Act 2013 permits the pharmacist to substitute a cheaper generic equivalent in place of a more expensive prescribed product. This applies both to prescriptions that are reimbursed by the HSE and private prescriptions. In addition, it introduces a new model in which a ‘reference price’ will be set for a group of interchangeable drug products. Pharmacists are to be reimbursed by the HSE on basis of this reference price for any of the interchangeable products. Public patients who want to get the branded product can still do so if willing to pay the additional cost. The reference price is also intended to be the base price used in determining prices for private patients.
The implementation of reference pricing began from November 2013. The first step is the introduction of a reference price for atorvastatin products that are used to treat cholesterol. It is expected that this will lead to significant price reductions both for the HSE and private patients. However, even after the introduction of reference pricing for atorvastatin products, the HSE will still be paying three to four times the price paid by the UK’s NHS for the same product (Sunday Business
7
Post, 3 November 2013). This is an improvement on the situation in March 2013 when the HSE was paying nine times the UK price (Sunday Business Post, 3 March 2013).
The new model is considered by Gorecki (2012) to be a radical step in the right direction but he points out that the legislation does not specify how the reference price will be set. The setting of the reference price is a critical issue in relation to the potential to achieve lower prices for generic products. Gorecki et al. (2012) proposed that, for high volume generic pharmaceuticals, the reference price should be set using a tendering process in which the winner would supply all of the pharmaceuticals for the period of the tender. Bidders would have an incentive to set as low a price as possible since the winner would gain all of the market. This would involve competition for the market.
Conclusion
Irish consumer prices continue to be relatively high: Eurostat estimates indicate that Irish consumer prices in 2012 (based on final household consumption) were 9.1 per cent above the EU (15) average and 6.8 per cent above the UK average. The price premium for goods is highest for alcohol and tobacco. While consumer prices remain on average higher in Ireland, this is not always the case. Apart from food, drink and tobacco, the Irish price level indices for the main goods categories in 2012 were either close to or below the EU (15) average, according to the Eurostat data. In 2012 the Eurostat figures indicate several categories of goods had below average prices in Ireland. A number of categories of consumer goods including clothing, footwear, furniture and household appliances have experienced double-digit percentage declines in average prices since 2008.
Ireland began to experience above average inflation from the late 1990s while in recent years it has been below average; prices fell in 2009 and 2010. Over the period 1999 to 2012, the average rate of inflation here was 0.3 percentage points above the euro area average. Ireland’s above average inflation has been stronger and more persistent for services than for goods. Services inflation was on average 1.4 percentage points above the euro area average over the period 1999 to 2012 while goods inflation was below the euro area average. Despite this, the price differential relative to the EU (15) in goods and services in 2012 was roughly the same at around 9 per cent in each case. However, one particular factor that affects the average price for goods is the exceptionally high level of Irish tobacco prices. Excluding this the underlying differential would be higher for services than for goods. Services that had above average prices in Ireland in 2012 included health, transport services and communications.
The experience of inflation varies with the pattern of expenditure. In recent years those whose expenditure is concentrated on essentials have experienced above average inflation.
Why are some consumer prices still relatively high in Ireland? Indirect taxes are a major component of some items of consumer expenditure. The high levels of alcohol and tobacco prices relative to the EU (15) average are not surprising in the light of the high taxes on these products in Ireland.
Leaving aside indirect taxes, the most obvious explanation of higher goods prices in Ireland would be higher operating costs faced by retailers (labour costs, rents, rates etc.). A Forfás study in 2008 estimated that retail operating costs in Dublin were on average 25 per cent higher than in Belfast. Taking account of the estimated share of retail operating costs in retail sales revenue, the Forfás study suggested that higher retail costs could explain a price difference of 5 to 6 per cent between Dublin and Belfast. The cost and price differential would now both be lower.
If retail operating costs appear unable to explain the extent of price differences, another possible explanation is that the cost of goods is higher. The cost of goods typically accounts for the largest part of the retail price of consumer goods. It is possible for the cost to retailers of the same goods to differ across countries. This arises from the practise by exporters of what is known as ‘pricing to market’. This means that exporters to a market vary the price in accordance with the perceived willingness of that market to pay. A report by the Competition Authority (2009) identified pricing to market as a significant component of exporters’ decisions.
for retailers would add significantly to the costs and prices of the producers of consumer services. Costs have fallen since Forfás undertook this work in 2008. Costs of producing goods that are domestically produced and sold are also relevant to higher consumer prices in Ireland.
Hourly labour costs for the business sector in Ireland are somewhat below the euro average. As such, differences in labour costs in themselves appear unable to explain why Irish consumer prices are on average higher than the EU (15) and euro area averages. However, Irish labour costs are considerably higher than the UK; the differential with the UK in terms of labour costs is greater than the price differential. The sharp fall in sterling since 2007 led to UK labour costs falling below those of most of the EU (15) member states.
Insofar as higher costs are a factor in above average prices here, this raises the further question as to why costs are higher here. The dispersed nature of Ireland’s population is a structural factor that adds to costs. Costs increased during the economic boom. Costs have fallen in recent years but the process is incomplete. Property and rental costs have fallen but some businesses will be locked into former higher prices, either through the purchase of property at higher prices or entering long-term leases at higher rental prices; the presence of upward only rent reviews is an obstacle to the downward movement of costs. These higher property costs become part of the cost base of some businesses (and some public bodies) and may be a factor in sustaining higher consumer prices. Beyond operating costs and the cost of goods, another major influence on consumer prices is the extent of competition. The intensity of competition varies across sectors in Ireland. In the grocery sector, the Competition Authority (2009) found a high level of concentration at both wholesale and retail level as a factor limiting the extent of price competition.
The report of the Competition Authority (2009) emphasised that prices depend on demand as well as supply, so that differences on the demand side can also lead to differences in consumer prices. One dimension of this is the phenomenon of pricing to market by exporters as discussed above. The strong demand in the boom years contributed to growth in prices. Consumer demand and disposable incomes have fallen sharply in recent years while Ireland’s relative price premium has also fallen. Irish consumers appear to have become more price sensitive in recent years.
Exchange rates have a significant influence on Ireland’s relative level of consumer prices especially in the short term. The weakening of sterling in 2008 and 2009 led to a substantial increase in the Irish and UK price difference initially: a weaker sterling meant that unchanged sterling prices in the UK became substantially lower in euro terms implying that in relative terms Irish prices increased. Subsequently the stronger euro had the effect of lowering import prices while the recession also reduced this differential.
Appendix:
Dublin Price € Belfast Price € using €1=0.85 Belfast Price £ Percentage Difference Breads
Brennans Sliced Pan White 800g 1.58 1.99 1.69 -20.5 Brennans Wholemeal 800g 1.87 1.87 1.59 0.0
Sub-total 3.45 3.86 3.28 -10.6
Biscuits/Sweets/Crisps
Cadbury Chocolate Fingers 125g 1.39 2.34 1.99 -40.6 Fox's Creams Ginger Crunch 168g 1.99 1.28 1.09 55.2 Tayto Cheese and Onion 6 x 25g 2.27 1.91 1.62 19.1 Pringles Original 190g* 2.50 2.92 2.48 -14.3
Sub-total 8.15 8.45 7.18 -3.5
Baby
Cow & Gate First Infant Milk Ready to Feed 200ml 0.75 0.73 0.62 2.8 SMA infant milk from birth 900g 10.98 10.42 8.86 5.3 Johnson’s Baby Lotion 500 ml 3.67 3.06 2.60 20.0 Farley’s Rusks 4 Month Original 18 pk 2.39 1.75 1.49 36.3 Johnson’s Baby Powder 200g 1.48 1.45 1.23 2.3 Johnson’s Baby Gold Shampoo 300ml 2.45 1.99 1.69 23.2 Pampers Nappies Baby Dry 3 Midi Carry Pack 36 * 7.00 6.47 5.50 8.2
Sub-total 28.72 25.87 21.99 11.0
Household
Fairy Washing Up Liquid Original 870ml 2.99 2.35 2.00 27.1 Fairy Dishwasher tablets Lemon (all in one) 24 pk* 9.79 10.12 8.60 -3.2 Domestos Bleach Blue Original 750ml* 1.49 1.18 1.00 26.7 Cillit Bang Power Cleaner Grime & Lime Spray 750ml* 2.29 2.06 1.75 11.2 Quilted Velvet Toilet Tissue 4 Roll* 2.39 2.74 2.33 -12.8 Cushelle Toilet Tissue 9 roll 5.45 4.41 3.75 23.5
Sub-total 24.40 22.86 19.43 6.7
Fresh Food
Yoplait Strawberry Yogurt x 4* 2.00 1.75 1.49 14.1
Stork margarine 250g 0.89 0.81 0.69 9.6
Philadelphia Cheese 200g* 1.50 2.06 1.75 -27.1 Denny Delicatessen Style Cooked Ham 180g* 3.99 2.35 2.00 69.6 Alpro Light Soya Fresh Milk Alternative 1.65 1.52 1.29 8.7
Sub-total 10.03 8.49 7.22 18.1
Frozen Foods
McCain Rustic Oven Chips 1 kg 2.99 2.06 1.75 45.2 Donegal Catch Cod 450g* 3.50 5.87 4.99 -40.4
Dublin Price € Belfast Price € using €1=0.85 Belfast Price £ Percentage Difference Petshop
Pedigree Original in Loaf Dog Food - Tin 400g 0.89 0.71 0.60 26.1 Cesar Turkey and Lamb 150g 0.95 0.81 0.69 17.0 Whiskas Chicken in Jelly -Tin 390g 0.97 0.69 0.59 39.7
Sub-total 2.81 2.21 1.88 27.0
Cereals
Kellogg’s Cornflakes 500g 2.82 2.46 2.09 14.7
Weetabix 24 pk 3.49 2.81 2.39 24.1
Kellogg’s Rice Krispies 510g 3.79 3.28 2.79 15.5 Flahavan’s Progress Oatlets 1kg 2.29 2.65 2.25 -13.5 Kellogg’s Bran Flakes 500g 2.89 2.46 2.09 17.5 Nestlé Shredded Wheat 30's 675g 3.85 3.75 3.19 2.6
Sub-total 19.13 17.41 14.80 9.9
Health and Beauty
Lynx Africa - Shower Gel 250ml* 2.00 2.82 2.40 -29.2 Dove Shampoo Daily Care 2 in 1 250ml* 1.84 1.58 1.34 16.7 Head and Shoulders Classic Clean Shampoo 250ml 3.89 3.52 2.99 10.6 Dove Original Roll On 50 Ml* 2.64 1.29 1.10 104.0 Tampax Pearl Regular 20 pk 3.89 3.52 2.99 10.6
Sub-total 14.26 12.73 10.82 12.0
General Grocery
Uncle Ben's Basmati Rice 500g* 2.59 2.18 1.85 19.0 Coleman's English Mustard Jar 100g 1.05 1.11 0.94 -5.1 Knorr The Beef Cube 8 pk 80g 1.99 1.96 1.67 1.3 Heinz Tomato Ketchup 342g (squeezy) 2.72 1.41 1.20 92.7
Saxa Table Salt 750g 1.49 1.00 0.85 49.0
Heinz Baked Beans 415g x 4 3.49 2.94 2.50 18.7
Sub-total 13.33 10.60 9.01 25.8
Beverages
Coca Cola 2 Litre 2.29 2.33 1.98 -1.7
7 Up Lemon and Lime 2 Litre 2.39 2.33 1.98 2.6
Club Orange 2 Litre* 2.39 1.18 1.00 103.2
Nescafe Gold Blend Coffee 200g 7.99 7.62 6.48 4.8 Cadbury Fairtrade Drinking Chocolate* 2.50 2.35 2.00 6.3
Sub-total 17.56 15.81 13.44 11.1
Totals 148.33 136.22 115.79 8.9
Totals (without special offers) 97.92 87.31 74.21 12.2
Bibliography
Alessandria, G. & Kaboski, J. P. (2011), 'Pricing-to-Market and the Failure of Absolute PPP', American
Economic Journal:
Macroeconomics, 3(1): 91-127.
Bermingham, C., Coates, D., Larkin, J., O’Brien, D. & O’Reilly, G. (2012), Explaining Irish Inflation During the Financial Crisis, Central Bank Research Technical Paper, 9/RT/12, Dublin: Central Bank of Ireland.
http://www.centralba nk.ie/publications/doc uments/09rt12.pdf. Brick, A., Gorecki, P.K. & Nolan, A. (2013), Ireland:
Pharmaceutical Prices, Prescribing Practices and Usage of Generics
in a Comparative
Context, ESRI
Research Series Number 32, Dublin: Economic Social Research Institute. Competition Authority (2009), Retail-related
Import and
Distribution Study,
Dublin: The
Competition Authority.
Estrada, A., Gali, J. & Lopez-Salido, D. (2012), 'Patterns of Convergence and Divergence in the Euro Area', Presentation to "13th Jacques Polak Annual Research Conference",
Washington DC, 8/9 November.
Eurostat (2012), Eurostat–OECD
Methodological Manual on Purchasing
Power Parities,
Luxembourg:
Publications Office of the European Union. Forfás (2008), The Cost of Running Retail Operations in Ireland, Dublin: Forfás.
Forfás (2013a), Costs of Doing Business in Ireland 2012, Dublin: Forfás.
Forfás (2013b), Review
of the Economic
impact of the Retail Cap, Dublin: Forfás.
Gorecki, P. (2012), ‘Behind the Headlines: Will Drug Prices Fall?’,
Quarterly Economic
Commentary, Winter, Dublin: Economic and Social Research Institute.
Gorecki, P., Nolan, A., Brick, A. & S., Lyons (2012), Delivery of
Pharmaceuticals in
Ireland: Getting a Bigger Bang for the Buck, ESRI Research Series No. 24, Dublin: Economic and Social Research Institute. Gros, P. (2001), The Irish Inflation and Price Differential in Euroland, EP Briefing Paper, February. Guerreiro, D. & Mignon, V. (2011), On Price Convergence in
the Eurozone,
University of Paris Ouest Working Paper 2011-34.
McGettigan, D. (1997), 'Inflation in Ireland: Theory and Evidence',
Journal of the
Statistical and Social Inquiry Society of Ireland, XXVII(IV): 157-203.
Leddin, A.J. & Walsh,
B. (2013),
Macroeconomics: An Irish and European Perspective, Dublin: Gill and Macmillan. MacCoille, C. & McCoy, P. (2012), 'Economic Adjustment Within EMU: Ireland’s Experience', Economic and Social Review, 33(2): 179-193.
Agency (2008), ‘Branded Goods Much More Expensive than in Northern Ireland Market’. http://corporate.nca.i e/eng/Media_Zone/ne ws-archive/news- 2008-2/Branded_goods_mo re_expensive_in_Sout h.html, 24/10/2013. National Consumer Agency (2013), Prescription Medicines
Price Survey.
http://corporate.nca.i e/eng/Research_Zone /price- surveys/Prescription- medicines-prices-study-25-march-2013, 24/10/2013.
& Gas Prices in Ireland: 2nd Semester (July–December) 2012. http://www.seai.ie/Pu blications/Statistics_P ublications/EPSSU_Pu blications/Price_Direct ive_2nd_Semester_20 12_.pdf, 13/11/13. Vincentian