Classical activation of microglia in CD200-deficient mice is a
consequence of blood brain barrier permeability and infiltration
of peripheral cells
Stephanie Denieffe
1, Ronan J. Kelly
1, Claire McDonald, Anthony Lyons, Marina A. Lynch
⇑Trinity College Institute for Neuroscience, Trinity College, Dublin 2, Ireland
a r t i c l e
i n f o
Article history: Received 29 May 2013
Received in revised form 22 July 2013 Accepted 29 July 2013
Available online xxxx
Keywords: CD200
Blood brain barrier permeability Inflammation
Microglial activation Lipopolysaccharide Claudin
a b s t r a c t
The interaction between CD200, expressed on several cell types, and its receptor CD200R, expressed on cells of the myeloid lineage, has been shown to be an important factor in modulating inflammation in macrophage function in several conditions including colitis and arthritis. More recently its modulatory effect on microglial activation has been identified and CD200-deficiency has been associated with increased microglial activation accompanied by increased production of inflammatory cytokines. The response of glia prepared from CD200-deficient mice to stimuli like lipopolysaccharide (LPS) is markedly greater than the response of cells prepared from wildtype mice and, consistent with this, is the recent observation that expression of Toll-like receptor (TLR)4 and signalling through NFjB are increased in microglia prepared from CD200-deficient mice. Here we show that glia from CD200-deficient mice are also more responsive to interferon-c(IFNc) which triggers classical activation of microglia. We investi-gated the effects of CD200-deficiencyin vivoand report that there is an increase in expression of several markers of microglial activation including tumor necrosis factor (TNF)-a, which is a hallmark of classi-cally-activated microglia. These changes are accompanied by increased IFNc, and the evidence suggests that this is produced by infiltrating cells including T cells and macrophages. We propose that these cells enter the brain as a consequence of increased blood brain barrier (BBB) permeability in CD200-deficient mice and that infiltration is assisted by increased expression of the chemokines, monocyte chemotactic protein-1 (MCP-1), IFNc-induced protein-10 (IP-10) and RANTES. This may have implications in neurode-generative diseases where BBB permeability is compromised.
Ó2013 Elsevier Inc. All rights reserved.
1. Introduction
Microglia, like macrophages, are plastic cells, responding to dif-ferent stimuli by adopting difdif-ferent morphological and functional phenotypes indicative of their broad array of functions (Lynch, 2009). These cells are the immune cells of the brain and therefore respond to pathogen-associated, and danger-associated, molecular patterns which trigger the responses that result from insult. An acute stimulus generally induces release of inflammatory media-tors, but this relatively brief inflammatory state is followed by res-toration of microglia to their resting state. In contrast, exposure of cells to chronic activation is undesirable and can result in damage to neighboring cells.
A number of endogenous mechanisms ensure that microglial activation is kept in check and these include the interaction with other cells through ligand–receptor binding. Among the
ligand–receptor pairs is CD200–CD200R which has complementary cell expression patterns characteristic of this method of controlling microglial activation. Thus CD200 is expressed on several cell types including neurons (Lyons et al., 2007a; Webb and Barclay, 1984) and astrocytes (Costello et al., 2011) whereas CD200R is expressed primarily on cells of the myeloid lineage and on microglia in the brain (Barclay et al., 2002; Koning et al., 2009). The evidence has indicated that decreased expression of CD200, which occurs with age (Cox et al., 2012; Frank et al., 2006), Ab treatment (Lyons et al., 2007a) or in the brain of AD patients (Walker et al., 2009), is associated with the type of microglial activation that is charac-terized by inflammatory changes (Colton and Wilcock, 2010). At least in some cases, these inflammatory changes are attenuated by a CD200 fusion protein (CD200Fc) which stimulates CD200R activation (Cox et al., 2012; Lyons et al., 2012), although the evi-dence indicates that the reversal is incomplete.
We have recently shown that glial cells prepared from CD200 /
mice respond more profoundly to Toll-like receptor (TLR) agonists, specifically lipopolysaccharide (LPS) which interacts with TLR4, and Pam3CSK4 which interacts with TLR2 (Costello et al., 2011);
0889-1591/$ - see front matterÓ2013 Elsevier Inc. All rights reserved.
http://dx.doi.org/10.1016/j.bbi.2013.07.174
⇑ Corresponding author. Tel.: +353 1 896 8531; fax: +353 1 896 3545. E-mail address:[email protected](M.A. Lynch).
1 These authors contributed equally to the work.
Contents lists available atScienceDirect
Brain, Behavior, and Immunity
j o u r n a l h o m e p a g e : w w w . e l s e v i e r . c o m / l o c a t e / y b r b i
per-expression of both receptors was increased on microglia prepared from CD200 / mice, compared with wildtype mice, and this was
associated with a genotype-related increase in signaling through NF
j
B. Thus the loss of CD200 in CD200-deficient mice is accompa-nied by a number of changes that play a role in modulating microg-lial activation.In the present study, we set out to evaluate the changes that accompany the loss of CD200in vivowith the objective of increas-ing our understandincreas-ing of the mechanisms that modulate microglial function. First, we showed that interferon (IFN)-
c
, which induces a classically-activated microglial phenotype exerted a greater effect in cultured cells from CD200 / , compared with wildtype, mice.In vivo, CD200 deficiency was associated with increased expression of markers of microglial activation including tumor necrosis factor (TNF)-
a
, which is a hallmark of classically-activated microglia, in the absence of any stimulus. Increased expression of IFNc
was ob-served in hippocampus of CD200 / mice, although it is generallyconsidered that IFN
c
is not produced by resident cells in the brain (Lynch, 2010; Renno et al., 1995). The probable explanation for this is that there was a significant infiltration of T cells and macro-phages into the brain of CD200 / mice, and the data suggest thatcell infiltration is a consequence of the increase in blood brain bar-rier (BBB) permeability and increased expression of the chemo-kines, monocyte chemotactic protein-1 (MCP-1), IFN
c
-induced protein-10 (IP-10) and RANTES (also known as CCL5).The data highlight the consequences of infiltration of peripheral immune cells on microglial function and suggest that the inflam-matory changes which occur in neurodegenerative diseases might be modulated by targeting the BBB.
2. Methods
2.1. Animals
C57BL/6 mice (wildtype) and CD200-deficient mice were used in this study. Mice were bred in an SPF housing facility in the Bio-Re-sources Unit, Trinity College, Dublin and were maintained under vet-erinary supervision in a controlled environment (12-hour light-dark cycle; 22–23°C) for the duration of the experiment. In one series of experiments, wildtype mice were anaesthetized with urethane (1.5 g/kg; Sigma Aldrich; IRE) and injected with IFN
c
(5l
l @ 1l
l/ min; 50 ng/ml; R&D Systems, UK; co-ordinates: 0.34 mm caudal and 1 mm lateral to bregma, at a depth of 2.1 mm. After 3 h, animals were perfused intracardially with ice-cold PBS (20 ml). In all experi-ments, the brain was rapidly removed and placed on ice, the cerebel-lum, brain stem, olfactory lobes and hippocampus were removed and the remaining tissue was taken to prepare a single cell suspension for flow cytometric analysis as described below. Animal experimenta-tion was performed under a licence granted by the Minister for Health and Children (Ireland) under the Cruelty to Animals Act 1876 and the European Community Directive, 86/609/EEC, and in accordance with local ethical guidelines.2.2. MRI analysis to assess BBB permeability and blood flow
MRI analysis, to assess extravasation of the gadolinium-based contrast agent, gadopentate dimeglumine (Magnevist; Clissmann, Ireland) as an indicator of BBB permeability, was carried out on a small rodent Bruker Biospec (Bruker Biospin, Germany) system with a 7 Tesla magnet and a 30 cm core. Anaesthesia was induced and maintained using isoflurane (5% in 100% O2and 1.5–2% at 1 l/
min of 100% O2,respectively). Respiration rate was monitored and
body temperature was controlled throughout.
Mice were placed into an MR-compatible cradle and positioned in a stereotaxic frame. The right lateral tail vein was cannulated
using a 30 gauge in-dwelling, paediatric intravenous cannula nee-dle (Introcan, Ireland) to which an 80 cm long polyethylene tubing cannula extension, connected to a 3-way tap, was attached; this al-lowed delivery of contrast agent (200
l
l/mouse) without disturb-ing the animals and enabled pre- and post-contrast measurements to be determined within the same contrast scan. Contrast imaging was carried out using a 10 repetition T1-weightedfast low angle shot (FLASH) sequence; the repetition duration was 2 min, 11 s and the 15-slice protocol had dimensions of 128128 voxels per slice. Pre-contrast measurements were ac-quired on the first repetition of the scan to provide a contrast-free baseline after which the contrast agent was injected; the following 9 scan repetitions recorded the passage of the bolus throughout the brain. Gadolinium-enhanced contrast images acquired from the BBB permeability studies were analysed in the MIPAV software package. The average signal intensity changes in each treatment group were plotted against repetition. Anatomically-distinct ROIs, viewed in the first repetition, were overlaid with a 22 voxel square and the average pre-contrast intensity was measured. The ROI squares were copied into the same locations in the remaining 9 repetitions for each mouse brain, measuring the contrast change following injection of the gadolinium-based contrast agent at the commencement of the second repetition. Values for each data set were normalised to the pre-contrast measurement and expressed as a proportion of the pre-contrast value.
Quantitative blood flow and volume measurements were inves-tigated using a bolus-ASL methodology (Kelly et al., 2010). This method uses a bolus-tracking ASL sequence to provide groups of 11 one slice images on a single time curve following the passage of a 3 s bolus through the imaging slice. Control and labelled images were created for wildtype and CD200-deficient mice and corresponding pairs were subtracted to provide perfusion-weighted maps. Mean values for cortical and hippocampal ROIs, manually drawn on perfusion-weighted images, were plotted against the acquisition time point in the bolus tracking ASL se-quence. The curve was fitted to the solution of the non-compart-mental cerebral perfusion ASL model (Kelly et al., 2009), and the curve-fitting utility in Mathematica was used to find the least squares fit to the experimental curves. The mean transit time (MTT) and capillary transit time (CTT) were calculated from the first and second statistical moments of the signal-time curves, respectively.
Following MRI scanning, animals were anaesthetised with ure-thane (1.5 g/kg; Sigma Aldrich; IRE) and perfused intracardially with ice-cold PBS (20 ml). The brain was rapidly removed and placed on ice, the cerebellum and olfactory bulbs were removed and the brain was bisected along the midline. The hippocampus was dissected free and snap-frozen in liquid nitrogen, for later analysis by PCR and/or ELISA, and the remaining brain tissue was used to prepare a single cell suspension for analysis by flow cytometry.
2.3. Preparation of cultured glia
Mixed glial cells were prepared from 1 day-old wildtype and CD200 / mice (BioResources Unit, Trinity College, Dublin, Ireland)
as described (Costello et al., 2011). To prepare mixed glia, whole brain minus cerebellum was roughly chopped, added to pre-warmed Dulbecco’s modified Eagle medium (DMEM; Gibco BRL, Ireland) containing 10% foetal bovine serum, penicillin (100 U/ ml) and streptomycin (100 U/ml), triturated and filtered through a sterile mesh filter (70
l
m). Samples were centrifuged (2000g, 3 min, 20°C), the pellet was resuspended in warmed DMEM, cells were seeded in 6 ml flasks (1106cells/flask) and incubated for2 h before addition of warmed DMEM. Cells were grown for 10– 12 days at 37°C in a humidified 5% CO2:95% air environment and
per-media was changed every 3 days. Mixed glia were approximately 70% astrocytes and 30% microglia (Costello et al., 2011). Purified microglia were harvested by shaking off (110 rpm, 2 h, room tem-perature) the non-adherent cells from the mixed cultures which had been cultured for 10–12 days. Samples were centrifuged (2000 rpm, 5 min), the pellet was resuspended in cDMEM, the microglia were plated onto 6-well plates (2105cells/ml) and
cells were maintained at 37°C in a 5% CO2humidified atmosphere
for up to 3 days prior to treatment. Cells, which were 97% CD11b+
as assessed by FACS, were incubated for 24 h in the presence or ab-sence of IFN
c
(50 ng/ml; R&D Systems, UK).2.4. Analysis of mRNA by PCR
RNA was isolated from hippocampal tissue and from cultured cells using NucleospinÒ RNAII KIT (Macherey-Nagel, Duren,
Ger-many) and cDNA was prepared using High-Capacity cDNA RT kit according to the manufacturer’s instructions (Applied Biosystems, UK). Real-time PCR was performed with predesigned Taqman gene expression assays (Applied Biosystems, UK). The assay IDs were as follows: CD11b (Mm01271263_ml), MHCII (Mm00439221_m1), CD40 (Mm0041895 _ml), MCP-1 (Mm00441242_m1), IP-10 (Mm00445235_m1), RANTES (CCL5; (Mm01302428_m1), MIP-1
a
(CCL3; Mm00441258_m1), claudin 5 (Mm00727012_ml), TNFa
(Mm0043258_m1), iNOS (Mm00440502_m1), IL-6 (Mm00446191 _m1), mannose receptor (MR; Mm00485148_m1) and arginase-1 (Arg-1; Mm00475988_m1). Samples were assayed on an Applied Biosystems 7500 Fast Real-Time PCR machine and gene expression was calculated relative to the endogenous control samples (b-actin) to give a relative quantification (RQ) value (2 DDCT, where CT isthreshold cycle).
2.5. Flow cytometry
Flow cytometry was carried out on cells prepared from brain using a 5-layer Percoll gradient to obtain mononuclear cells, as de-scribed (Costello et al., 2011). Cells were washed 3 times with FACS buffer (2% FBS, 0.1% NaN3in PBS), blocked for 15 min at room
tem-perature with mouse CD16/CD32 Fc
c
RIII block (1:100 in FACS buf-fer; BD Biosciences, UK) and incubated with APC-Cy™7 rat mouse CD11b, PE-Cy™7 rat mouse CD45, PerCP rat mouse CD8a, PeCy™7 rat mouse CD4, FITC hamster anti-mouse CD40, PE rat anti-anti-mouse MHCII (all BD Biosciences, UK), Alexa Fluor 488 rat anti-mouse CD68 (AbD Serotec, UK), PE ham-ster anti-mouse CD119 (IFN gamma Receptor 1 (IFNGR1; eBio-science, UK), APC rat mouse CD3 and PerCP/Cy5.5 rat anti-mouse CD86 (Biolegend, UK), diluted (1:200) in FACS buffer. Immunofluorescence analysis was performed on a DAKO CyAn-ADP 7-colour flow cytometer (DAKO Cytomation, UK) with Summit version 4.3 software and data analysis was carried out using FlowJo v7.6.5 software. Microglia and macrophages were identified as CD11b+CD45lowand CD11b+CD45highcells, respectively. CD4+andCD8+T cells were initially gated on CD45 and subsequently on
CD3, and CD4 or CD8.
2.6. Western immunoblotting
[image:3.595.115.490.397.679.2]Hippocampal lysate or lysate prepared from cultured cells was assessed for the expression of IFN
c
, IFNGR1 or pSTAT1 using stan-dard Western immunoblotting methods; the membranes were incubated overnight in the presence of the primary antibodies, IFNc
(R&D, UK; 1:1000 in TBS containing 0.05% Tween and 2.5% dried non-fat milk), IFNc
Ra
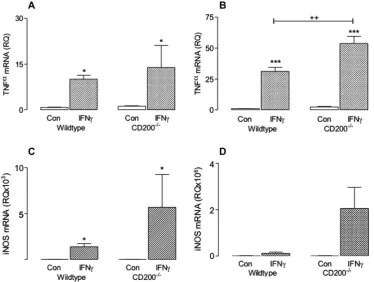
(IFNGR1; Santa Cruz, US; 1:200 inFig. 1.IFNcinduced markers of classical activation in microglia prepared from wildtype and CD200 /
mice. Mixed glial cells, prepared from 1 day-old wildtype and CD200 / mice, were grown for 10–12 days at 37°C in a humidified 5% CO2:95% air environment and media was changed every 3 days. Purified microglia were obtained by shaking off the non-adherent cells from the mixed cultures (110 rpm, 2 h, room temperature), centrifuging (2000 rpm, 5 min), resuspending in cDMEM and plating onto 6-well plates (2105
cells/ml) and cells were maintained at 37°C in a 5% CO2humidified atmosphere for 1–3 days. Cells were incubated for 24 h in the presence or absence of IFNc(50 ng/ ml; R&D Systems, UK). IFNcincreased TNFamRNA in mixed glia (A) and purified microglia (B) prepared from wildtype and CD200/
mice; a significant treatment effect was observed in the case of mixed glia (F(1,9) = 10.41;⁄
p< 0.05) and a significant interaction between treatment and genotype was observed in the case of purified microglia (F(1,20) = 10.13;⁄⁄
p= 0.01). iNOS2 mRNA was increased in response to IFNcin mixed glia (C) and purified microglia (D) prepared from wildtype and CD200 / mice; a significant treatment effect was observed for mixed glia (F(1,8) = 10.55;⁄
p< 0.05). Values are presented as means ± SEM.
per-TBS containing 0.05% Tween and 2.5% dried non-fat milk) and pSTAT1 (Cell Signaling, Ireland; 1:1000 in TBS containing 0.05% Tween and 2.5% dried non-fat milk) and subsequently in peroxi-dase-conjugated secondary antibody for 2 h. Membranes were washed and protein complexes were visualized using enhanced chemiluminescence. Membranes were stripped (Re-blot plus; Chemicon, US) and reprobed for b-actin. Images were captured using a Fijifilm LAS-4000 imager, and densitometric analysis was used to quantify expression of the proteins.
2.7. Analysis of cytokine expression by ELISA
The concentrations of IFN
c
, TNFa
and IL-6 were assessed by ELI-SA in hippocampal tissue or supernatant from glial cultures as pre-viously described (Lyons et al., 2007a). In brief, 96-well plates were coated overnight with capture antibody (rat anti-mouse IL-6 (2l
g/ ml in PBS; BD Biosciences, UK), goat anti-mouse TNFa
antibody (0.8l
g/ml in PBS; BD Biosciences, UK)), or rat anti-mouse IFNc
(4l
g/ml in PBS; R&D Systems). Triplicate samples and standards (50l
l) were added, plates were incubated (2 h, room tempera-ture), washed and detection antibody (100 ng/ml biotinylated anti-mouse TNF-a
or biotinylated anti-mouse IL-6 in PBS contain-ing 10% FBS or biotinylated goat anti-mouse IFNc
in TBS containing 0.1% bovine serum albumin and 0.05% Tween-20; R&D Systems, UK) was added. Samples were incubated with streptavidin–horse-radish peroxidase conjugate (100l
l; 1:200; 20 min, room temper-ature) and washed before addition of substrate solution (100l
l; 1:1 H2O2:tetramethylbenzidine; R&D Systems, US). After colourdevelopment, the reaction was stopped by adding 50
l
l 1 M H2SO4and plates were read at 450 nm (Labsystem Multiskan RC,UK). The limits of detection for IFN
c
, TNFa
and IL-6 were 0.38 pg/ml, 4.3 pg/ml and 10 pg/ml, respectively.2.8. Statistical analysis
Data are expressed as means ± standard error of mean (SEM). Two-way analysis of variance (ANOVA) was performed to deter-mine whether significant differences existed between conditions. Two-tailed unpaired Studentst-tests were also performed, where indicated, to compare treatment groups; significance was set as p< 0.05. All statistical analyses were carried out using GraphPad Prism.
3. Results
Classical activation of macrophages is identified by increased expression of TNF
a
and iNOS and their upregulation is designed to reinforce the initial innate immune response (Colton, 2009). The data presented here show that IFNc
(50 ng/ml) increased TNFa
mRNA in mixed glia (Fig. 1A) and purified microglia (Fig. 1B) pre-pared from wildtype and CD200 / mice (F(1,9) = 10.41; ⁄p< 0.05;F(1,20) = 150.3,⁄⁄⁄
p< 0.001; 2-way ANOVA). In purified microglia, a significant interaction between IFN
c
treatment and CD200-deficiency was observed (++p< 0.01). IFNc
also increasediNOS mRNA expression in mixed glia (Fig. 1C) prepared from wild-type and CD200 / mice (F(1,8) = 10.55,⁄p< 0.05) and although the
effect was greater in purified microglia prepared from CD200 / ,
compared with wildtype, mice, this did not reach statistical signif-icant (F(1,17) = 14.37,p= 0.058). IFN
c
increased release of TNFa
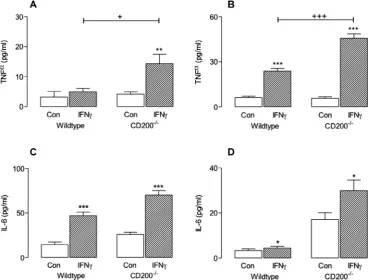
and IL-6 from mixed glia (Fig. 2A and C) and purified microglia (Fig. 2B and D) prepared from wildtype and CD200 / mice; asig-Fig. 2.IFNc-induced TNFaand IL-6 release was enhanced in mixed glia and purified microglia prepared from CD200 /
mice. Cells (mixed glia and purified microglia) were prepared as described in the Methods and in the legend toFig. 1. IFNcincreased supernatant concentrations of TNFa(A and B) and IL-6 (C and D) in mixed glia (A and C) and purified microglia (B and D) prepared from wildtype and CD200 /
mice. A significant interaction between treatment and genotype was observed in the case of TNFa
(F(1,13) = 5.086;p< 0.05 for mixed glia andF(1,20) = 31.81;⁄⁄⁄
p< 0.001 for purified microglia). In the case of IL-6, significant treatment (F(1,12) = 119.0;⁄⁄⁄
p< 0.001 and F(1,14) = 4.804;⁄
p< 0.05) and genotype (F(1,12) = 24.21;⁄⁄⁄
p< 0.001 andF(1,14) = 38.13;⁄⁄⁄
p< 0.001) effects were observed for mixed glia and microglia, respectively. Values are presented as means ± SEM.
[image:4.595.109.480.415.695.2]per-nificant interaction between genotype and treatment was ob-served in the case of TNF
a
(A: F(1,13) = 5.086; +p< 0.05; B:F(1,20) = 31.81; +++p< 0.001) and significant treatment (C: F(1,12) = 119.0; ⁄⁄⁄p< 0.001; D: F(1,14) = 4.804; ⁄p< 0.05) and
genotype (C: F(1,12) = 24.21; p< 0.001; D: F(1,14) = 38.13; p< 0.001) effects were observed in the case of IL-6. Overall, CD200 / mice display an enhanced response to IFN
c
and suggesta role for CD200 in modulating the classical activation pathway. Interestingly, when unstimulated IL-6 concentration was extracted and compared in cells from wildtype and CD200 / mice, a
signif-icantly greater concentration was observed in cells prepared from CD200 / , compared with wildtype, mice (p< 0.05 andp< 0.01 for
isolated microglia and mixed glia, respectively; student’st-test for independent means). We also examined the effect of IFN
c
on >95% purified astrocytes from wildtype and CD200 / mice and nogeno-type-related changes were observed (data not shown).
To explore the possible mechanism underlying the increased responsiveness of glia prepared from CD200 / mice to IFN
c
, theexpression of IFNGR1 was assessed. Flow cytometric analysis indi-cated that the number of IFNGR1+CD11b+cells was increased in
cell preparations obtained from CD200 / , compared with
wild-type, mice (F(1,12) = 12.27;⁄⁄p< 0.01; 2-way ANOVA;Fig. 3A and
B). In addition, IFN
c
significantly increased STAT1 phosphorylation in glia prepared from CD200 / mice; a significant interactionbe-tween genotype and treatment was observed (F(1,9) = 63.34,
+++
p< 0.001;Fig. 3C).
In contrast to the differential genotype-related effect of IFN
c
, IL-4, which induces alternative activation of macrophages and microglia (Colton et al., 2006; Gordon and Martinez, 2010), signif-icantly increased expression of 2 hallmarks of alternative activa-tion, arginase-1 mRNA and mannose receptor mRNA albeit to the same extent in mixed glia prepared from wildtype and CD200 /mice (data not shown). These results demonstrate the specific nat-ure of the modulatory effect of CD200 on classically-induced acti-vation of microglia.
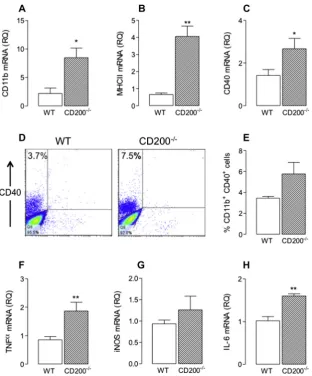
To examine the effect of CD200 deficiency on microglial activa-tionin vivo, hippocampal tissue was assessed for expression of 3 markers of activation, CD11b mRNA, CD40 mRNA and MHCII mRNA, and cells were prepared from brain tissue to investigate expression of CD40 on CD11b+cells. The data indicate that mRNA expression of
CD11b, CD40 and MHCII was significantly increased in hippocam-pal tissue prepared from CD200 / , compared with wildtype, mice (⁄p< 0.05;⁄⁄p< 0.01;Fig. 4A–C). However since there was an
in-crease in macrophage infiltration, these changes could also be indicative of increased macrophage activation. The finding that the percentage of CD11b+CD40+CD45lowcells was doubled in
tis-sue prepared from CD200 / , compared with wildtype, mice is
indicative of microglial activation rather than macrophage activa-tion (Fig. 4D and E). The evidence suggested that microglia adopted the classical phenotype since mRNA expression of TNF
a
, iNOS and IL-6 was increased in the hippocampus of CD200 / mice comparedwith wildtype mice (⁄
p< 0.05;⁄⁄
p< 0.01; Student’st-test for inde-pendent means;Fig. 4F–H). Hippocampal concentrations of TNF
a
in WT and CD200-deficient mice were 2.55 pg/mg (±0.01, SEM) and 4.69 (±1.67), respectively and IL-6 in WT and CD200-deficient mice were 4.32 (±1.56 SEM) and 17.93 (±3.57), respectively (p< 0.05; studentst-test for independent means).Since IFN
c
triggers the classical activation state, it was impor-tant to assess hippocampal concentration of the cytokine. We dem-onstrate that IFNc
concentration was significantly increased in hippocampus prepared from CD200 / , compared with wildtype,mice (⁄p< 0.05;⁄⁄p< 0.01; student’st-test for independent means;
Fig. 5A) and this was confirmed by showing increased IFN
c
expres-sion in hippocampal tissue using Western immunoblotting (⁄p< 0.05; student’st-test for independent means;Fig. 5B). Addi-tionally, there was a significant increase in expression of IFNGR1
as revealed by Western immunoblotting (⁄p< 0.05; student’st-test
for independent means;Fig. 5C); whereas the cells expressing this receptor was not assessed in this study, the data inFig. 3indicate increased expression on microglia from CD200 / , compared with
wildtype, mice. The cell source of IFN
c
which is responsible for the increase in brain tissue remains to be established, but we have been unable to detect its presence in cultured glia or neuronsFig. 3.CD200 deficiency is associated with upregulation of IFNcreceptor 1 and signalling. Purified microglia were prepared as described in the Methods and in legend toFig. 1. Cells were washed and blocked and incubated with antibodies including APC-Cy™7 rat anti-mouse CD11b and PE hamster anti-mouse CD119 (IFN gamma Receptor 1; eBioscience, UK; see Methods for details). (A and B) Flow cytometric analysis revealed that the percentage of CD11b+IFNGR1+cells was increased in cells prepared from CD200 /, compared with wildtype, mice; a significant genotype effect was observed (F(1,12)=12.27,⁄⁄
p< 0.01). (C) Microglia were incubated for 24 h in the presence or absence of IFNc(50 ng/ml), cells were harvested and lysate was assessed by Western immunoblotting for analysis of STAT1 phosphorylation. A sample immunoblot reveals that IFNcincreased STAT1 phosphorylation in cells prepared from CD200 /
, compared with wildtype, mice and analysis of the densitometric data indicated a significant interaction between treatment and genotype (F(1,9) = 63.34; ⁄⁄⁄
p< 0.001). Values are presented as means ± SEM.
[image:5.595.337.538.163.619.2]per-Fig. 4.The expression of CD11b, MHC class II and CD40 was increased in the hippocampus of CD200 /
mice. Real-time PCR was performed on cDNA prepared from hippocampal tissue of wildtype and CD200-deficient mice. Details of the predesigned Taqman gene expression assays are given in the Methods. Gene expression was calculated relative to the endogenous control samples (b-actin) to give a relative quantification (RQ) value (2DDCT, where CT is threshold cycle). Expression of CD11b (A), MHC II (B) and CD40 (C) was significantly increased in the hippocampus of CD200 /
mice compared with wildtype mice (⁄ p< 0.05;⁄⁄
p< 0.01; Student’sttest for independent means). (D and E) Cells, prepared for flow cytometry as described in the Methods, were incubated with antibodies including APC-Cy™7 rat anti-mouse CD11b, PE-Cy™7 rat anti-mouse CD45 and FITC hamster anti-mouse CD40. Representative FACS plots for CD11b+
cells expressing CD40 from wildtype and CD200 /
mice demonstrate there was an apparent increase in CD40 expression on CD11b+
cells prepared from CD200 /
, compared with wildtype, mice, however this failed to reach statistical significance. mRNA expression of TNFa(F), iNOS (G) and IL-6 (H) was significantly increased in the hippocampus of CD200/
mice compared with wildtype mice (⁄ p< 0.05;⁄⁄
[image:6.595.136.449.74.451.2]p< 0.01; Student’st test for independent means). Values are presented as means ± SEM (n= 4–6).
Fig. 5.IFNcand IFNcreceptor 1 expression was increased in the hippocampus of CD200/
mice. (A) IFNcconcentration was assessed by ELISA in samples of hippocampal homogenate prepared from CD200 /
and wildtype mice. IFNcconcentration was increased in samples prepared from CD200 /
, compared with wildtype, mice (⁄ p< 0.05; Studentst-test for independent means). (B) IFNcwas also assessed in hippocampal lysate prepared from these animals and the sample immunoblot and mean data from densitometric analysis revealed a significant genotype-related difference (⁄
p< 0.05; Studentst-test for independent means). (C) Similarly, the sample immunoblots and the mean data from densitometric analysis revealed that IFNcreceptor 1 was significantly increased in tissue from CD200/
, compared with wildtype, mice (⁄
p< 0.05; Students t-test for independent means). Values are presented as means ± SEM (n= 4–6).
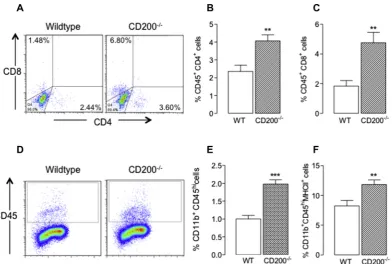
[image:6.595.105.472.558.697.2]per-suggesting that infiltrating cells may be the source. IFN
c
is primar-ily produced in, and released from, immune cells and we have pre-viously reported that infiltrating CD3+CD4+and CD3+CD8+cells inmice that overexpress amyloid precursor protein and presenilin 1 were IFN
c
+(Browne et al., 2013). Here we considered that the ob-served increase in IFN
c
in the brain of CD200-deficient mice may be a consequence of infiltrating IFNc
-producing peripheral cells which may, in turn, contribute to the observed microglial activa-tion. Therefore a single cell suspension was prepared from perfused brain tissue of wildtype and CD200 / mice and assessed by flowcytometry for evidence of infiltrating cells. The data indicate that there was a significant increase in CD4+and CD8+cells in tissue
pre-pared from CD200 / , compared with wildtype, mice (⁄⁄p< 0.01;
student’st-test for independent means;Fig. 6A–C). There was also a significant genotype-associated increase in the number of CD11b+CD45high macrophages (⁄⁄⁄p< 0.001; student’s t-test for
independent means;Fig. 6D and E) and, interestingly, the propor-tion of these cells which stained positively for MHCII was also in-creased (⁄⁄p< 0.01; student’st-test for independent means;Fig. 6F).
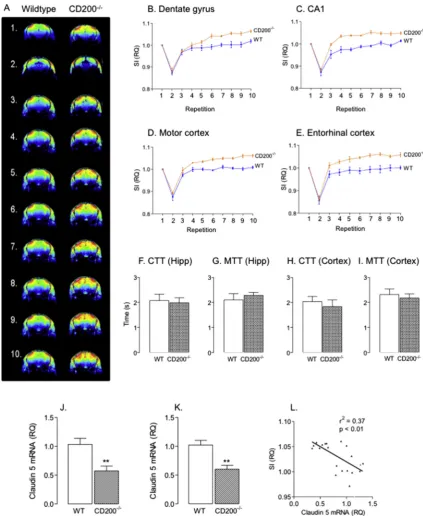
Infiltration of cells may be facilitated if BBB permeability in-creases and we examined this possibility in wildtype and CD200 /
mice by assessing time-related changes in signal intensity follow-ing intravenous injection of the gadolinium-based contrast agent, gadopentate dimeglumine. Signal intensity, indicative of extravasa-tion of the contrast agent (Blamire et al., 2000), was significantly in-creased in several areas of the brain of CD200 / mice compared
with wildtype mice (Fig. 7A); significant differences were observed in the dentate gyrus and area CA1 (Fig. 7B and C) and also in the mo-tor cortex and enmo-torhinal cortex (Fig. 7D and E). Changes were also observed in several other regions including area CA3 of the hippo-campus, the somatosensory cortex, frontal associational cortex, thalamus and cerebellum. We assessed CTT and MTT in
hippocampal and cortical tissue in wildtype and CD200 / mice
and no genotype-related changes were observed (Fig. 7F–I). Analy-sis in whole brain similarly showed no genotype-related changes. We examined expression of the tight junction proteins claudin 5, claudin 12 and occludin mRNA and the data indicate that claudin 5 mRNA was significantly decreased in hippocampus (⁄⁄p < 0.01;
student’s t-test for independent means; Fig. 7J) and cortex (⁄⁄p< 0.01; student’s t-test for independent means; Fig. 7K) of
CD200 / mice compared with wildtype mice. Analysis of claudin
5 in hippocampus by Western immunoblotting indicated that there was a genotype-related decrease (1.29 ± 0.11 vs 1.01 ± 0.09; (mean ± SEM; n= 5) wildtype vs CD200 / ;p< 0.05; student’s
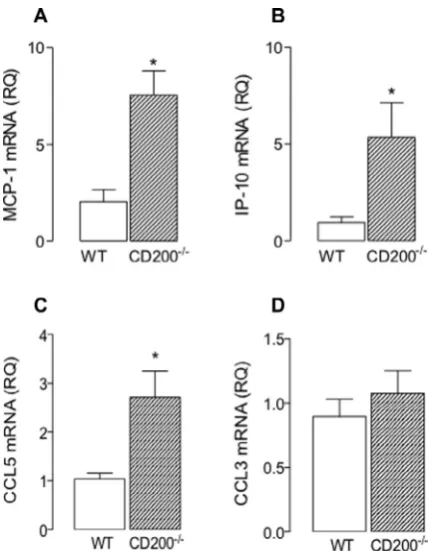
t-test for independent means; densitometric data expressed as a ra-tio, claudin 5:b-actin). However there was no significant geno-type-related difference in either claudin 12 mRNA or occludin mRNA (data not shown). Interestingly, there was a significant in-verse relationship between the signal intensity and claudin 5 mRNA in hippocampus and cortex (p< 0.01;Fig. 7L). While these data are consistent with the idea that increased BBB permeability enables infiltration of peripheral cells into the brain, it is interesting that expression of two chemokines, MCP-1 and IP-10, which act as che-motactic factors for recruitment of cells including macrophages and T cells, were significantly increased in hippocampal tissue prepared from CD200 / mice compared with wildtype mice (⁄p< 0.05;
stu-dent’st-test for independent means;Fig. 8A and B). The data also show that there was a genotype-related increase in CCL5 mRNA (⁄p< 0.05; student’s t-test for independent means; Fig. 8C) but
not CCL3 mRNA (Fig. 8D).
If IFN
c
is the key to the increased microglial activation in CD200 / mice, then it must be predicted that injection of IFNc
will mimic the effects of CD200 deficiency. To assess this, a single cell suspension was prepared from the perfused brain of control-Fig. 6.Deficiency of CD200 is associated with infiltration of immune cells. A single cell suspension, prepared from perfused brain, was added to a 5-layer Percoll gradient to obtain mononuclear cells, as described previously (Costello et al., 2011) and in the Methods. Cells, prepared for flow cytometry as described in the Methods, were incubated with antibodies including APC-Cy™7 rat anti-mouse CD11b, PE-Cy™7 rat anti-mouse CD45, PerCP rat anti-mouse CD8a, PeCy™7 rat anti-mouse CD4 and PE rat anti-mouse MHCII. Flow cytometric analysis indicated that there was a significant increase in the number of CD45+CD3+CD4+cells and CD45+CD8+cells in preparations obtained from CD200/ mice compared with wildtype mice ((A–C);⁄⁄
p< 0.01; student’st-test for independent means). There was also a significant increase in the number of CD11b+CD3+ CD45high
cells (i.e., macrophages), as well as CD11b+ CD45high
MHCII+
cells, in single cell suspensions prepared from the brains of CD200 /
, compared with wildtype, mice ((D–F);⁄⁄
p< 0.01;⁄⁄⁄
p< 0.001; student’st-test for independent means). Values are presented as means ± SEM (n= 4–6).
[image:7.595.108.501.64.328.2]per-treated and IFN
c
-injected mice and subjected to flow cytometric analysis. The data indicate that the expression of CD11b per cell, as indicated by the mean fluorescence intensity, was increased in IFNc
-injected, compared with control-treated, mice (⁄p< 0.05;stu-dent’st-test for independent means;Fig. 9A) and, in addition, that
there was a greater number of CD11b+CD86+, as well as CD11b+
CD68+, cells in samples prepared from IFN
c
-injected mice(⁄⁄
p< 0.01; ⁄⁄⁄
p< 0.001; student’st-test for independent means;
[image:8.595.77.501.64.581.2]Fig. 9B–D). Injection of IFN
c
also increased TNFa
mRNA (⁄p< 0.05; student’st-test for independent means;Fig. 9E).Fig. 7.BBB permeability is increased in hippocampus and cortex of CD200/
mice. Signal intensity (SI) generated by extravasation of the gadolinium-based contrast agent, gadopentate dimeglumine, was used to assess BBB permeability using MRI. Mice were anaesthetized using isoflurane (5% in 100% O2) and maintained under anaesthesia using 1.5–2% isofluorane in 100% O2). Mice were placed in a cradle, positioned in a stereotaxic frame and the right lateral tail vein was cannulated to allow delivery of gadopentate dimeglumine. Contrast imaging was carried out using a T1-weighted fast low angle shot (FLASH) sequence (10 repetitions; duration 2 min 11 s/repetition; 15-slice @ 128128 voxels per slice). The first of 10 repetitions provided the pre-contrast measurement and contrast intensity was assessed in anatomically-distinct ROIs as described in the Methods. (A) Mean SI was assessed in the last 4 repetitions and the data indicated that it was significantly greater in dentate gyrus (B) and CA1 (C) of CD200 /
, compared with wildtype, mice (F(1, 9) = 8.91;p< 0.01 andF(1, 9) = 10.72;p< 0.01, respectively; 2-way ANOVA) and also in the motor (D) and entorhinal (E) cortices (F(1, 9) = 32.4;p< 0.001 andF(1, 9) = 17.57;p< 0.001, respectively; 2-way ANOVA). (F–I) Capillary transit time (CTT) and mean transit time MTT) was similar in hippocampus and cortex of wildtype and CD200 /
mice. Expression of claudin 5 mRNA was significantly decreased in hippocampal (J) and cortical (K) tissue obtained from CD200 / mice compared with wildtype mice (⁄⁄
p< 0.01; student’st-test for independent means). (L) Signal intensity (SI) derived from extravasation of gadopentate dimeglumine, which is an indicator of BBB permeability, was significantly correlated with claudin 5 mRNA (r2= 0.37,p< 0.01).
per-4. Discussion
The significant finding reported here is that microglia in CD200-deficient mice adopt the inflammatory classical activation pheno-type because IFN
c
-producing T cells and macrophages enter the brain as a consequence of increased BBB permeability, perhaps as-sisted by increased expression of chemotactic factors in the brain. The proposal is that the infiltrating T cells interact with the microg-lia which have antigen presenting capability, and that the released IFNc
exerts a more profound effect since receptor expression and receptor-induced signalling are enhanced in cells from CD200-defi-cient mice.It is established that the interaction between CD200 and its receptor is an important factor in modulating microglial activation and that loss of CD200 is coupled with increased microglial activa-tion (Lyons et al., 2007a, 2009) and CD200 deficiency is associated with increased responsiveness of microglia to TLR agonists, LPS and Pam3CSK4(Costello et al., 2011). Here we show that the response
to IFN
c
is greater in cells prepared from CD200-deficent, compared with wildtype, mice and that this is associated with increased expression of IFNGR1 and STAT1 phosphorylation. This genotype-linked propensity to adopt the classical microglial activation state was not mirrored by a genotype-related sensitivity to IL-4.In vivo, even under resting conditions, the loss of CD200 is asso-ciated with upregulation of inflammatory markers, including IL-6, CD11b, MHCII and CD40 mRNA, as well as TNF
a
and iNOS mRNA which are hallmarks of classical activation of microglia. Increased expression of CD40 on CD11b+cells was also observed. IFNc
in-duces microglia to adopt the classical activation state (Colton,
2009) and has been shown to increase expression of several inflammatory moleculesin vitro andin vivo (Clarke et al., 2008; Downer et al., 2009; Lyons et al., 2007b; Maher et al., 2006); here the increased microglial activation in CD200 / mice is
accompa-nied by increased IFN
c
concentration. A similar parallel between IFNc
concentration and increased markers of microglial activation has been shown in the brain of aged rats and LPS/Ab-treated rats (Clarke et al., 2008; Maher et al., 2006).The evidence indicates that there was a genotype-related in-crease in hippocampal concentration of IFN
c
as assessed by ELISA and also by western immunoblotting. Interestingly an increase in expression of IFNGR1 was also observed in hippocampus of CD200 / mice identifying a mechanism by which microglia might be more responsive to IFNc
. However the source of the IFNc
in the brain of CD200 / mice is unclear since it is generally consideredthat resident cells in the brain do not produce it; we have consis-tently failed to induce release from microglia, or indeed astrocytes, using a range of stimuli. We have also been unable to show any meaningful IFN
c
mRNA expression in primary microglial cells, although there have been sporadic reports in the literature sug-gesting that glia produce IFNc
under specific circumstances (Kawanokuchi et al., 2006; Suzuki et al., 2005; Xiao and Link, 1998). In this study we considered that peripheral cells might infil-trate the brain and explain the presence of IFNc
.An intact BBB provides one of the most important protective strategies for the brain and the evidence has indicated that in-creased BBB permeability is inin-creased in conditions which are associated with inflammation including AD (Farrall and Wardlaw, 2009; Starr et al., 2009), multiple sclerosis (Kirk et al., 2003) and Parkinson’s disease (Kortekaas et al., 2005). An age-related increase in BBB permeability has also been reported in rats (Blau et al., 2012). Here we demonstrate that gadolinium extravasation is in-creased in several areas of the brain of CD200 / , compared with
wildtype, mice and that this is associated with decreased expres-sion of claudin 5. It is well established that maintenance of BBB integrity is dependent on the interaction between the transmem-brane proteins, the claudins, occludin and junctional adhesion mol-ecule (Ballabh et al., 2004; Capaldo and Nusrat, 2009; Hawkins and Davis, 2005) and, consistent with this, is the observation that expression of claudin 5 is inversely correlated with the signal intensity derived from extravasation of gadolinium. Interestingly we have observed a similar decrease in expression of claudin 5 and claudin 12 following LPS injection and these changes are also associated with BBB permeability (Kelly et al., unpublished). Expression of tight junction proteins, including claudin 5, is de-creased by inflammatory cytokines like TNF-
a
and IL-1b which are released from activated microglia (Kebir et al., 2007; Walsh et al., 2000). Although the BBB is considered by some to be primar-ily involved in preventing entry of high molecular weight mole-cules into the brain, it also plays a role in preventing unrestricted infiltration of cells, as suggested by the presence of large numbers of peripheral cells in the brain in conditions where BBB permeabil-ity is compromised (Kroenke et al., 2008; Murphy et al., 2010; Togo et al., 2002). Consistent with this, we show that the increase in BBB permeability in CD200 / mice is associated with the presence of CD4+and CD8+T cells and macrophages in the brain. While the [image:9.595.60.278.64.340.2]data demonstrate marked infiltration of peripheral cells, the next step is to assess, using immunohistochemical analysis, the anatom-ical distribution of the cells; these analyses, which form part of a major new study, are underway. Interestingly, a role for another neuroimmune regulatory molecule, fractalkine, in cell infiltration into the brain has been described; specifically adenosine-induced fractalkine upregulation in the choroid plexus has been shown to trigger lymphocyte infiltration in experimental autoimmune encephalomyelitis (Mills et al., 2012), whereas fractalkine defi-ciency has been associated with decreased leukocyte infiltration Fig. 8.Expression of MCP-1, IP-10 and RANTES mRNA was increased in
hippocam-pal tissue prepared from CD200-deficient mice. Real-time PCR was performed on cDNA prepared from hippocampal tissue of wildtype and CD200-deficient mice. Details of the predesigned Taqman gene expression assays are given in the Methods. Gene expression was calculated relative to the endogenous control samples (b-actin) to give a relative quantification (RQ) value (2 DDCT
, where CT is threshold cycle). MCP-1 mRNA (A), IP-10 mRNA (B) and CCL5 mRNA (C), but not CCL3 mRNA (D), were significantly increased in hippocampal tissue prepared from CD200-deficient, compared with wildtype, mice (⁄
p< 0.05; Students t-test for independent means). Values are presented as mean ± SEM (n= 6).
per-and smaller lesions in a model of cerebral ischaemia (Denes et al., 2008).
Interestingly CD200 deficiency has also been associated with in-creased infiltration of iNOS-producing macrophages into the retina in experimental autoimmune uveoretinitis. In this case, it was ar-gued that the infiltration was a consequence of the loss of the down-regulatory signal, which arises from CD200-CD200R interac-tion, at the retinal vascular endothelium (Copland et al., 2007). Whether a similar mechanism contributes to BBB permeability re-mains to be assessed. However the CD200–CD200R interaction be-tween endothelial cells and microglia (Miller et al., 2011), like neurons and astrocytes, increases production of inflammatory cytokines including IL-1bfrom microglia (Cox et al., 2013; Lyons et al., 2007a) creating an inflammatory microenvironment which has been shown to increase BBB permeability (Argaw et al., 2006; McCandless et al., 2009; Zhao et al., 2007). Similarly the age-related increase in neuroinflammatory changes, which have previously been coupled with increased IFN
c
expression (Lyons et al., 2011) and decreased CD200 expression (Lyons et al., 2007a), are associated with increased gadolinium extravasation and infiltration of macrophages (Blau et al., 2012), while recent findings have revealed similar age-related changes in APP/PS1 mice (Minogue et al., unpublished).The clinical relevance of CD200 has been recognized recently with the observation that expression of the ligand and receptor are decreased in post mortem brain tissue prepared from individ-uals with Alzheimer’s disease (Walker et al., 2009), whereas a de-crease in CD200 has been reported around inactive and chronic active lesions in multiple sclerosis (Koning et al., 2007). It has also been reported that macrophage expression of CD200 receptor is dysregulated in patients with Parkinson’s disease (Luo et al., 2010). These data suggest that targeting CD200 may be a potential
therapeutic option in neurodegenerative diseases which are char-acterised by neuroinflammatory changes.
Recruitment of immune cells into the brain is also influenced by chemokines and therefore the present finding that MCP-1, IP-10 and RANTES are increased in tissue prepared from CD200 / mice
is significant. Interestingly, increased expression of MCP-1 and IP-10 has been reported in brain in animal models of neurodegenera-tive diseases including EAE (Boztug et al., 2002; Duan et al., 2008) in which infiltration of inflammatory CD4+T cells is considered to
be a primary factor in triggering demyelination and degeneration of axons (Prendergast and Anderton, 2009). Especially significant in the context of CD200-deficiency is the observation that CD200–CD200R interaction plays a role in T cell adhesion and migration into tissues (Ko et al., 2009).
IFN
c
is the signature cytokine of Th1 cells, but there is a wealth of evidence indicating that CD8+cells and macrophages also pro-duce IFNc
(Fenton et al., 1997; Ngai et al., 2007; Szabo et al., 2002; Wang et al., 1999). Thus it is possible that the genotype-re-lated increase in IFNc
described here is derived from the infiltrat-ing cells and that it triggers microglial activation. To further explore the role of IFNc
in microglial activation, we evaluated the effect of intracerebroventricular injection of IFNc
on microglial activation in the hippocampus. The data show that IFNc
markedly increased the number of CD11b+cells which stained positively forboth CD86 and CD68, and this concurs with earlier data indicating that IFN
c
increased NO and TNFa
in murine macrophages (Mosser, 2003). This observation, and the finding that IFNc
was increased in brain tissue prepared from CD200 / mice, is clearly consistent [image:10.595.119.463.65.329.2]with the possibility that IFN
c
provides the trigger for microglial activation. This proposal is supported by recent data from this lab-oratory which showed that infiltrating IFNc
-producing cells in a mouse model of Alzheimer’s disease was associated with marked Fig. 9.IFNcincreased CD11b, CD86 and CD68 on cells prepared from the cortex of wildtype mice. Mice were anaesthetized with urethane (1.5 g/kg), injected intracerebroventricularly with saline or IFNc(50 ng/ml) and transcardially perfused 3 h after injection. The cerebellum, olfactory lobes and hippocampus were removed and cells, prepared for flow cytometry as described in the Methods from the remaining tissue, were incubated with antibodies including APC-Cy™7 rat anti-mouse CD11b, Alexa Fluor 488 rat anti-mouse CD68 and PerCP/Cy5.5 rat anti-mouse CD86. (A) Mean florescence intensity of CD11b was increased in cells prepared from IFNctreated animals compared with saline controls (⁄p< 0.05; Studentst-test for independent means). The expression of CD86 (B) and CD68 (C) was increased on CD11b+cells prepared from IFNc treated animals compared with saline controls (⁄p< 0.05;⁄⁄⁄
p< 0.001; Studentst-test for independent means). Representative FACS plots are shown (D). IFNcalso increased TNFamRNA expression (⁄
p < 0.05; student’st-test for independent means). Values are presented as mean ± SEM (n= 6).
per-microglial activation and, importantly, that administration of an anti-IFN
c
antibody blocked this effect (Browne et al., 2013).The data demonstrate that perturbation of the BBB, such as oc-curs in certain neurodegenerative diseases which are characterized by neuroinflammatory changes, may be a significant factor in driv-ing further microglial activation and may therefore contribute to the development of a persistent and damaging inflammatory cas-cade. Targetting the BBB may therefore provide a useful approach in breaking this cycle of events and limiting the consequent neuro-nal damage.
Conflict of interest
All authors declare that there are no conflicts of interest.
Acknowledgments
This work was supported by grants obtained from Science Foundation Ireland and the Health Research Board (Ireland). RK was the recipient of funding from the Dublin Region Higher Educa-tion Alliance funded by the Strategic InnovaEduca-tion Fund (Cycle 2; grant code) from the Higher Education Authority.
References
Argaw, A.T., Zhang, Y., Snyder, B.J., Zhao, M.L., Kopp, N., Lee, S.C., Raine, C.S., Brosnan, C.F., John, G.R., 2006. IL-1beta regulates blood–brain barrier permeability via reactivation of the hypoxia-angiogenesis program. J. Immunol. 177, 5574–5584.
Ballabh, P., Braun, A., Nedergaard, M., 2004. The blood–brain barrier: an overview: structure, regulation, and clinical implications. Neurobiol. Dis. 16, 1–13.
Barclay, A.N., Wright, G.J., Brooke, G., Brown, M.H., 2002. CD200 and membrane protein interactions in the control of myeloid cells. Trends Immunol. 23, 285– 290.
Blamire, A.M., Anthony, D.C., Rajagopalan, B., Sibson, N.R., Perry, V.H., Styles, P., 2000. Interleukin-1beta-induced changes in blood–brain barrier permeability, apparent diffusion coefficient, and cerebral blood volume in the rat brain: a magnetic resonance study. J. Neurosci. 20, 8153–8159.
Blau, C.W., Cowley, T.R., O’Sullivan, J., Grehan, B., Browne, T.C., Kelly, L., Birch, A., Murphy, N., Kelly, A.M., Kerskens, C.M., Lynch, M.A., 2012. The age-related deficit in LTP is associated with changes in perfusion and blood–brain barrier permeability. Neurobiol. Aging 33 (1005), e1023–e1035.
Boztug, K., Carson, M.J., Pham-Mitchell, N., Asensio, V.C., DeMartino, J., Campbell, I.L., 2002. Leukocyte infiltration, but not neurodegeneration, in the CNS of transgenic mice with astrocyte production of the CXC chemokine ligand 10. J. Immunol. 169, 1505–1515.
Browne, T.C., McQuillan, K., McManus, R.M., O’Reilly, J.A., Mills, K.H., Lynch, M.A., 2013. IFN-gamma Production by amyloid beta-specific Th1 cells promotes microglial activation and increases plaque burden in a mouse model of Alzheimer’s disease. J. Immunol. 190, 2241–2251.
Capaldo, C.T., Nusrat, A., 2009. Cytokine regulation of tight junctions. Biochim. Biophys. Acta 1788, 864–871.
Clarke, R.M., Lyons, A., O’Connell, F., Deighan, B.F., Barry, C.E., Anyakoha, N.G., Nicolaou, A., Lynch, M.A., 2008. A pivotal role for interleukin-4 in atorvastatin-associated neuroprotection in rat brain. J. Biol. Chem. 283, 1808–1817.
Colton, C.A., 2009. Heterogeneity of microglial activation in the innate immune response in the brain. J. Neuroimmune Pharmacol. 4, 399–418.
Colton, C.A., Wilcock, D.M., 2010. Assessing activation states in microglia. CNS Neurol. Disord.: Drug Targets 9, 174–191.
Colton, C.A., Mott, R.T., Sharpe, H., Xu, Q., Van Nostrand, W.E., Vitek, M.P., 2006. Expression profiles for macrophage alternative activation genes in AD and in mouse models of AD. J. Neuroinflammation 3, 27.
Copland, D.A., Calder, C.J., Raveney, B.J., Nicholson, L.B., Phillips, J., Cherwinski, H., Jenmalm, M., Sedgwick, J.D., Dick, A.D., 2007. Monoclonal antibody-mediated CD200 receptor signaling suppresses macrophage activation and tissue damage in experimental autoimmune uveoretinitis. Am. J. Pathol. 171, 580–588.
Costello, D.A., Lyons, A., Denieffe, S., Browne, T.C., Cox, F.F., Lynch, M.A., 2011. Long term potentiation is impaired in membrane glycoprotein CD200-deficient mice: a role for Toll-like receptor activation. J. Biol. Chem. 286, 34722–34732.
Cox, F.F., Carney, D., Miller, A.M., Lynch, M.A., 2012. CD200 fusion protein decreases microglial activation in the hippocampus of aged rats. Brain Behav. Immun. 26, 789–796.
Cox, F.F., Berezin, V., Bock, E., Lynch, M.A., 2013. The neural cell adhesion molecule-derived peptide, FGL, attenuates lipopolysaccharide-induced changes in glia in a CD200-dependent manner. Neuroscience 235, 141–148.
Denes, A., Ferenczi, S., Halasz, J., Kornyei, Z., Kovacs, K.J., 2008. Role of CX3CR1 (fractalkine receptor) in brain damage and inflammation induced by focal cerebral ischemia in mouse. J. Cereb. Blood Flow Metab. 28, 1707–1721.
Downer, E.J., Cowley, T.R., Cox, F., Maher, F.O., Berezin, V., Bock, E., Lynch, M.A., 2009. A synthetic NCAM-derived mimetic peptide, FGL, exerts anti-inflammatory properties via IGF-1 and interferon-gamma modulation. J. Neurochem. 109, 1516–1525.
Duan, R.S., Yang, X., Chen, Z.G., Lu, M.O., Morris, C., Winblad, B., Zhu, J., 2008. Decreased fractalkine and increased IP-10 expression in aged brain of APP(swe) transgenic mice. Neurochem. Res. 33, 1085–1089.
Farrall, A.J., Wardlaw, J.M., 2009. Blood–brain barrier: ageing and microvascular disease–systematic review and meta-analysis. Neurobiol. Aging 30, 337–352.
Fenton, M.J., Vermeulen, M.W., Kim, S., Burdick, M., Strieter, R.M., Kornfeld, H., 1997. Induction of gamma interferon production in human alveolar macrophages by Mycobacterium tuberculosis. Infect. Immun. 65, 5149–5156.
Frank, M.G., Barrientos, R.M., Biedenkapp, J.C., Rudy, J.W., Watkins, L.R., Maier, S.F., 2006. MRNA up-regulation of MHC II and pivotal pro-inflammatory genes in normal brain aging. Neurobiol. Aging 27, 717–722.
Gordon, S., Martinez, F.O., 2010. Alternative activation of macrophages: mechanism and functions. Immunity 32, 593–604.
Hawkins, B.T., Davis, T.P., 2005. The blood–brain barrier/neurovascular unit in health and disease. Pharmacol. Rev. 57, 173–185.
Kawanokuchi, J., Mizuno, T., Takeuchi, H., Kato, H., Wang, J., Mitsuma, N., Suzumura, A., 2006. Production of interferon-gamma by microglia. Mult. Scler. 12, 558– 564.
Kebir, H., Kreymborg, K., Ifergan, I., Dodelet-Devillers, A., Cayrol, R., Bernard, M., Giuliani, F., Arbour, N., Becher, B., Prat, A., 2007. Human TH17 lymphocytes promote blood–brain barrier disruption and central nervous system inflammation. Nat. Med. 13, 1173–1175.
Kelly, M.E., Blau, C.W., Kerskens, C.M., 2009. Bolus-tracking arterial spin labelling: theoretical and experimental results. Phys. Med. Biol. 54, 1235–1251.
Kelly, M.E., Blau, C.W., Griffin, K.M., Gobbo, O.L., Jones, J.F., Kerskens, C.M., 2010. Quantitative functional magnetic resonance imaging of brain activity using bolus-tracking arterial spin labeling. J. Cereb. Blood Flow Metab. 30, 913–922.
Kirk, J., Plumb, J., Mirakhur, M., McQuaid, S., 2003. Tight junctional abnormality in multiple sclerosis white matter affects all calibres of vessel and is associated with blood–brain barrier leakage and active demyelination. J. Pathol. 201, 319– 327.
Ko, Y.C., Chien, H.F., Jiang-Shieh, Y.F., Chang, C.Y., Pai, M.H., Huang, J.P., Chen, H.M., Wu, C.H., 2009. Endothelial CD200 is heterogeneously distributed, regulated and involved in immune cell–endothelium interactions. J. Anat. 214, 183–195.
Koning, N., Bo, L., Hoek, R.M., Huitinga, I., 2007. Downregulation of macrophage inhibitory molecules in multiple sclerosis lesions. Ann. Neurol. 62, 504–514.
Koning, N., Swaab, D.F., Hoek, R.M., Huitinga, I., 2009. Distribution of the immune inhibitory molecules CD200 and CD200R in the normal central nervous system and multiple sclerosis lesions suggests neuron–glia and glia–glia interactions. J. Neuropathol. Exp. Neurol. 68, 159–167.
Kortekaas, R., Leenders, K.L., van Oostrom, J.C., Vaalburg, W., Bart, J., Willemsen, A.T., Hendrikse, N.H., 2005. Blood–brain barrier dysfunction in parkinsonian midbrainin vivo. Ann. Neurol. 57, 176–179.
Kroenke, M.A., Carlson, T.J., Andjelkovic, A.V., Segal, B.M., 2008. IL-12- and IL-23-modulated T cells induce distinct types of EAE based on histology, CNS chemokine profile, and response to cytokine inhibition. J. Exp. Med. 205, 1535– 1541.
Luo, X.G., Zhang, J.J., Zhang, C.D., Liu, R., Zheng, L., Wang, X.J., Chen, S.D., Ding, J.Q., 2010. Altered regulation of CD200 receptor in monocyte-derived macrophages from individuals with Parkinson’s disease. Neurochem. Res. 35, 540–547.
Lynch, M.A., 2009. The multifaceted profile of activated microglia. Mol. Neurobiol. 40, 139–156.
Lynch, M.A., 2010. Age-related neuroinflammatory changes negatively impact on neuronal function. Front. Aging Neurosci. 1, 6.
Lyons, A., Downer, E.J., Crotty, S., Nolan, Y.M., Mills, K.H., Lynch, M.A., 2007a. CD200 ligand–receptor interaction modulates microglial activationin vivoandin vitro: a role for IL-4. J. Neurosci. 27, 8309–8313.
Lyons, A., Griffin, R.J., Costelloe, C.E., Clarke, R.M., Lynch, M.A., 2007b. IL-4 attenuates the neuroinflammation induced by amyloid-beta in vivo and in vitro. J. Neurochem. 101, 771–781.
Lyons, A., McQuillan, K., Deighan, B.F., O’Reilly, J.A., Downer, E.J., Murphy, A.C., Watson, M., Piazza, A., O’Connell, F., Griffin, R., Mills, K.H., Lynch, M.A., 2009. Decreased neuronal CD200 expression in IL-4-deficient mice results in increased neuroinflammation in response to lipopolysaccharide. Brain Behav. Immun. 23, 1020–1027.
Lyons, A., Murphy, K.J., Clarke, R., Lynch, M.A., 2011. Atorvastatin prevents age-related and amyloid-beta-induced microglial activation by blocking interferon-gamma release from natural killer cells in the brain. J. Neuroinflammation 8, 27.
Lyons, A., Downer, E.J., Costello, D.A., Murphy, N., Lynch, M.A., 2012. Dok2 mediates the CD200Fc attenuation of Abeta-induced changes in glia. J. Neuroinflammation 9, 107.
Maher, F.O., Clarke, R.M., Kelly, A., Nally, R.E., Lynch, M.A., 2006. Interaction between interferon gamma and insulin-like growth factor-1 in hippocampus impacts on the ability of rats to sustain long-term potentiation. J. Neurochem. 96, 1560–1571.
McCandless, E.E., Budde, M., Lees, J.R., Dorsey, D., Lyng, E., Klein, R.S., 2009. IL-1R signaling within the central nervous system regulates CXCL12 expression at the blood–brain barrier and disease severity during experimental autoimmune encephalomyelitis. J. Immunol. 183, 613–620.
Miller, A.M., Deighan, B.F., Downer, E., Lyons, A., Henrich-Noack, P., Nolan, T., Lynch, M.A., 2011. In: Raymond Chuen-Chung Chang (Ed.), Analysis of the Impact of CD200 on Neurodegenerative Diseases, Neurodegenerative Diseases –
per-Processes, Prevention, Protection and Monitoring. ISBN: 978-953-307-485-6. InTech, Available from: <http://www.intechopen.com/books/ neurodegenerative-diseases-processes-prevention-protection-and-monitoring/ analysis-of-the-impact-of-cd200-on-neurodegenerative-diseases>.
Mills, J.H., Alabanza, L.M., Mahamed, D.A., Bynoe, M.S., 2012. Extracellular adenosine signaling induces CX3CL1 expression in the brain to promote experimental autoimmune encephalomyelitis. J. Neuroinflammation 9, 193.
Mosser, D.M., 2003. The many faces of macrophage activation. J. Leukoc. Biol. 73, 209–212.
Murphy, A.C., Lalor, S.J., Lynch, M.A., Mills, K.H., 2010. Infiltration of Th1 and Th17 cells and activation of microglia in the CNS during the course of experimental autoimmune encephalomyelitis. Brain Behav. Immun. 24, 641–651.
Ngai, P., McCormick, S., Small, C., Zhang, X., Zganiacz, A., Aoki, N., Xing, Z., 2007. Gamma interferon responses of CD4 and CD8 T-cell subsets are quantitatively different and independent of each other during pulmonaryMycobacterium bovis BCG infection. Infect. Immun. 75, 2244–2252.
Prendergast, C.T., Anderton, S.M., 2009. Immune cell entry to central nervous system – current understanding and prospective therapeutic targets. Endocr. Metab. Immune Disord. Drug Targets 9, 315–327.
Renno, T., Krakowski, M., Piccirillo, C., Lin, J.Y., Owens, T., 1995. TNF-alpha expression by resident microglia and infiltrating leukocytes in the central nervous system of mice with experimental allergic encephalomyelitis. Regulation by Th1 cytokines. J. Immunol. 154, 944–953.
Starr, J.M., Farrall, A.J., Armitage, P., McGurn, B., Wardlaw, J., 2009. Blood–brain barrier permeability in Alzheimer’s disease: a case-control MRI study. Psychiatry Res. 171, 232–241.
Suzuki, Y., Claflin, J., Wang, X., Lengi, A., Kikuchi, T., 2005. Microglia and macrophages as innate producers of interferon-gamma in the brain following infection withToxoplasma gondii. Int. J. Parasitol. 35, 83–90.
Szabo, S.J., Sullivan, B.M., Stemmann, C., Satoskar, A.R., Sleckman, B.P., Glimcher, L.H., 2002. Distinct effects of T-bet in TH1 lineage commitment and IFN-gamma production in CD4 and CD8 T cells. Science 295, 338–342.
Togo, T., Akiyama, H., Iseki, E., Kondo, H., Ikeda, K., Kato, M., Oda, T., Tsuchiya, K., Kosaka, K., 2002. Occurrence of T cells in the brain of Alzheimer’s disease and other neurological diseases. J. Neuroimmunol. 124, 83–92.
Walker, D.G., Dalsing-Hernandez, J.E., Campbell, N.A., Lue, L.F., 2009. Decreased expression of CD200 and CD200 receptor in Alzheimer’s disease: a potential mechanism leading to chronic inflammation. Exp. Neurol. 215, 5–19.
Walsh, S.V., Hopkins, A.M., Nusrat, A., 2000. Modulation of tight junction structure and function by cytokines. Adv. Drug Deliv. Rev. 41, 303–313.
Wang, J., Wakeham, J., Harkness, R., Xing, Z., 1999. Macrophages are a significant source of type 1 cytokines during mycobacterial infection. J. Clin. Invest. 103, 1023–1029.
Webb, M., Barclay, A.N., 1984. Localisation of the MRC OX-2 glycoprotein on the surfaces of neurones. J. Neurochem. 43, 1061–1067.
Xiao, B.G., Link, H., 1998. IFN-gamma production of adult rat astrocytes triggered by TNF-alpha. NeuroReport 9, 1487–1490.
Zhao, C., Ling, Z., Newman, M.B., Bhatia, A., Carvey, P.M., 2007. TNF-alpha knockout and minocycline treatment attenuates blood–brain barrier leakage in MPTP-treated mice. Neurobiol. Dis. 26, 36–46.