Efficient Coverage Through Inter-operator
Infrastructure Sharing in Mobile Networks
Jacek Kibiłda
∗and Luiz A. DaSilva
∗†∗CTVR, Trinity College Dublin, Ireland, E-mail: {kibildj,dasilval}@tcd.ie
†Virginia Tech, USA, E-mail: [email protected]
Abstract—Herein, we study efficient coverage provisioning in mobile networks under an inter-operator infrastructure sharing regime which we call Networks without Borders. For the purpose of the study, we derive general formulations of the full and partial coverage provisioning problem. Based on these formulations, we assess the efficiency of coverage provisioning over shared multi-operator infrastructure for two datasets: randomly generated deployment and a real network deployment from Poland. In the paper we report over 90% cost efficiency between shared and non-shared networks for dense deployments with both homo-geneous and heterohomo-geneous power allocations, and a divergence in the efficiency between real and random deployments for low deployment density case. We consider this work as a first tractable attempt to describe large-scale inter-operator infrastructure shar-ing which may be the key to enablshar-ing appropriate coverage in currently under-served areas, with effects on the digital divide.
Keywords—inter-operator sharing, infrastructure sharing, net-work sharing, netnet-work coverage.
I. INTRODUCTION
In this paper we build the groundwork for resource man-agement under an extreme wireless network sharing regime, which we term Networks without Borders (NwoB) [1]. NwoB defines new resource ownership and management models for wireless and mobile networks, where various heterogeneous resources are pooled and commoditized to enable flexible inter-operator sharing and reconfiguration. We believe that NwoB follows naturally from recent trends in wireless networks, including inter-operator infrastructure sharing, the mobile vir-tual network operator (MVNO) model, increased network automation, cell miniaturization (i.e. small cells), high WiFi penetration and high base station density.
Currently, the predominant model for wide-area wireless access provisioning is that of operators individually owning and controlling their network access infrastructure. In the case of cellular networks, mobile network operators (MNOs) hold a license to the radio spectrum, own the hardware and software for the radio access network (RAN), own or lease backhaul and core connectivity, and operate their own network management, subscriber authorization, and billing services. This model re-quires high capital investments during the roll-out phase of a mobile network [2] and, increasingly, the capital (CAPEX) and operational expenditures (OPEX) turn out to be large enough to drive the MNOs into inter-operator network sharing [3]. The most widespread form of inter-operator network sharing is site sharing, where the physical site and its basic installations, such as mast, cooling equipment and power supply, are shared
between MNOs following a one-for-one exchange strategy [4]. Site sharing reduces fixed site-related OPEX but does not address the expected surge in demand for wireless services, which will require capacity enhancements obtained through new site deployments, or adding on new carriers.
The bad news is that any new and expensive infrastructure investments may turn out to be unprofitable, as the modern day growth in user traffic is decoupled from adequate return on investments (ROI) [5]. One way around this is to meet the traffic demand through the increased sharing of the existing RANs or the undertaking of joint greenfield deployments, such as the joint venture of two Danish MNOs [6], or the merger between two Polish units of T-Mobile and Orange [7]. However, this approach requires common technical policies and strong (typically pairwise) cooperation between MNOs, including also complex network management [4].
Another well established form of inter-operator sharing is geographical roaming, where operators of geographically separated networks allow subscribers to access the services of their networks via access networks of another operator [4], the situation that typically applies in international roaming. The geographical roaming model has similarities to a more sophisticated network ownership and control model, a mobile virtual network operator (MVNO) model. MVNOs were intro-duced by many national regulators to increase the competition in a market stiffened by auctioning of a limited number of exclusive radio spectrum licenses [8]. In short, a full MVNO is an operator that does not hold a license to radio spectrum nor owns radio access infrastructure; yet, it is allowed to offer wide-area wireless access over another MNO’s infrastructure, handling such general functions as billing, customer care, branding and marketing.
of forms, from the basic quality of service aspects such as coverage or capacity, to more complex ones such as indoor coverage or low latency, or a combination thereof. Herein, we focus solely on studying a first tractable formulation of the
process, which we term coverage shaping. In the following
sections, we will formally introduce the coverage shaping problem as well as analyze the benefits of the coverage shaping based on a real mobile network deployment.
The remainder of the paper is organized as follows. First, in Section II we describe the process of coverage shaping. In Section III we introduce a network model, which we use to analytically describe the coverage shaping. Finally, in Section IV we perform a feasibility study based on real and synthetic mobile network data, and in Section V we conclude the study and suggest the next steps.
II. COVERAGE SHAPING
Wireless systems provide radio access by means of a set of wireless access points (in cellular networks these correspond to base stations), which transmit and receive radio signals to/from end-user mobile terminals within a specified service area. We
define a service areaas a set of geographical points in which
the received signal strength from the wireless access point in consideration is higher than the reception threshold, and the received interference is kept below a pre-specified level [9]. The size of the service area depends on wireless access point configurations, such as transmit power, carrier frequency or antenna tilt, as well as on radio channel effects, such as pathloss, multipath fading and shadowing.
In the context of NwoB, wireless access points and their corresponding service areas are virtualized to enable "on the fly" (the time-scale of this process should reflect the daily changes in radio resource usage) reconfiguration of wireless networks. These wireless networks can be reconfigured in line with a range of objective functions. One such objective is to meet the desired coverage at a minimum base station cost,
which we termcoverage shaping. In general, coverage shaping
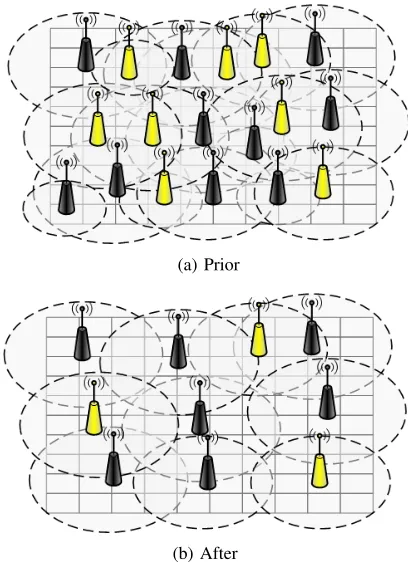
can be stated as follows: given a set of geographical points in an area, called a universe, and a set of wireless access points (with their corresponding configurations), each of which covering a subset of elements of the universe (service areas), find a set of wireless access points with a minimum associated cost such that the union of their service areas will contain all the elements of the universe. Figure 1a depicts a multi-operator wireless network prior to coverage shaping, while Figure 1b shows a minimum cost instance of the same network. An alternative definition of coverage shaping may be stated as follows: find a minimum number of wireless access points such that the union of their service areas will contain a specified fraction of the elements of the universe to meet a pre-specified
service reliability. We will refer to the former asfull coverage
shaping, while to the latter aspartial coverage shaping.
At this level of generality the process of coverage shaping resembles the well-studied process of network planning, and more specifically coverage planning. Network planning is of major interest to the MNOs at every new roll-out of a cellular system, as in the short-term it affects CAPEX, and in the long-run also network reliability and scalability. Network planning involves selecting locations to install the base stations, setting
(a) Prior
[image:2.612.339.543.52.333.2](b) After
Fig. 1: Coverage shaping on a wireless network
configuration parameters, and assigning carrier frequencies to meet the coverage and capacity demand of a given geo-graphical area. Nowadays coverage and capacity demands are satisfied jointly; however, in the days of second generation mobile systems the network planning was split into two phases: coverage planning and capacity planning [10]. The objective of the former process is to select base station placements so as to provide sufficient signal quality (under pre-specified interference levels) over a target area with minimum network cost [9]. In practice, the coverage planning is a cumbersome process, which leads to sub-optimal results, as it is required to reflect large-area propagation conditions.
Nevertheless, there are some major differences between the
process that we call coverage shaping, the central topic of
this paper, and coverage planning (or, more generally, network planning). First of all, during the coverage shaping process the location of wireless access points (base stations) is known a priori, which simplifies the problem, allowing for the usage of accurate solvers. Secondly, these wireless access points may be of heterogeneous nature and ownership. Finally, subsets of these access points, each of which potentially belonging to a different operator, will have already been optimized (as part of the network planning process) towards meeting certain target coverage, capacity and interference levels.
III. NETWORK MODEL AND PROBLEM FORMULATION
Let us define an extreme radio access network infrastruc-ture sharing scenario in which a number of wireless access points, deployed independently by a set of infrastructure
providersM 6=∅, are added to resource poolS=S
m∈MSm,
whereSm6=∅is a set of wireless access points deployed and
owned by infrastructure providerm∈M. Each wireless access
pointj∈Sprovides wireless radio coverage corresponding to
configured center frequencyf ∈Fmand transmit powert∈T,
where Fm 6=∅ is a set of non-interfering center frequencies
used by infrastructure provider m, and T 6= ∅ is a set of
available transmit power classes. Let us also denote cj as the
cost of including wireless access pointjin the instantiation of
a wireless network.
Let us define an arbitrary geographical area which the operator wishes to cover. Acknowledging the advantages of systematic sampling [9], we split the area into a rectangular
grid, which consists of a set of pixels P 6=∅, such that each
pixel is of sizer×rwherer∈R+is the resolution of the grid.
For simplification, we assume that the considered area lies in 2-dimensional Euclidean space, and each pixel is represented by its centroid.
Full coverage shaping
In a cellular system, a communication link between a base station and a mobile terminal needs to satisfy some mini-mum quality of service level (QoS). Starting from analogue systems, this QoS level was strictly related to the signal-to-interference ratio (SIR) threshold, which accounted for inter-cell interference [4]. In 4G systems this threshold relies on the signal-to-interference and noise ratio (SINR) measured by a mobile terminal, which is used to optimize system capacity and coverage for a given transmission power. If the measured SINR for a particular location is lower than the threshold, no reliable transmission link to the base station may be established [12]. Following this, we assume a mobile terminal located in
pixeli∈P may establish a communication link with wireless
access pointj ∈Sonly if the long-term average SINR for the
access point’s received signal satisfies the following condition:
γi=hijtj(ηi+
X
k∈Sf,k6=j hiktk)
−1
≥γ∗ (1)
where tj denotes the downlink transmit power of wireless
access pointj, andhij denotes the channel gain between pixel
i and wireless access point j, which consists of fading term
wij and pathloss termlij.ηidenotes the additive noise power
received by a mobile terminal located at pixel i. We assume
this additive noise term to be normalized, i.e. ηi = 1,∀i∈P.
Moreover, we denote Sf as the set of wireless access points
using the same frequencyf ∈Fm.
The QoS constraint (1) is a non-linear constraint, and, hence, might be difficult to handle. However, assuming that the pooled resources come strictly from the existing cellular networks we can note two key facts: 1) networks of different MNOs use exclusively licensed and, hence, non-interfering frequencies, 2) each of the operators has already optimized its network, and if the current frequency and power configurations are not altered the interference thresholds shall not be violated.
Based on these assumptions we can re-state constraint (1) as the receiver sensitivity constraint:
ri=hijtj≥r∗ (2)
Receiver sensitivity level r∗ and transmit power t
j are
pre-defined network parameters, while channel state information
hij can be inferred from the existing network measurements.
By pre-computing the available values, and using indicator
function 1(ri/r∗ ≥1) we obtain the binary incidence matrix
A, where a single entry aij specifies whether or not wireless
access point j covers pixel i. Having obtained the incidence
matrixAwe can formulate the full coverage shaping problem
as follows:
min
{xj}
X
j∈S
cjxj (3)
st:
X
j∈S
aijxj ≥1 ∀i∈P (4)
xj∈ {0,1} ∀j∈S (5)
which is the classical SCP formulation [11], where constraint (4) ensures that every point of a geographical area belongs to at least one service area, while constraint (5) ensures that the minimum cost choice is a binary decision for every distinct wireless access point.
Partial coverage shaping
Full coverage provisioning may be perceived as a special case of the partial coverage provisioning problem. In the partial coverage provisioning problem, constraint (4) is relaxed to allow fractional coverage service requirements. This can be achieved by replacing the right-hand side vector of ones in (4)
with binary random vector ξ, where component ξi denotes a
service request stemming from pointiat a given point in time:
ξi=
(
1, 1 or more service requests originate from pointi
0, otherwise
(6) In partial coverage provisioning, the goal is to meet the new
coverage constraint with probability at least α∈(0,1], which
represents some pre-specified service reliability level. Hence, (3)-(5) can be re-formulated as follows:
min
{xj}
X
j∈S
cjxj (7)
st:
Pr{X
j∈S
aijxj ≥ξi} ≥α ∀i∈P (8)
xj∈ {0,1} ∀j∈S (9)
wherePr{·}denotes probability, and (8) is a joint probabilistic
constraint, as used in [13]. The resulting formulation is a stochastic SCP, which in general might be hard to solve. However, following the remark from [13], if we assume
independence of the components of ξ, then the deterministic
equivalent integer program can be found as follows. Note that
(8) is equivalent to the existence of a vectorz∈ {0,1}|P|such
that Ax≥z and:
where Pr{·}is a joint probability of |P| independent events. Taking the logarithm of both sides of (10) we arrive at the following inequality:
X
i∈P
ln(Pr{zi≥ξi})≥ln(α) (11)
Observing that Pr{1 ≥ ξi} = 1 and Pr{0 ≥ ξi} =
Pr{ξi = 0}, and assuming that Pr{ξi = 0} (probability that
no service request will originate from pixel i) is known, we
arrive at the following combinatorial reformulation of (7)-(9):
min
{xj,zi}
X
j∈S
cjxj (12)
st:
X
j∈S
aijxj≥zi ∀i∈P (13)
X
i∈P
(1−zi) ln(Pr{ξi= 0})≥ln(α) (14)
xj∈ {0,1} ∀j∈S (15)
zi∈ {0,1} ∀i∈P (16)
Similarly to (3)-(5), the resulting formulation is a combina-torial optimization problem for which we can apply the same set of solvers.
IV. NUMERICAL RESULTS
In this section we present exact coverage shaping results obtained with the CPLEX ILOG tool for two datasets consist-ing of real and random network deployments.
Optimization tools
There are several exact and heuristic approaches to solving set covering problems [11]. Since both of our problems fall under the category of mixed integer programming (MIP) models, we decided to rely on commercial software (IBM ILOG CPLEX 12.5 solver) that offers customizable solvers for general MIP problems and is available for use under academic licensing. In order to find an exact solution to a MIP, the CPLEX solver applies an optimized version of a branch-and-cut algorithm. This approach works well for both full and partial coverage problems, and exact solutions to reasonably large problem instances (approximately 1000 variables and 3000 linear constraints) can be found in acceptable time-scales (in the range of an hour). We run the solver on a computer with 8 Gbytes of RAM, and an Intel Core i7-3740QM 2.70 GHz CPU with 64-bit instruction set, 8 logical cores and a cache of 6 Mbytes. The version of Linux used was 3.5.0-31-generic x86_64 GNU/Linux. The solver was set to run deterministically the maximum number of available threads with the relative MIP gap tolerance of 3% for the full coverage problem and 5% for the partial coverage problem, and the absolute upper limit on the size of the branch-and-cut tree of 100 * 1024 Mbytes. The other parameters were used according to their default algorithmic settings. In the full coverage case, before a problem instance is fed to the solver we preprocess it by removing redundancies and dominations inside incidence
matrix A[11].
Results
To evaluate the efficiency of the inter-operator infrastruc-ture sharing we test the proposed coverage shaping models against real network deployment data from Poland, as well as against a randomly generated dataset. The real data we have contains base station (BS) deployment information from the four major MNOs operating in the Polish mobile market, namely Orange, Play, Plus and T-Mobile. For each of the MNOs we have extracted snapshots of BS geo-location data (from GSM/UMTS radio licenses listed online at [14]) for four different cities that differ in deployment density (the average number of BSs deployed per unit area) and in the mix of commercial and residential areas: Warszawa, Wrocław, Olsztyn, and ´Swidnica. Each snapshot is a 10.9x4.2 km grid (which corresponds to zoom 14 in Google Maps) with a resolution of 100 meters, centered at the city center, that contains BS placements for three radio technologies: GSM900, GSM1800 and UMTS2100.
In addition, we also present results for a random deploy-ment of base stations, following a Poisson point process (for this random geographical distribution model, we used the same intensity of BSs per technology and operator as we observed from the real deployment data). The real and random deployment for Wrocław are depicted in Figures 2 and 3, respectively; qualitatively, the deployment density in the two cases exhibits different properties, i.e. real deployment tends to have a much larger peak density centered around the central area, while (not surprisingly!) random deployment is more uniform.
For both datasets, we model the propagation according to the modified Hata model [15], with BS height of 10 meters, and mobile terminal height of 1.5 meter. In our tests, we assume two types of BS transmit power allocation schemes: a) homogeneous, where BSs are assigned omnidirectional macrocell coverage with an equivalent isotropic radiated power (EIRP) of 45 dBm, b) heterogeneous, where BSs are assigned omnidirectional macro- or microcell coverage (decided based on the inter-BS distance) with EIRP of 45 and 38 dBm respectively. To ensure fair comparison for the homogeneous case we assume that all BSs have a fixed unitary cost of usage, while in the heterogeneous case we assume the cost is directly proportional to transmit power.
To quantify the gains of coverage shaping, we look at
coverage shaping efficiency, which we define as unity minus
the cost of the shaped network divided by the cost of the baseline network. For the formulation in question, the cost of the baseline network is simply the cost of all network elements belonging to the MNOs, while the cost of the shaped network represents the total cost of the minimum cost subset of the network elements that provides the desired coverage. The following analysis is intended to describe limitations and provide arguments for the feasibility of base station selections made under the scope of inter-operator infrastructure sharing and, more generally, NwoB.
0 2 4 6 8 10 0
0.5 1 1.5 2 2.5 3 3.5 4
[km]
[image:5.612.78.273.52.209.2][km]
Fig. 2: Network deployment for Wrocław with Voronoi
tessellation (dots denote single base stations while squares colocated base stations).
0 2 4 6 8 10
0 0.5 1 1.5 2 2.5 3 3.5 4
[km]
[image:5.612.363.546.64.213.2][km]
Fig. 3: Random network deployment with Voronoi tessellation (using the same intensity of base stations as in Figure 2).
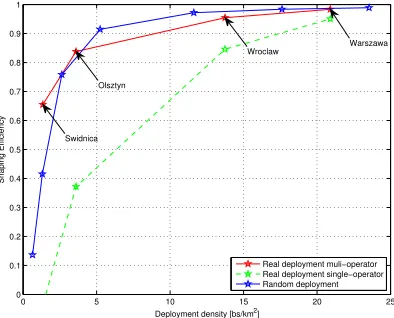
shaping were as high as 98%. This means that a single operator, in order to provide full macrocell coverage, requires only 2% of all the existing base stations in the area (i.e. 16 out of 934). This gain is also very high in comparison to the cost of a single-operator network for both homogeneous and heterogeneous power allocations, which shows how much redundancy is introduced to the network in order to secure the capacity and possibly ensure indoor macro-, microcell coverage. For the lowest density case ( ´Swidnica), the benefits of sharing arise as a result of the collective resource usage, which may justify potential benefits of infrastructure sharing in less urbanized areas. In this case a single operator may not need to roll-out all the base stations required to fully cover the considered area; instead, infrastructure sharing among several operators may make it economically feasible to provide service to such typically under-served areas.
Analyzing the differences in results between homogeneous and heterogeneous power allocations, we can observe that the efficiency is reduced with the power allocated to the system. This reduction is inversely proportional to the deployment den-sity. In addition, if we compare the results for real and random deployments, we can note that for low deployment densities
0 5 10 15 20 25
0.2 0.3 0.4 0.5 0.6 0.7 0.8 0.9 1
Deployment density [bs/km2]
Shaping Efficiency
Real deployment multi−operator Real deployment single−operator Random deployment Swidnica
Olsztyn
Wroclaw Warszawa
Fig. 4: Full coverage shaping efficiency for the real and
random deployment with homogeneous power allocation.
0 5 10 15 20 25
0 0.1 0.2 0.3 0.4 0.5 0.6 0.7 0.8 0.9 1
Deployment density [bs/km2]
Shaping Efficiency
Real deployment muli−operator Real deployment single−operator Random deployment Swidnica
Olsztyn
Wroclaw Warszawa
Fig. 5: Full coverage shaping efficiency for the real and
random deployment with heterogeneous power allocation.
(below approximately 5 bs/km2) the gains for random and real
deployments diverge. This may be due to the fact that real multi-operator deployments were planned to provide coverage for the given area following more or less the same coverage pattern for every operator (hence, resulting in redundancies), while the random deployments are more spread, resulting in lower redundancy.
[image:5.612.78.275.269.430.2] [image:5.612.347.544.274.433.2]0 5 10 15 20 25 0
0.1 0.2 0.3 0.4 0.5 0.6 0.7 0.8 0.9 1
Deployment density [bs/km2]
Shaping Efficiency
Real deployment (α = .9, Pr{ξi=0} = .25) Real deployment (α = .5, Pr{ξi=0} = .5) Random deployment(α = .9, Pr{ξi=0} = .25) Random deployment (α = .5, Pr{ξi=0} = .5) Swidnica
Olsztyn
[image:6.612.77.274.54.214.2]Wroclaw Warszawa
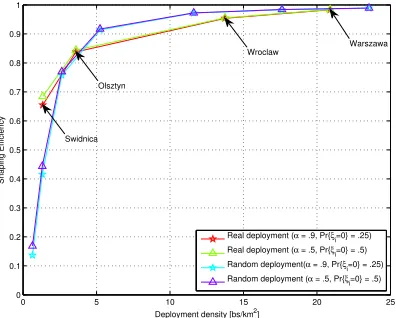
Fig. 6: Shaping efficiency of partial covering for the real
and random deployment with homogeneous power allocation,
with varying service reliabilityαand probability of no service
request Pr{ξi= 0}.
0 5 10 15 20 25
0 0.1 0.2 0.3 0.4 0.5 0.6 0.7 0.8 0.9 1
Deployment density [bs/km2]
Shaping Efficiency
Real deployment (α = .9, Pr{ξi=0} = .25) Real deployment (α = .5, Pr{ξi=0} = .5) Random deployment(α = .9, Pr{ξi=0} = .25) Random deployment (α = .5, Pr{ξ
i=0} = .5)
Swidnica Olsztyn
Wroclaw
Warszawa
Fig. 7: Shaping efficiency of partial covering for the real
and random deployment with heterogeneous power allocation,
with varying service reliabilityαand probability of no service
request Pr{ξi= 0}.
V. CONCLUSION
Operators are sharing infrastructure, more and more. We envision that the trend will continue, towards NwoB, which will necessitate more sophisticated understanding of how to combine wireless network resources to instantiate virtual net-works. In our work we aimed to formulate coverage shaping process, which is one of the fundamental process to underlie NwoB, and quantify the efficiencies that result, under different coverage models, in small and large cities, based on real and synthetic data. Using the real data we showed that considering the multi-operator network infrastructure as a collective may lead to building up coverage provisioning networks which require just a fraction of all the available base stations, even over single-operator networks. In addition, we observed that for low deployment densities the efficiency gains for random and real deployments diverge, which may suggest that Poisson point process might not be an accurate representation for a wireless network deployment in some cases.
Although the primary goal of our study is to illustrate the efficiency gains in inter-operator sharing, we note that this work also has application to improving the energy efficiency of cellular networks. In the latter case, the idea is to turn off a subset of infrastructure assets during times of low demand (say, in the middle of the night), so as to preserve basic coverage but with limited capacity. In the follow up we plan to extend our problem formulations to include power and frequency re-allocations, and capacity provisioning, along with the energy efficiency aspect of coverage shaping.
ACKNOWLEDGMENT
This material is based in part upon work supported by the Science Foundation Ireland under grants no. 10/CE/I1853 and 10/IN.1/3007.
REFERENCES
[1] L. A. DaSilva, J. Kibiłda, P. Di Francesco, T. K. Forde, and L. E.
Doyle, “Customized Services over Virtual Wireless Networks: The Path
towards Networks without Borders,” in Future Network and Mobile
Summit (FNMS), July 2013.
[2] (2009, September) LTE Migration Could Cost Mobile Operators
Up to $1.78 Billion in CAPEX. [Online]. Available: http://www. cellular-news.com/story/39849.php
[3] T. Frisanco, P. Tafertshofer, P. Lurin, and R. Ang, “Infrastructure
Sharing and Shared Operations for Mobile Network Operators: From a
Deployment and Operations View,” inIEEE International Conference
on Communications (ICC), May 2008, pp. 2193–2200.
[4] M. Nawrocki, H. Aghvami, and M. Dohler,Understanding UMTS Radio
Network Modelling, Planning and Automated Optimisation: Theory and Practice. John Wiley & Sons, 2006.
[5] P.-A. Sur, G. Taylor, and T. Robbins-Jones. (2012,
April) We need to talk about Capex: Benchmarking best
practice in telecom capital allocation. PricewaterhouseCoopers.
[Online]. Available: http://www.pwc.com/en_GX/gx/communications/ publications/assets/pwc_capex_final_21may12.pdf
[6] (2012, February) Denmark: Network Sharing Agreement in Danish
Mobile Telecommunications Sector. [Online]. Available: http://ec. europa.eu/competition/ecn/brief/02_2012/dk_mobile.pdf
[7] C. Gabriel. (2011, July) Orange and TMo merge networks in Poland.
Rethink Wireless. [Online]. Available: http://www.rethink-wireless. com/2011/07/22/orange-tmo-merge-networks-poland.htm
[8] T. K. Forde, I. Macaluso, and L. E. Doyle, “Exclusive sharing &
virtualization of the cellular network,” in Proc. IEEE Symp. New
Frontiers in Dynamic Spectrum Access Networks (DySPAN), May 2011, pp. 337–348.
[9] A. Ligeti and J. Zander, “Minimal Cost Coverage Planning for Single
Frequency Networks,” IEEE Transactions on Broadcasting, vol. 45,
no. 1, pp. 78–87, 1999.
[10] E. Amaldi, A. Capone, F. Malucelli, and C. Mannino, “Optimization
problems and models for planning cellular networks,” Handbook of
Optimization in Telecommunication, pp. 879–901, 2006.
[11] A. Caprara and P. Toth, “Algorithms for the Set Covering Problem,”
Annals of Operations Research, vol. 98, pp. 353–371, 2000.
[12] S. Sesia, I. Toufik, and M. Baker, LTE - The UMTS Long Term
Evolution: From Theory to Practice, 2nd ed. John Wiley & Sons, Sep. 2011.
[13] P. Beraldi and A. Ruszczy´nski, “The probabilistic set-covering
prob-lem,”Operations Research, vol. 50, no. 6, pp. 956–967, 2002.
[14] K. Błaszczyk. (2013, April) Urz ˛ad Komunikacji
Elek-tronicznej (UKE). [Online]. Available: http://www.uke.gov.pl/
pozwolenia-radiowe-dla-stacji-gsm-umts-lte-oraz-cdma-4145
[15] “Report ITU-R SM.2028-1;Monte Carlo simulation methodology for
[image:6.612.77.275.290.449.2]