Cell envelope gene expression in phosphate-limited
Bacillus subtilis
cells
Eric Botella,
3
Sebastian Hu¨bner,
3
Karsten Hokamp, Annette Hansen,
4
Paola Bisicchia,
1
David Noone, Leagh Powell, Letal I. Salzberg and
Kevin M. Devine
Correspondence Kevin M. Devine [email protected]
Received 18 February 2011 Revised 26 May 2011 Accepted 27 May 2011
Smurfit Institute of Genetics, Trinity College Dublin, Dublin 2, Ireland
The high phosphate content ofBacillus subtiliscell walls dictates that cell wall metabolism is an important feature of the PhoPR-mediated phosphate limitation response. Here we report the expression profiles of cell-envelope-associated and PhoPR regulon genes, determined by live cell array and transcriptome analysis, in exponentially growing and phosphate-limitedB. subtiliscells. Control by the WalRK two-component system confers a unique expression profile and high level of promoter activity on the genes of its regulon withyocHandcwlOexpression differing both qualitatively and quantitatively from all other autolysin-encoding genes examined. The activity of the PhoPR two-component system is restricted to the phosphate-limited state, being rapidly induced in response to the cognate stimulus, and can be sustained for an extended phosphate limitation period. Constituent promoters of the PhoPR regulon show heterogeneous induction profiles and very high promoter activities. Phosphate-limited cells also show elevated expression of the actin-like protein MreBH and reduced expression of the WapA cell wall protein and WprA cell wall protease indicating that cell wall metabolism in this state is distinct from that of exponentially growing and stationary-phase cells. The PhoPR response is very rapidly deactivated upon removal of the phosphate limitation stimulus with concomitant increased expression of cell wall metabolic genes. Moreover expression of genes encoding enzymes involved in sulphur metabolism is significantly altered in the phosphate-limited state with distinct perturbations being observed in wild-type 168 and AH024 (DphoPR) cells.
INTRODUCTION
The cell envelope of a Gram-positive bacterium such as Bacillus subtilis comprises the cell wall and cytoplasmic membrane and the space located between them. The cell wall is a 3D mesh composed of peptidoglycan to which an anionic polymer such as teichoic acid is covalently attached. Teichoic acid covalently linked to lipid (lipotei-choic acid) is also present at the outer face of the plasma membrane and there are a host of proteins present in all three compartments (Vollmeret al., 2008; Weidenmaier & Peschel, 2008). The cell wall determines the shape of the
bacterium, forms a protective barrier between the cell and the external environment and creates a buffer zone with a distinctive microenvironment in which cell envelope synthetic and maintenance activities can be executed.
The first stage of peptidoglycan synthesis occurs cytoplas-mically where Lipid II [ undecaprenyl-pyrophosphoryl-MurNAc-(pentapeptide)-GlcNAc] is synthesized by the MurAA, MurBCDEFG and MraY enzymes. Lipid II is then flipped across the membrane and incorporated into nascent cell wall peptidoglycan by the transglycosylase and transpeptidase activities of the penicillin-binding proteins (see Bhavsar & Brown, 2006 for review). Cell wall hydrolases (autolysins) cleave mature peptidoglycan to allow insertion of new material into the cell wall during cell elongation and division. The CwlO and LytE endopepti-dase-type autolysins play a crucial role in cell wall synthesis since cells devoid of both autolysins fail to elongate and divide (Bisicchia et al., 2007). Expression of these two autolysins, together with YocH (an amidase-type auto-lysin), YdjM (a cell-wall-associated protein) and FtsZ, are controlled by the WalRK (YycFG) two-component system (TCS), which is activated by a signal emanating from the divisome (Fukuchi et al., 2000; Howell et al., 2003; Abbreviations: LCA, live cell array; Pact, promoter activities; TCS,
two-component system.
3These authors contributed equally to this work.
4Present address:Novozymes, Bagsvaerd, Denmark.
1Present address: Department of Biochemistry, South Parks Road, Oxford, UK.
All raw microarray (pair files) and processed data have been submitted to the GEO database under accession no. GSE23164.
Bisicchiaet al., 2007; Dubracet al., 2008; Fukushimaet al., 2008, 2011). Teichoic acid is synthesized by the activities of the TagABDEFGHO and Mna proteins (see Bhavsar & Brown, 2006 for review). Like peptidoglycan synthesis, teichoic acid polymers are assembled cytoplasmically by the TagABDEFO enzymes using the undecaprenol phosphate lipid carrier, are exported by the TagGH ABC-type transporter and attached to peptidoglycan by enzymes yet to be identified. Expression of the TagABDEFGHO enzymes is constitutive in exponentially growing cells. The synthetic enzymes for both polymers appear to be assembled in individual complexes whose formation and cellular location is influenced by membrane-spanning proteins (e.g. MreCD) and by cytoplasmically located helical filaments composed of actin-like (MreB, Mbl and MreBH) proteins (Carballido-Lo´pez & Formstone, 2007; Formstone et al., 2008; Kawai et al., 2009a). Autolysin localization and function are also influenced by these actin-like proteins and by teichoic acid (Carballido-Lo´pezet al., 2006; Yamamotoet al., 2008).
When B. subtilis cells are exposed to phosphate-limiting conditions, teichoic acid synthesis is repressed and teichuronic acid (a non-phosphate-containing anionic polymer) synthesis is activated, a response that is executed by the PhoPR TCS (Hulett, 2002). Importantly peptido-glycan synthesis continues at a significant rate during this change in anionic polymer composition (Bisicchia et al., 2007). Teichoic acid and peptidoglycan metabolism in B. subtilisare linked in two crucial ways: (i) teichoic acid is covalently bound to peptidoglycan and (ii) the subunits of peptidoglycan (Lipid II) and teichoic acid (undecaprenyl-pyrophosphoryl-GlcNAc-ManNAc-polyglycerol phosphate) synthesis are both assembled intracellularly using the same pool of undecaprenol phosphate (Bhavsar & Brown, 2006; Bouhsset al., 2008; Weidenmaier & Peschel, 2008; Swoboda et al., 2010). Thus coordinate regulation of peptidoglycan
and anionic polymer synthesis must occur during exponen-tial growth and under phosphate-limiting conditions.
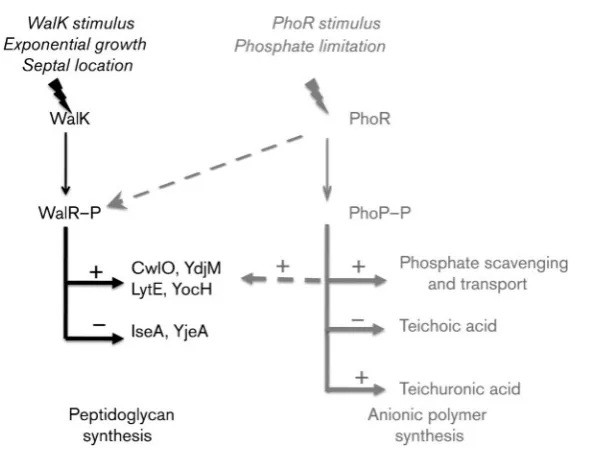
An important feature of the coordinated regulation of peptidoglycan and teichoic acid synthesis emanates from structural similarities and functional overlap of the WalRK and PhoPR TCS (Howellet al., 2006; Bisicchiaet al., 2007, 2010). Our model (Fig. 1) proposes that the WalRK TCS senses cell growth through septal location of WalK and is activated by a signal emanating from the divisome (Fukushimaet al., 2008, 2011). WalR–P activates expression of autolysins (CwlO, YocH and LytE), cell-wall-associated (YdjM) and cell division (FtsZ) proteins while repressing autolysin-modulating (YjeA) and -inhibiting (IseA) activities thereby promoting cell wall synthesis during cell elongation (Bisicchiaet al., 2007; Fukushimaet al., 2008, 2011). During phosphate limitation, the WalK signal is lowered or absent due to reduced growth rate, but peptidoglycan synthesis is still required (Bisicchiaet al., 2007). Therefore in phosphate-limited cells, PhoPR not only induces expression of phosphate-scavenging enzymes and effects a change in anionic polymer synthesis but also plays a role in peptidoglycan synthesis by controlling expression of WalRK regulon autolysins (Bisicchiaet al., 2010). The latter function is achieved through phosphorylation of WalR by the activated non-cognate PhoR kinase and through PhoP– P-mediated activation of WalRK regulon genes (Howell et al., 2006; Bisicchiaet al., 2010). Therefore the activities of WalRK and PhoPR together ensure that peptidoglycan synthesis is maintained and coordinately regulated with anionic polymer metabolism under phosphate-limiting conditions.
[image:2.595.50.355.508.740.2]In this study we combine transcriptome and live cell array (LCA) analysis to establish the changes that occur in gene expression when cells enter the phosphate-limited state. We focus in particular on cell envelope metabolism, on the roles
of the WalRK and PhoPR TCS and on the kinetics of the PhoPR-mediated response to phosphate limitation and replenishment, respectively. We show that entry into the phosphate-limited state triggers extensive changes in gene expression including significant perturbation of sulphur metabolism. Distinctive expression profiles of genes encod-ing cytoskeletal proteins and wall-associated proteins are observed, suggesting that cell envelope structure and metabolism are specifically adapted to the phosphate-limited state. Moreover the very rapid resumption of growth and the high level of cell envelope gene expression that occur when phosphate is added to phosphate-starved cultures of AH024 (DphopR) cells show that the PhoPR TCS adapts cells to phosphate limitation but is not required to maintain viability in the phosphate-limited state.
METHODS
Bacterial strains and growth conditions.All strains used in this study (see Supplementary Table S1, available with the online version of this paper) were maintained and propagated in Luria–Bertani (LB) medium. Escherichia coli TG-1 was transformed under standard procedures and was used for all plasmid constructions (Sambrook et al., 1989).B. subtilis168 and aphoPRnull mutant (AH024, Howell et al., 2003) were used for transcriptome analysis. The B. subtilis tryptophan prototrophic BSB168 (Jules et al., 2009) and AH024 (DphoPR) were transformed using standard procedures (Anagnos-topoulos & Spizizen, 1961). For transcriptome analysis and LCA experiments,B. subtilisstrains were grown in a low-phosphate defined medium (LPDM) or in a high-phosphate defined medium (HPDM) (Mu¨lleret al., 1997). Media were supplemented with antibiotics at the following concentrations as required: ampicillin, 100mg ml21
; specti-nomycin, 100mg ml21; erythromycin, 3mg ml21.
Primer design, and plasmid and strain construction.The list of operons investigated and the constituent genes of each operon are given in Supplementary Table S2 (available with the online version of this paper). Of 135 promoters examined, 109 promoters yielded promoter activities above a 25 unit background threshold. Promoter regions were operationally defined as the entire intergenic region of interest excluding the 18 nt preceding the start codon of the first cistron (to exclude the endogenous ribosome-binding site). To improve plasmid integration by single crossover, the minimum size of each promoter-containing fragment was 400 bp. Thus for intergenic regions smaller than 400 bp, the 39-end of the upstream gene was included in the amplified fragment. All integrations were non-mutagenic (Botellaet al., 2010). Primers designed to specifically amplify each promoter region had ligation-independent cloning (LIC) tails (59 -CCGCGGGC-TTTCCCAGC-39forward primer and 59-GTTCCTCCTTCCCACC-39 reverse primer) added for high throughput cloning. Promoter fragments were generated from genomicB. subtilis168 DNA by PCR using the primers listed in Supplementary Table S3 and were cloned into pBaSysBioII as described by Botellaet al.(2010). The resulting plasmids (see Supplementary Table S4) were sequenced using primer GFP1 and then transformed into BSB168 and AH024 (DphoPR) recipient strains. ThreeB. subtilisclones from each transformation were isolated and used as biological replicates in LCA experiments. Strains are listed in Supplementary Table S1.
B. subtilis LCA methodology. B. subtilis strains were grown overnight in a 96-well plate (BD Falcon 353075) at 37uC in 100ml HPDM supplemented with appropriate antibiotics. These cultures were used to inoculate 100ml cultures of HPDM or LPDM (with no
antibiotic) to OD6000.05 in a 96-well plate (Greiner 655180). The resulting culture plates were incubated with lids in a Synergy multimode microplate reader (BioTek) for 10 h with constant shaking (slow) at 37uC. To determine background fluorescence, six wells were inoculated with the corresponding recipient strain (BSB168 or AH024) on every plate. Fluorescence (excitation 485/20 nm, emission 528/20 nm) and OD600 were measured every 10 min throughout the experiment. For phosphate injection experiments, 5ml of a 73 mM phosphate buffer solution was added to LPDM cultures thereby converting the phosphate concentration to that of HPDM.
Promoter activities were calculated as described previously (Botella et al., 2010) with the following modifications: background fluor-escence of one of the six replicates of parental strain 168 or AH024 (DphoPR) cultures was subtracted from the raw fluorescence of all gfp fusion strains at the same OD600 and from the background fluorescence of the other five replicates of parental strainsB. subtilis strain 168 or AH024 (DphoPR). The value of the remaining background fluorescence of the non-fusion-containing parental strains[B. subtilisstrain 168 or AH024 (DphoPR)]at each time point was then subtracted from the fusion-containing strains at the same time point. Growth and background-corrected fluorescence profiles of all cultures were aligned according to theT0, calculated as the time at which the culture stops growing exponentially using the Heat Map Generator web software. Promoter activities (Pact) were calculated by taking the derivative of the fluorescence divided by the OD600 [(DGFP/DTime)/OD600] at each time point and smoothed by averaging the activity values of three consecutive time points as described in detail by Botellaet al.(2010). At least three independent isolates of each fusion-containing strain (three biological replicates) were analysed and at least two Pactdeterminations of each isolate were performed on two different Biotek microplate readers by different operatives under all conditions (at least two technical replicates). Importantly, by quantifying the Pactof cell wall protein and PhoPR regulon promoters in this standard manner, the promoter strengths and kinetics of activity for the 135 cell-wall-associated genes can be compared directly. Promoter activities were uploaded to the Heat Map Generator software platform for generation of heat maps and for analysis. To avoid artefacts, data collected during the first 20 min of each growth curve were not used for promoter activity determination and Pactvalues below 25 units were considered to be background and assigned a value of zero.
files) as well as processed data have been submitted to the GEO database under accession no. GSE23164.
Heat Map Generator. To generate heat map images a modified version of a tool called ArrayPipe (Hokampet al., 2004) was used. ArrayPipe serves mainly for the analysis of microarray data but also includes a web-based spreadsheet for online data mining. After modifications to the output format of the HTML table and colouring the cells according to the values contained therein, the data presentation turns from text format into an online heat map that can also be saved in PDF and PNG format. A freely available web-based tool dedicated to the generation of heat maps from LCA data has been set up at http://bioinf.gen.tcd.ie/HMG/. The Heat Map Generator provides methods for processing tab-delimited data files, including smoothing, scaling and merging of replicates. The results are then transferred into the ArrayPipe online spreadsheet with preset parameters so that a heat map is created. The output in the form of a web page can be password-protected, bookmarked and shared with others. It can also be used for further data manipulation, such as clustering and attachment of annotations. Detailed documentation for users is available online.
RESULTS AND DISCUSSION
Validation of promoter activity profiles determined by LCA technology
The complementary approaches of LCA and transcriptome analyses using a high-density (tiled) microarray were adopted to establish the changes in gene expression (Pact,
promoter activity and RNA abundance) that occur under our experimental conditions (Botellaet al., 2010; Rasmussen et al., 2009). The high throughput nature of LCA analysis has allowed us to determine, with a time resolution of 10 min, the Pact of 135 cell wall protein promoters and PhoPR
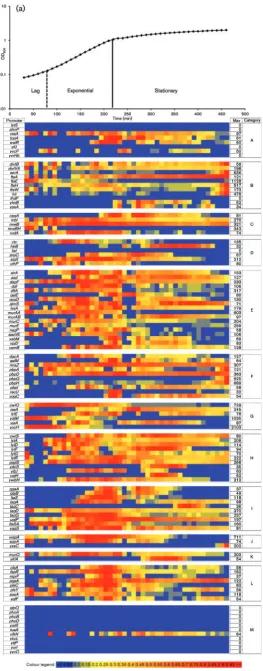
regulon promoters that direct expression of a total of 300 genes during growth in HPDM, in LPDM and during phosphate replenishment of phosphate-limited cells (Fig. 2 and Supplementary Figs S1 and S2, available with the online version of this paper). Results were visualized in a heat map format generated by Heat Map Generator, a web-based tool developed by us for this study (available at http://bioinf.gen. tcd.ie/HMG/). The numerical value of the maximum Pactof
each transcriptional fusion in each growth condition is shown to the right of each row (max value, Fig. 2 and Supplementary Figs S1 and S2). By referring to the colour legend (showing the fraction of the maximum Pact
represented by each colour), numerical Pactvalues for each
fusion can be established at all growth stages and the strengths of different promoters can be compared. The combined LCA/transcriptome approach allows promoter activities to be correlated with relative RNA transcript abundance – this correlation is valid for the two time points at which RNA was sampled (exponentially growing and phosphate-limited cells, Fig. 2b, c and Supplementary Fig. S2). Differences in relative RNA transcript abundance between exponentially growing and phosphate-limited cells are shown for wild-type (Fig. 2b and Supplementary Fig. S2) and AH024 (DphoPR) (Fig. 2c) cultures. To validate the Pact
profiles established by LCA in this study, we compared the reported expression of several genes that have distinctive
profiles (murAA,murAB,cwlSand genes of the WalRK and PhoPR regulons) with the kinetics of Pactestablished in this
study. Previous studies show (i) that murAA expression (RNA accumulation) is confined to exponential growth and is turned off when cells enter stationary phase whilemurAB is expressed (RNA accumulation) during stationary phase (Kocket al., 2004); (ii) thatcwlSis expressed (RNA and LacZ accumulation) at significant levels during late exponential growth and early stationary phase (Fukushimaet al., 2006); (iii) that expression (RNA accumulation) of WalRK regulon genes yocH, cwlO and ydjM is highest immediately after inoculation into HPDM medium but decreases to a low level thereafter even while cells are growing exponentially (Howell et al., 2003, 2006) and (iv) that PhoPR regulon genes are induced (RNA and LacZ accumulation) upon phosphate limitation (Allenbyet al., 2005; Hulett, 2002 and references therein; Pra´gai & Harwood, 2002). The Pactprofiles for these
genes determined using transcriptional gfp fusions in this study (Fig. 2, Supplementary Figs S1 and S2) are consistent with their RNA and/or LacZ accumulation profiles estab-lished in the cited studies, supporting the view that the Pact
profiles accurately reflect promoter activity.
Population heterogeneity of promoter fusion expression
The promoter activity values determined in this study reflect total GFP production in the cell population. However, the activity of a promoter expressed heterogeneously in the cell population would be underestimated in this analysis. We therefore examined GFP production microscopically in 58 strains during exponential growth and phosphate limitation. The chosen strains represent all the categories listed in Fig. 2(a and b), eight of the strains in which GFP expression was below the threshold of detection and all genes whose expression is controlled by a regulator in addition to, or other than, SigA. Uniform GFP expression of PhoPR-regulated genes was observed in phosphate-limited cells. The five promoter fusions (dltA,lytA,lytD,lytFandyjbJ), whose expression is controlled by SigD, are expressed at relatively low levels (Fig. 2b, c). We observed only low fluorescence in these populations microscopically and did not detect population heterogeneity, probably due to the low expres-sion level. Since heterogeneity of SigD-regulated promoters has been documented (e.g. the hag gene) it is likely that expression of these five genes is heterogeneous within these populations, implying that their maximum promoter activities reported here are an underestimate of that present in expressing cells. Population heterogeneity was not observed in any of the other strains examined.
General features of cell envelope metabolism during growth and in the phosphate-limited state
Fig. 2.Heat map representation of the activities of promoters that direct expression of operons encoding cell-envelope-related genes. Growth and promoter activity (Pact) of
2003, 2006; Allenbyet al., 2005; Bisicchiaet al., 2007, 2010). We therefore established promoter activity and relative mRNA abundance for a comprehensive list of cell-envelope-associated and PhoPR regulon genes (of 135 promoters tested, 109 had Pact above the applied threshold of 25
arbitrary GFP units). Our results are presented in two formats to facilitate analysis of this large dataset. The first format groups the genes under 13 headings (Fig. 2) each of which is a subprocess of cell wall metabolism inB. subtilis: transcriptional regulators (A); cell division (B); cell shape (C); cell and envelope stress (D); Lipid II synthesis (E); penicillin-binding proteins (F); WalRK regulon (G); auto-lysins (not controlled by WalRK) (H); teichoic, minor teichoic and lipoteichoic acid (I); wall proteins (J); wall recycling (K); phospholipid synthesis (L); and the PhoPR regulon (M). The second format clusters the genes according to their expression profiles (Supplementary Figs S1 and S2). In general, Pactof the genes encoding enzymes for Lipid II,
lipoteichoic acid and phospholipid synthesis, together with those encoding cell division and penicillin-binding proteins was commensurate with the growth status of the culture, i.e. Pact values were maximal in exponentially growing cells,
lower (ranging from ~20–80 % of maximum activity) in phosphate-limited wild-type cells and greatly reduced (,10 %, sometimes reaching ~20 % sporadically) in phos-phate-limited AH024 (DphoPR) cells. These observations are in accordance with the observed growth and peptidoglycan synthesis rates reported (Bisicchia et al., 2007). Although phosphate limitation generates a general stress[expression of the SigB-regulated gene ctc is induced in wild-type (180 units) and to an even greater extent in AH024 (DphoPR) cells (309 units)]it did not appear to engender a cell envelope stress, since genes diagnostic of ECF-type sigma factor activation, LiaRS, or those encoding HtrA-type proteases were not significantly induced in wild-type or more notably even in AH024 (DphoPR) cells.
WalRK- and PhoPR-activated promoters have high Pactvalues
Maximum Pactfor the great majority of the 109 promoters
ranged from 0 to 700 units for exponentially growing cells and from 0 to 500 units for phosphate-limited cells (Fig. 3). It is striking that the maximum Pactof most WalRK- and
PhoPR-activated promoters [the exceptions being cwlO (359 units) andyurI(406 units) in phosphate-limited cells] was significantly higher than the upper limit of these ranges (Fig. 3). Thus WalRK- and PhoPR-mediated control directs a very high level of promoter activity in addition to making expression of their regulons sensitive to the activating stimuli of their respective sensor kinases.
Expression of WalRK regulon autolysins YocH and CwlO is unique among the cohort of autolysins investigated
Promoter activity of eight known autolysin-encoding genes was examined in this study: cwlS (encoding an
endopeptidase), the major cell autolysin lytC (lytA promoter, encoding an amidase), lytD (encoding an N-acetylglucosaminidase), lytF (encoding a c-D glutamate meso DAP muropeptidase) and lytG(encoding a glucosa-minidase), andcwlO,yocHandlytE, which are members of the WalRK regulon. The profile and expression level of two WalRK regulon autolysins (CwlO and YocH) differed greatly from those of the other autolysins examined (regulation of LytE expression is complex and not solely dependent on WalRK): maximum Pactlevels of CwlO and
YocH were observed immediately upon inoculation in the lag phase of the growth cycle while Pact for the other
[image:8.595.312.556.68.364.2]autolysins remained at ,10 % of maximum during this period. The maximum promoter activities of cwlO (359 units) andyocH(2623 units) were significantly higher than those of the other autolysins (cwlS, 56 units; lytA, 134 units;lytD, 38 units;lytF, 20 units andlytG, 60 units), whose maximum Pact values were observed during
Fig. 3. Distribution of promoter strengths of the 109 promoters that direct expression of operons encoding cell-envelope-related genes inB. subtilis. Genes are categorized into bins according to the maximum promoter activity (Pact) attained during growth in
HPDM (a) and LPDM (b). The number of promoters in each bin is shown on the y-axis while the promoter activity range (,100 signifies Pactin the range 0–100;,200 signifies Pactin the range
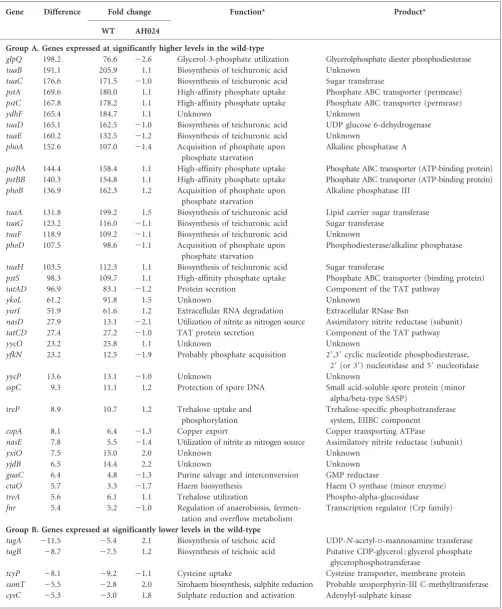
Table 1.Differences in the relative RNA abundance between phosphate-limited wild-type and AH024 (DphoPR) cells
Only differences of fivefold or greater are shown. For all genes with difference values greater than twofold see Supplementary Tables S7–S10.
Gene Difference Fold change Function* Product*
WT AH024
Group A. Genes expressed at significantly higher levels in the wild-type
glpQ 198.2 76.6 22.6 Glycerol-3-phosphate utilization Glycerolphosphate diester phosphodiesterase tuaB 191.1 205.9 1.1 Biosynthesis of teichuronic acid Unknown
tuaC 176.6 171.5 21.0 Biosynthesis of teichuronic acid Sugar transferase
pstA 169.6 180.0 1.1 High-affinity phosphate uptake Phosphate ABC transporter (permease) pstC 167.8 178.2 1.1 High-affinity phosphate uptake Phosphate ABC transporter (permease)
ydhF 165.4 184.7 1.1 Unknown Unknown
tuaD 165.1 162.5 21.0 Biosynthesis of teichuronic acid UDP glucose 6-dehydrogenase tuaE 160.2 132.5 21.2 Biosynthesis of teichuronic acid Unknown
phoA 152.6 107.0 21.4 Acquisition of phosphate upon phosphate starvation
Alkaline phosphatase A
pstBA 144.4 158.4 1.1 High-affinity phosphate uptake Phosphate ABC transporter (ATP-binding protein) pstBB 140.3 154.8 1.1 High-affinity phosphate uptake Phosphate ABC transporter (ATP-binding protein) phoB 136.9 162.3 1.2 Acquisition of phosphate upon
phosphate starvation
Alkaline phosphatase III
tuaA 131.8 199.2 1.5 Biosynthesis of teichuronic acid Lipid carrier sugar transferase tuaG 123.2 116.0 21.1 Biosynthesis of teichuronic acid Sugar transferase
tuaF 118.9 109.2 21.1 Biosynthesis of teichuronic acid Unknown phoD 107.5 98.6 21.1 Acquisition of phosphate upon
phosphate starvation
Phosphodiesterase/alkaline phosphatase
tuaH 103.5 112.3 1.1 Biosynthesis of teichuronic acid Sugar transferase
pstS 98.3 109.7 1.1 High-affinity phosphate uptake Phosphate ABC transporter (binding protein) tatAD 96.9 83.1 21.2 Protein secretion Component of the TAT pathway
ykoL 61.2 91.8 1.5 Unknown Unknown
yurI 51.9 61.6 1.2 Extracellular RNA degradation Extracellular RNase Bsn
nasD 27.9 13.1 22.1 Utilization of nitrite as nitrogen source Assimilatory nitrite reductase (subunit) tatCD 27.4 27.2 21.0 TAT protein secretion Component of the TAT pathway
yycO 23.2 25.8 1.1 Unknown Unknown
yfkN 23.2 12.5 21.9 Probably phosphate acquisition 29,39cyclic nucleotide phosphodiesterase, 29(or 39) nucleotidase and 59nucleotidase
yycP 13.6 13.1 21.0 Unknown Unknown
sspC 9.3 11.1 1.2 Protection of spore DNA Small acid-soluble spore protein (minor alpha/beta-type SASP)
treP 8.9 10.7 1.2 Trehalose uptake and phosphorylation
Trehalose-specific phosphotransferase system, EIIBC component
copA 8.1 6.4 21.3 Copper export Copper transporting ATPase
nasE 7.8 5.5 21.4 Utilization of nitrite as nitrogen source Assimilatory nitrite reductase (subunit)
yxiO 7.5 15.0 2.0 Unknown Unknown
yjdB 6.5 14.4 2.2 Unknown Unknown
guaC 6.4 4.8 21.3 Purine salvage and interconversion GMP reductase
ctaO 5.7 3.3 21.7 Haem biosynthesis Haem O synthase (minor enzyme) treA 5.6 6.1 1.1 Trehalose utilization Phospho-alpha-glucosidase fnr 5.4 5.2 21.0 Regulation of anaerobiosis,
fermen-tation and overflow metabolism
Transcription regulator (Crp family)
Group B. Genes expressed at significantly lower levels in the wild-type
tagA 211.5 25.4 2.1 Biosynthesis of teichoic acid UDP-N-acetyl-D-mannosamine transferase tagB 28.7 27.5 1.2 Biosynthesis of teichoic acid Putative CDP-glycerol : glycerol phosphate
glycerophosphotransferase
exponential growth. These expression features suggest that CwlO and YocH have significantly different functions to the other cellular autolysins examined. More-over the differing profiles and levels of the remaining known and putative autolysins show that a complex array of autolysin activities and levels is required for normal cell wall metabolism.
MreBH expression is distinct from its paralogues MreB and Mbl
The actin-like proteins MreB, Mbl and MreBH have overlapping cellular functions and play an important role
(together with MreCD and MinCD, which are encoded in the mreB operon) in positioning the cell wall synthetic machinery and in cell shape (Jones et al., 2001; Leaver & Errington, 2005; Carballido-Lo´pez et al., 2006; Kawai et al., 2009a, b). Our results show thatmreBHexpression differs from that of mreB and mbl in phosphate-limited cells, suggesting that it performs distinct functions under these conditions (Fig. 2 and Supplementary Figs S1 and S2). The maximum Pactof themreBandmbloperons was
~330 units in wild-type cells growing exponentially in HPDM (Fig. 2a) and LPDM (Fig. 2b). The Pact of both
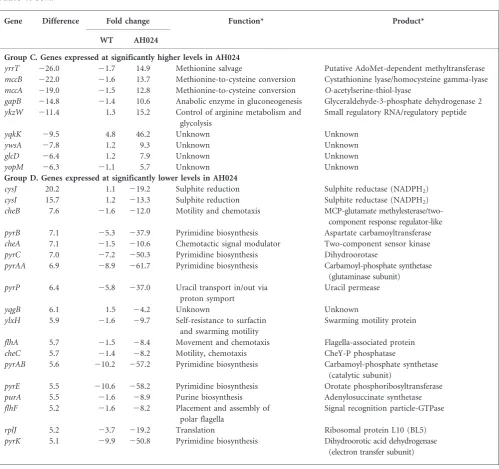
[image:10.595.53.553.74.543.2]operons continued at ~50–100 % (mreB) and 20–40 % (mbl) of maximum activity in stationary-phase cells (Fig. Table 1.cont.
Gene Difference Fold change Function* Product*
WT AH024
Group C. Genes expressed at significantly higher levels in AH024
yrrT 226.0 21.7 14.9 Methionine salvage Putative AdoMet-dependent methyltransferase mccB 222.0 21.6 13.7 Methionine-to-cysteine conversion Cystathionine lyase/homocysteine gamma-lyase mccA 219.0 21.5 12.8 Methionine-to-cysteine conversion O-acetylserine-thiol-lyase
gapB 214.8 21.4 10.6 Anabolic enzyme in gluconeogenesis Glyceraldehyde-3-phosphate dehydrogenase 2 ykzW 211.4 1.3 15.2 Control of arginine metabolism and
glycolysis
Small regulatory RNA/regulatory peptide
yqkK 29.5 4.8 46.2 Unknown Unknown
ywsA 27.8 1.2 9.3 Unknown Unknown
glcD 26.4 1.2 7.9 Unknown Unknown
yopM 26.3 21.1 5.7 Unknown Unknown
Group D. Genes expressed at significantly lower levels in AH024
cysJ 20.2 1.1 219.2 Sulphite reduction Sulphite reductase (NADPH2) cysI 15.7 1.2 213.3 Sulphite reduction Sulphite reductase (NADPH2) cheB 7.6 21.6 212.0 Motility and chemotaxis MCP-glutamate
methylesterase/two-component response regulator-like pyrB 7.1 25.3 237.9 Pyrimidine biosynthesis Aspartate carbamoyltransferase cheA 7.1 21.5 210.6 Chemotactic signal modulator Two-component sensor kinase pyrC 7.0 27.2 250.3 Pyrimidine biosynthesis Dihydroorotase
pyrAA 6.9 28.9 261.7 Pyrimidine biosynthesis Carbamoyl-phosphate synthetase (glutaminase subunit) pyrP 6.4 25.8 237.0 Uracil transport in/out via
proton symport
Uracil permease
yqgB 6.1 1.5 24.2 Unknown Unknown
ylxH 5.9 21.6 29.7 Self-resistance to surfactin and swarming motility
Swarming motility protein
flhA 5.7 21.5 28.4 Movement and chemotaxis Flagella-associated protein cheC 5.7 21.4 28.2 Motility, chemotaxis CheY-P phosphatase
pyrAB 5.6 210.2 257.2 Pyrimidine biosynthesis Carbamoyl-phosphate synthetase (catalytic subunit)
pyrE 5.5 210.6 258.2 Pyrimidine biosynthesis Orotate phosphoribosyltransferase purA 5.5 21.6 28.9 Purine biosynthesis Adenylosuccinate synthetase flhF 5.2 21.6 28.2 Placement and assembly of
polar flagella
Signal recognition particle-GTPase
rplJ 5.2 23.7 219.2 Translation Ribosomal protein L10 (BL5)
pyrK 5.1 29.9 250.8 Pyrimidine biosynthesis Dihydroorotic acid dehydrogenase (electron transfer subunit)
2a) but was reduced to ,10 % of maximal activity in phosphate-limited cells (Fig. 2b). Moreover the abund-ance ofmreBandmblRNA transcripts was approximately three- to fourfold lower in phosphate-limited cells than in exponentially growing cells, consistent with these Pact
profiles (Fig. 2c). Expression ofmreBHdiffered from that of mreB and mbl under these conditions: in HPDM, expression was initially high (Pact 343 units) in lag phase
cells, but fell to a very low level (,5 %) in exponentially growing and stationary-phase cells (Fig. 2a). In cells growing exponentially in LPDM, mreBH expression is significantly lower (Pact~53 units) than that ofmreBand
mblbut is maintained at 50–100 % of maximum activity throughout the phosphate limitation period (Fig. 2b). These promoter activity profiles are supported by the observation that mreBH RNA transcripts increased approximately twofold whereasmreB andmbltranscripts decreased three- to fourfold upon phosphate limitation (Fig. 2b). Expression of mreBH was also distinguished from that ofmreBandmblupon addition of phosphate to phosphate-limited cells. The Pact of mreB and mbl were
immediately induced to maximum levels and remained at 50–100 % of maximum activity for up to 150 min whereas the Pact of mreBH was reduced to ,5 % of maximum
activity within 60 min and remained at this level for the remainder of the experiment. These expression profiles distinguish the paralogous actin-like genes from each other and suggest that MreB and Mbl predominate in exponentially growing cells whereas MreBH may predom-inate in phosphate-limited cells. Soufo & Graumann (2010) show that MreB, Mbl and MreBH have different architectures but influence each other’s architecture when co-expressed. Thus the altered proportions of actin-like proteins indicated by these expression studies suggest that cell morphogenesis, cell wall metabolism or place-ment of the peptidoglycan synthetic machinery may differ considerably in exponentially growing and phos-phate-limitedB. subtilis cells (Daniel & Errington, 2003; Divakaruni et al., 2005, 2007; Carballido-Lo´pez & Formstone, 2007).
Expression of WapA and WprA is greatly reduced in phosphate-limited cells
Expression of the wall-associated protein WapA (Serizawa et al., 2005) and wall protease WprA (Babe´ & Schmidt, 1998) differs significantly between exponentially growing and stationary-phase cells (Fig. 2a) and phosphate-limited cells (Fig. 2b). The PactofwapAwas maximal (~711 units)
throughout exponential growth in HPDM and continued at 20–50 % of this activity for a considerable period of the stationary phase (Fig. 2a). However, while the PactofwapA
in wild-type cells was also maximal during exponential growth in LPDM (~470 units), it was reduced to,5 % of maximum activity at the onset of, and throughout, phosphate limitation (Fig. 2b). The expression profiles of wprAare similar to those of wapAalthough Pactlevels are
considerably lower (74–175 units, Fig. 2b). Moreover Pact
values for bothwapAandwprAwere restored to maximum upon phosphate replenishment of phosphate-limited cells (Fig. 2b, c). Transcriptome analysis supports these Pact
profiles: the relative abundances of wapA and wprA transcripts in phosphate-limited wild-type cells was 20-and 16-fold lower than in exponentially growing cells (Fig. 2b, c, and see Supplementary Table S5, available with the online version of this paper). It is indeed interesting that both WapA and WprA are members of the regulon of the YvrGHb TCS, together with the cell-envelope-associated lytABC and dltABCDE operons (Serizawa et al., 2005). Thus we suggest that the YvrGHb TCS may be involved in adaptation of cell wall metabolism to the phosphate-limited state. The precise functions of WapA and WprA are unknown; ascribing a function to them should yield insight into how their absence facilitates cell envelope adaptation to the phosphate-limited state.
PhoPR function is restricted to the phosphate-limited state
Several new features of the PhoPR-mediated phosphate limitation response emerge from this study. The gene expression profile of cells in the phosphate-limited state differed significantly from that of exponentially growing cells. The relative RNA abundance of ~35 % (1484) and ~43 % (1821) of gene expression changed (increased and decreased in approximately equal numbers) more than twofold when wild-type and AH024 (DphoPR) strains, respectively, became phosphate limited (Supplementary Tables S5, S6, available with the online version of this paper). Of the gene cohort with altered expression, the RNA abundance of 1232 genes changed more than twofold in both wild-type and AH024 (DphoPR) cells. However, importantly there was no significant difference in the relative RNA abundance of any gene when exponentially growing wild-type and AH024 (DphoPR) cells were compared (data not shown). Thus, although phoPR is expressed and the PhoPR proteins are present in exponentially growing cells (Sun et al., 1996; Pra´gai & Harwood, 2002; Bisicchiaet al., 2010) PhoPR function is completely restricted to the phosphate-limited state.
Activation and deactivation of the PhoPR-mediated phosphate limitation response
between the number of PhoP boxes/consensus boxes, the order of gene induction and the level of promoter activity (Pact), indicating significant complexity of the PhoPR
regulon promoter structure. A second important feature is that maximal Pactlevels of the PhoPR-controlled
promo-ters are sustained throughout an extended (~5 h) period of phosphate limitation. Such sustained maximal Pact values
contrast with the fluctuating values observed for the majority of the other cell-wall-associated promoters examined in this study (Fig. 2, Supplementary Figs S1 and S2). Thus, the PhoR stimulus clearly persists throughout this period, maintaining the adaptive response. A third feature is the speed with which PhoPR regulon promoters are deactivated upon addition of phosphate to cultures of phosphate-limited cells (Fig. 2a). The Pact of
PhoPR regulon genes in wild-type cells is reduced to,5 % maximal activity in the 10–20 min interval after phosphate addition (Fig. 2b). Thus the rapid deactivation of the PhoR kinase is on the timescale of metabolite fluctuations, suggesting that the signal emanates from this source. The study by Shi & Hulett (1999) reporting that a partial phosphate limitation response can be induced by a truncated PhoR kinase located cytoplasmically is consistent with the contention that at least part of its activating signal stems from metabolic processes within the cell. Importantly there is a rapid and significant increase in the Pact of cell-wall-associated genes upon addition of
phosphate to cultures of phosphate-limited cells. Of particular interest is the observation that both wild-type and AH024 (DphoPR) cells show similar increased promoter activities (Pact). Together these findings show
that the PhoPR response is maintained throughout phosphate limitation, adapting cells to this stress condition and maintaining a lowered growth rate. However, it is not required for cell viability since cell wall gene expression in AH024 (DphoPR) cells increases with similar kinetics to similar levels to that in wild-type cells upon phosphate replenishment.
Contribution of PhoPR to the physiology of phosphate-limited cells
The direct and indirect contributions of PhoPR to the physiology of phosphate-limited cells can be gauged by the profile of gene expression changes that occur in its presence (i.e. in wild-type cells) and absence [i.e. in AH024 (DphoPR)]. In phosphate-limited wild-type cells, the relative RNA abundance of 149 genes shows significant changes of at least twofold, among which are members of the PhoPR regulon (see next section): transcripts of 115 genes increase and of 34 genes decrease (see Supplementary Tables S7 and S8, available with the online version of this paper). The number of genes with decreased expression is fewer than found by Allenby et al. (2005) who reported decreased expression of 69 genes including genes encoding proteins involved in DNA synthesis, transcription and translation. Among genes downregulated in our study are those involved in teichoic acid, biotin, cobalamin and sulphur (see below)
metabolism, but not genes involved in central metabolic processes (Table 1, group B). These differences from the study by Allenbyet al.(2005) are probably due to variations in strain, media [LPDM utilized in this study contains 53mM phosphate (Mu¨lleret al., 1997) while LPDM medium contained 420mM phosphate in the study by Allenbyet al. (2005)]and method of analysis (their transcriptome analysis was performed with macroarrays).
In phosphate-limited AH024 (DphoPR) cells, the relative RNA abundance of 437 genes shows significant changes of at least twofold: transcripts of 210 genes increased and of 227 genes decreased (see Supplementary Tables S9 and S10, available with the online version of this paper). Among the cohort of 227 genes whose expression decreased are those encoding proteins involved in the central cellular processes including DNA synthesis, translation, cell division and energy production. Expression of these genes does not change to this extent when wild-type 168 cells are phosphate limited. These expression profiles are consistent with continued growth of wild-type cells, but growth cessation of AH024 (DphoPR) cells under phosphate-limiting conditions. Importantly, with the exception of the genes encoding teichoic/teichuronic acid synthesis, cell wall genes do not feature significantly among these gene cohorts, showing that cell wall metabolism continues at an appreciable rate in both wild-type and AH024 (DphoPR) cells, consistent with the observations of Bisicchia et al.(2007). Thus the consequence of PhoPR-mediated adaptation to phos-phate-limiting conditions is to maintain gene expression profiles similar to growing and dividing cells in agreement with the observations reported (Bisicchia et al., 2010). However, the PhoPR response is not required to maintain cell viability since AH024 (DphoPR) cells resume growth rapidly even after an extended period of phosphate limitation.
The PhoPR regulon
The combined transcriptome (using a tiled array) and LCA analysis allowed refinement of the constituent members of the PhoPR regulon and their relative induction levels upon phosphate limitation. A comparison of the transcriptomes of phosphate-limited wild-type and AH024 (DphoPR) cells showed that the RNA abundance of 36 genes increases at least fivefold and that of five genes decreases at least fivefold (Table 1, groups A and B) in wild-type cells only. This gene cohort composes the potential PhoPR regulon. Of the upregulated genes, 27 (Table 1, group A, the top 26 genes excludingnasDbut includingphoPR, which is not included in this table as it is induced only approximately threefold upon phosphate limitation) were previously identified as members of the PhoPR regulon (Hulett, 2002; Pra´gai & Harwood, 2002; Allenbyet al., 2005). Although the Pactof
upon phosphate limitation in a PhoPR-dependent manner while Allenbyet al.(2005) reported a 3.6-fold induction of yycOin a wild-type strain and a 15-fold induction in a SigB mutant strain. Together these results are consistent with the yycOP operon being a bona fide member of the PhoPR regulon. Among the remaining genes in Table 1, group A, we confirm thatyjdB,yfkNandyurIare members of the PhoPR regulon but do not confirm thatyttP,vpr,yhaXoryhbHare members of this regulon as reported by Pra´gai & Harwood (2002) and Allenby et al.(2005). Moreover, in this study trePARandyxiOoperons are also potential PhoPR regulon members by virtue of having potential PhoP boxes in their respective promoters. The increased abundance of nasD transcripts is probably mediated indirectly through PhoP–P activation of resDE expression (Table 1, group A; Supplementary Table S7; Birkey et al., 1998), a view supported by the increased transcript abundance of other ResDE regulon genes (nasE,fnr,ctaOandctaD). Our study also reveals theyfkNpromoter to be unique among PhoPR regulon members in being active at a low level (Pact64 units)
in the absence of phosphate stress (Fig. 2a). Importantly, the high and sustained activities of PhoPR regulon promoters upon induction (Fig. 2b) are consistent with the high induction ratios of PhoPR regulon genes revealed by the transcriptome analysis.
The PhoPR response plays a central role in cell wall anionic polymer metabolism upon phosphate limitation. Our results (Fig. 2b) confirm that promoter activity of the teichuronic acid synthetic operon (tuaABCDEFGH) increases very significantly while promoter activity of tagABdecreases to ¡10 % maximal activity in agreement with previous studies (Liu et al., 1998; Lahooti & Harwood, 1999). Interestingly, the promoter activity of thetagDEFoperon is maintained at up to 25 % and that of the tagGH operon occurs sporadically at up to 15 % of their maximal values during phosphate limitation. The relative RNA abundance of thetuaABCDEFGHandtagAB operons is consistent with these promoter activities. Moreover the relative abundance of tagDEF and tagGH transcripts does not change appreciably in phosphate-limited cells (Fig. 2b), consistent with the continued activity of their promoters and strongly suggesting that teichoic acid synthesis occurs in phosphate-limited cells. To address this question we examined the morphology of cells incapable of synthesizing teichuronic acid (complete deletion of thetuaABCDEFGH) in the phosphate-limited state. These cells grew normally, entered the phosphate-limited state at the same time as wild-type cells and remained rod-shaped and were indistinguishable from wild-type cells throughout phosphate limitation (data not shown). In contrast, cells depleted for teichoic acids were spherical (data not shown), as previously reported (D’Elia et al., 2006). These observations support our expression analysis (transcriptome and LCA) showing that teichoic acid continues to be synthesized in phosphate-limited cells to an extent sufficient to maintain the normal shape of the bacterium.
Sulphur metabolism in the phosphate-limited state
A novel feature of our transcriptome analysis is the perturbation of sulphur metabolism that occurs in both wild-type and AH024 (DphoPR) cells in response to phosphate limitation. Transcript abundance of two operons is significantly reduced in wild-type cells upon phosphate limitation (Table 1, group B): there is an approximately eightfold reduction in the tcyP (yhcL) operon transcript, which encodes anL-cystine transporter (Burguie`re et al., 2004), and an approximately three- to fivefold reduction in the[(cysH)cysP sat cysC ylnD ylnE ylnF]operon transcript, which encodes enzymes involved in sulphate uptake and in its conversion to sulphide (Mansilla & de Mendoza, 2000; Mansillaet al., 2000). The promoters of these operons do not contain potential PhoP boxes, suggesting that regulation is indirect. In addition, expression of several sulphur-metabolism-associated operons is also altered when AH024 (DphoPR) cells become phosphate limited (Table 1, groups C and D): transcript levels of theyrrT,mccAandmccBgenes, which encode enzymes involved in conversion of methio-nine to cysteine, are increased ~13-fold (Hulloet al., 2007) while transcripts of thecysIJoperon (CysI encodes a sulphite reductase) are decreased ~16-fold. The rationale of these gene expression changes under phosphate-limiting condi-tions is not entirely clear. However, they are indicative of a perturbation in sulphur metabolism that merits further investigation.
ACKNOWLEDGEMENTS
This work was supported by BaSysBio grant LSHG-CT-2006-037469 and by Science Foundation Ireland Award 08/IN.1/B1859 to K. M. D. P. B. was partly supported by an Irish Research Council for Science, Engineering and Technology (IRCSET) award. The authors would like to thank the Live Cell Array group of BaSysBio and Isabelle Martin-Verstraete for helpful discussions, and Pierre Nicolas and Philippe Bessieres for help with the transcriptome analysis.
REFERENCES
Allenby, N. E., O’Connor, N., Pra´gai, Z., Ward, A. C., Wipat, A. & Harwood, C. R. (2005).Genome-wide transcriptional analysis of the phosphate starvation stimulon ofBacillus subtilis.J Bacteriol187, 8063–8080.
Anagnostopoulos, C. & Spizizen, J. (1961). Requirements for transformation inBacillus subtilis.J Bacteriol81, 741–746.
Babe´, L. M. & Schmidt, B. (1998). Purification and biochemical analysis of WprA, a 52-kDa serine protease secreted byB. subtilisas an active complex with its 23-kDa propeptide. Biochim Biophys Acta 1386, 211–219.
Bhavsar, A. P. & Brown, E. D. (2006).Cell wall assembly inBacillus subtilis: how spirals and spaces challenge paradigms.Mol Microbiol60, 1077–1090.
Bisicchia, P., Noone, D., Lioliou, E., Howell, A., Quigley, S., Jensen, T., Jarmer, H. & Devine, K. M. (2007).The essential YycFG two-component system controls cell wall metabolism inBacillus subtilis.Mol Microbiol 65, 180–200.
Bisicchia, P., Lioliou, E., Noone, D., Salzberg, L. I., Botella, E., Hu¨bner, S. & Devine, K. M. (2010). Peptidoglycan metabolism is controlled by the WalRK (YycFG) and PhoPR two-component systems in phosphate-limitedBacillus subtiliscells.Mol Microbiol75, 972–989.
Bolstad, B. M., Irizarry, R. A., Astrand, M. & Speed, T. P. (2003). A comparison of normalization methods for high density oligonu-cleotide array data based on variance and bias.Bioinformatics19, 185– 193.
Botella, E., Fogg, M., Jules, M., Piersma, S., Doherty, G., Hansen, A., Denham, E. L., Le Chat, L., Veiga, P. & other authors (2010). pBaSysBioII: an integrative plasmid generating gfp transcriptional fusions for high-throughput analysis of gene expression in Bacillus subtilis.Microbiology156, 1600–1608.
Bouhss, A., Trunkfield, A. E., Bugg, T. D. H. & Mengin-Lecreulx, D. (2008). The biosynthesis of peptidoglycan lipid-linked inter-mediates.FEMS Microbiol Rev32, 208–233.
Burguie`re, P., Auger, S., Hullo, M. F., Danchin, A. & Martin-Verstraete, I. (2004). Three different systems participate in L-cystine uptake in
Bacillus subtilis.J Bacteriol186, 4875–4884.
Carballido-Lo´pez, R. & Formstone, A. (2007).Shape determination inBacillus subtilis.Curr Opin Microbiol10, 611–616.
Carballido-Lo´pez, R., Formstone, A., Li, Y., Ehrlich, S. D., Noirot, P. & Errington, J. (2006).Actin homolog MreBH governs cell morpho-genesis by localization of the cell wall hydrolase LytE. Dev Cell11, 399–409.
Daniel, R. A. & Errington, J. (2003).Control of cell morphogenesis in bacteria: two distinct ways to make a rod-shaped cell.Cell113, 767– 776.
D’Elia, M. A., Millar, K. E., Beveridge, T. J. & Brown, E. D. (2006).Wall teichoic acid polymers are dispensable for cell viability in Bacillus subtilis.J Bacteriol188, 8313–8316.
Divakaruni, A. V., Loo, R. R., Xie, Y., Loo, J. A. & Gober, J. W. (2005). The cell-shape protein MreC interacts with extracytoplasmic proteins including cell wall assembly complexes inCaulobacter crescentus.Proc Natl Acad Sci U S A102, 18602–18607.
Divakaruni, A. V., Baida, C., White, C. L. & Gober, J. W. (2007).The cell shape proteins MreB and MreC control cell morphogenesis by positioning cell wall synthetic complexes.Mol Microbiol66, 174–188.
Dubrac, S., Bisicchia, P., Devine, K. M. & Msadek, T. (2008).A matter of life and death: cell wall homeostasis and the WalKR (YycGF) essential signal transduction pathway.Mol Microbiol70, 1307–1322. Eymann, C., Homuth, G., Scharf, C. & Hecker, M. (2002). Bacillus subtilisfunctional genomics: global characterization of the stringent response by proteome and transcriptome analysis. J Bacteriol 184, 2500–2520.
Formstone, A., Carballido-Lo´pez, R., Noirot, P., Errington, J. & Scheffers, D. J. (2008).Localization and interactions of teichoic acid synthetic enzymes inBacillus subtilis.J Bacteriol190, 1812–1821.
Fukuchi, K., Kasahara, Y., Asai, K., Kobayashi, K., Moriya, S. & Ogasawara, N. (2000). The essential two-component regulatory system encoded byyycFandyycGmodulates expression of theftsAZ operon inBacillus subtilis.Microbiology146, 1573–1583.
Fukushima, T., Afkham, A., Kurosawa, S., Tanabe, T., Yamamoto, H. & Sekiguchi, J. (2006).A newD,L-endopeptidase gene product, YojL (renamed CwlS), plays a role in cell separation with LytE and LytF in Bacillus subtilis.J Bacteriol188, 5541–5550.
Fukushima, T., Szurmant, H., Kim, E. J., Perego, M. & Hoch, J. A. (2008).A sensor histidine kinase co-ordinates cell wall architecture with cell division inBacillus subtilis.Mol Microbiol69, 621–632. Fukushima, T., Furihata, I., Emmins, R., Daniel, R. A., Hoch, J. A. & Szurmant, H. (2011).A role for the essential YycG sensor histidine kinase in sensing cell division.Mol Microbiol79, 503–522.
Gentleman, R. C., Carey, V. J., Bates, D. M., Bolstad, B., Dettling, M., Dudoit, S., Ellis, B., Gautier, L., Ge, Y. & other authors (2004). Bioconductor: open software development for computational biology and bioinformatics.Genome Biol5, R80.
Hochberg, Y. & Benjamini, Y. (1990).More powerful procedures for multiple significance testing.Stat Med9, 811–818.
Hokamp, K., Roche, F. M., Acab, M., Rousseau, M. E., Kuo, B., Goode, D., Aeschliman, D., Bryan, J., Babiuk, L. A. & other authors (2004).ArrayPipe: a flexible processing pipeline for microarray data. Nucleic Acids Res32(Web Server issue), W457–W459.
Howell, A., Dubrac, S., Andersen, K. K., Noone, D., Fert, J., Msadek, T. & Devine, K. M. (2003).Genes controlled by the essential YycG/ YycF two-component system of Bacillus subtilis revealed through a novel hybrid regulator approach.Mol Microbiol49, 1639–1655. Howell, A., Dubrac, S., Noone, D., Varughese, K. I. & Devine, K. M. (2006).Interactions between the YycFG and PhoPR two-component systems inBacillus subtilis: the PhoR kinase phosphorylates the non-cognate YycF response regulator upon phosphate limitation. Mol Microbiol59, 1199–1215.
Hulett, F. M. (2002). The PhoP regulon. In Bacillus subtilis and its closest relatives: from genes to cells, pp. 193–202. Edited by A. L. Sonenshein, J. A. Hoch & R. Losick. Washington, DC: American Society for Microbiology.
Hullo, M. F., Auger, S., Soutourina, O., Barzu, O., Yvon, M., Danchin, A. & Martin-Verstraete, I. (2007). Conversion of methionine to cysteine inBacillus subtilisand its regulation.J Bacteriol189, 187–197.
Jones, L. J., Carballido-Lo´pez, R. & Errington, J. (2001).Control of cell shape in bacteria: helical, actin-like filaments inBacillus subtilis. Cell104, 913–922.
Jules, M., Le Chat, L., Aymerich, S. & Le Coq, D. (2009).TheBacillus subtilis ywjI(glpX) gene encodes a class II fructose-1,6-bisphosphatase, functionally equivalent to the class III Fbp enzyme. J Bacteriol 191, 3168–3171.
Kawai, Y., Asai, K. & Errington, J. (2009a). Partial functional redundancy of MreB isoforms, MreB, Mbl and MreBH, in cell morphogenesis ofBacillus subtilis.Mol Microbiol73, 719–731.
Kawai, Y., Daniel, R. A. & Errington, J. (2009b).Regulation of cell wall morphogenesis inBacillus subtilisby recruitment of PBP1 to the MreB helix.Mol Microbiol71, 1131–1144.
Kent, W. J. (2002).BLAT– theBLAST-like alignment tool.Genome Res
12, 656–664.
Kock, H., Gerth, U. & Hecker, M. (2004).MurAA, catalysing the first committed step in peptidoglycan biosynthesis, is a target of Clp-dependent proteolysis inBacillus subtilis.Mol Microbiol51, 1087–1102.
Lahooti, M. & Harwood, C. R. (1999).Transcriptional analysis of the Bacillus subtilisteichuronic acid operon.Microbiology145, 3409–3417. Leaver, M. & Errington, J. (2005).Roles for MreC and MreD proteins in helical growth of the cylindrical cell wall inBacillus subtilis.Mol Microbiol57, 1196–1209.
Liu, W., Eder, S. & Hulett, F. M. (1998).Analysis ofBacillus subtilis tagABandtagDEFexpression during phosphate starvation identifies a repressor role for PhoP-P.J Bacteriol180, 753–758.
Mansilla, M. C., Albanesi, D. & de Mendoza, D. (2000). Transcriptional control of the sulfur-regulatedcysHoperon, contain-ing genes involved in L-cysteine biosynthesis in Bacillus subtilis.
J Bacteriol182, 5885–5892.
Mu¨ller, J. P., An, Z., Merad, T., Hancock, I. C. & Harwood, C. R. (1997). Influence of Bacillus subtilis phoR on cell wall anionic polymers. Microbiology143, 947–956.
Pra´gai, Z. & Harwood, C. R. (2002).Regulatory interactions between the Pho andsB-dependent general stress regulons ofBacillus subtilis. Microbiology148, 1593–1602.
Rasmussen, S., Nielsen, H. B. & Jarmer, H. (2009).The transcrip-tionally active regions in the genome ofBacillus subtilis.Mol Microbiol 73, 1043–1057.
Sambrook, J., Fritsch, E. F. & Maniatis, T. (1989).Molecular cloning: a laboratory manual. Cold Spring Harbor, NY: Cold Spring Harbor Laboratory.
Serizawa, M., Kodama, K., Yamamoto, H., Kobayashi, K., Ogasawara, N. & Sekiguchi, J. (2005). Functional analysis of the YvrGHb two-component system ofBacillus subtilis: identification of the regulated genes by DNA microarray and Northern blot analyses. Biosci Biotechnol Biochem69, 2155–2169.
Shi, L. & Hulett, F. M. (1999).The cytoplasmic kinase domain of PhoR is sufficient for the low phosphate-inducible expression of Pho regulon genes inBacillus subtilis.Mol Microbiol31, 211–222.
Smyth, G. K. (2004).Linear models and empirical Bayes methods for assessing differential expression in microarray experiments.Stat Appl Genet Mol Biol3, e3.
Soufo, H. J. & Graumann, P. L. (2010). Bacillus subtilis MreB paralogues have different filament architectures and lead to shape remodelling of a heterologous cell system.Mol Microbiol78, 1145– 1158.
Sun, G., Birkey, S. M. & Hulett, F. M. (1996).Three two-component signal-transduction systems interact for Pho regulation inBacillus subtilis. Mol Microbiol19, 941–948.
Swoboda, J. G., Campbell, J., Meredith, T. C. & Walker, S. (2010). Wall teichoic acid function, biosynthesis, and inhibition. ChemBioChem11, 35–45.
Vollmer, W., Blanot, D. & de Pedro, M. A. (2008). Peptidoglycan structure and architecture.FEMS Microbiol Rev32, 149–167.
Weidenmaier, C. & Peschel, A. (2008). Teichoic acids and related cell-wall glycopolymers in Gram-positive physiology and host interactions.Nat Rev Microbiol6, 276–287.
Yamamoto, H., Miyake, Y., Hisaoka, M., Kurosawa, S. & Sekiguchi, J. (2008).The major and minor wall teichoic acids prevent the sidewall localization of vegetativeDL-endopeptidase LytF in Bacillus subtilis.
Mol Microbiol70, 297–310.