RESEARCH ARTICLE
A FAST SCANNING STRIPPING SQUARE WAVE VOLTAMMETRY ANALYSIS OF
ERYTHROMYCIN A IN TILAPIA (
Oreochromis niloticus)
MERCURY ELECTRODE
Nguyen Phuoc Minh
Department of Food Technology, Ho Chi Minh City
Kiet Street, District 10, Ho Chi Minh City, Vietnam
ARTICLE INFO ABSTRACT
A new sensitive analytical approach for determination of erythromycin A in tilapia (Oreochromis niloticus)
wave voltammetry using the dropping mercury electrode (PSA developed and validated. Optimum parameters for erythromycin A quantification were: Ammonium acetate buffer 0.1 M, p
supporting electrolyte; acetonitrile as erythromycin standard; forward scanning; V mv; Vstep: 6 mV; V
Telectrolide: 5s. Peak of erythromycin
separated and distinguished with peaks of other antibiotics. This assay showed high recovery (> 85.07 %), high sensitivity (detection limit 0.52 µg/kg), high precision (RSD, 0.8
- RE, 85.07 88.56 %) as well as excellent linearity ( Simpler, reagent
assay method. An equivalence of analyzing results between PSA LC-MS/MS could be obviously seen.
INTRODUCTION
Tilapias are known to have been an important component of fisheries in the Mekong River Delta. The most significant diseases in Nile tilapia (Oreochromis niloticus) culture are caused by
Streptococcus iniae, Aeromonas hydrophila,
Trichodina sp., Flexibacter Columnaris,
Edwardsiella spp. Streptococcocus spp, gram
positive bacteria, have become a major problem for
*Corresponding author: [email protected]
tilapia farmers and there is still no effective commercial vaccine available that can be used to prevent
cause mass death in tilapia farms, and unlike many other tilapia diseases it will affect even large and otherwise healthy fish. The macrolide antibiotic erythromycin has long been the chemotherapeutant of choice to prevent and control
spp.
that exhibit high activity against nearly all Gram positive and Gram
ISSN:
0975-833X
Available online at http://www.journalcra.com
International Journal of Current Research Vol.11, pp.129-140, December
Key words:
Erythromycin A; Tilapia;
Stripping square wave voltammetry; Dropping mercury electrode.
Article History:
Received 18th September, 2010 Received in revised form 17th October, 2010
Accepted 15th November, 2010 Published online 16th December, 2010
ARTICLE
A FAST SCANNING STRIPPING SQUARE WAVE VOLTAMMETRY ANALYSIS OF
Oreochromis niloticus)
WITH THE DROPPING
MERCURY ELECTRODE
Nguyen Phuoc Minh
Department of Food Technology, Ho Chi Minh City University of Technology, 268 Ly Thuong
Kiet Street, District 10, Ho Chi Minh City, Vietnam
A new sensitive analytical approach for determination of erythromycin
Oreochromis niloticus) by a fast scanning stripping square
wave voltammetry using the dropping mercury electrode (PSA-F) was developed and validated. Optimum parameters for erythromycin A quantification were: Ammonium acetate buffer 0.1 M, pH 8.0 as supporting electrolyte; acetonitrile as the solvents for disolving erythromycin standard; forward scanning; Vstart: -400 mV; Vstop: -1700 : 6 mV; Vpulse: 40 mV; Tdop: 5000 ms; Velectrolide: -1100 mV; : 5s. Peak of erythromycin A appeared at E1/2 = -1430 mV, separated and distinguished with peaks of other antibiotics. This assay showed high recovery (> 85.07 %), high sensitivity (detection limit 0.52 µg/kg), high precision (RSD, 0.8 2.1 %), high accuracy (relative error
88.56 %) as well as excellent linearity (r2
adjusted = 1.0). Simpler, reagent-saving and time-saving were other advantages of this assay method. An equivalence of analyzing results between PSA-F and
MS/MS could be obviously seen.
tilapia farmers and there is still no effective commercial vaccine available that can be used to prevent Streptococcocus spp. in tilapia. They can cause mass death in tilapia farms, and unlike many other tilapia diseases it will affect even large and otherwise healthy fish. The macrolide antibiotic erythromycin has long been the chemotherapeutant of choice to prevent and control Streptococcocus spp. Erythromycins are broad spectrum antibiotics that exhibit high activity against nearly all Gram positive and Gram-negative bacteria. Erythromycin
Available online at http://www.journalcra.com
ternational Journal of Current Research , December, 2010
INTERNATIONAL JOURNAL OF CURRENT RESEARCH
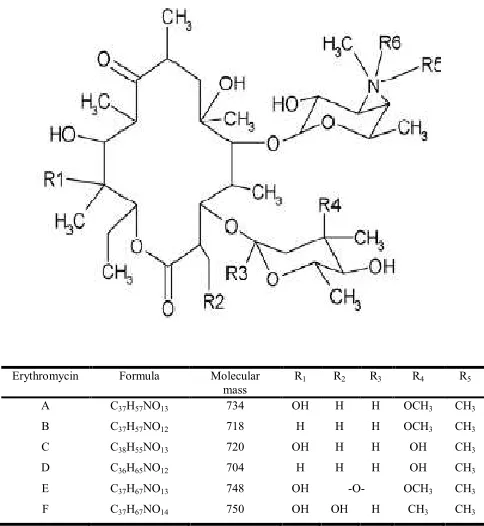
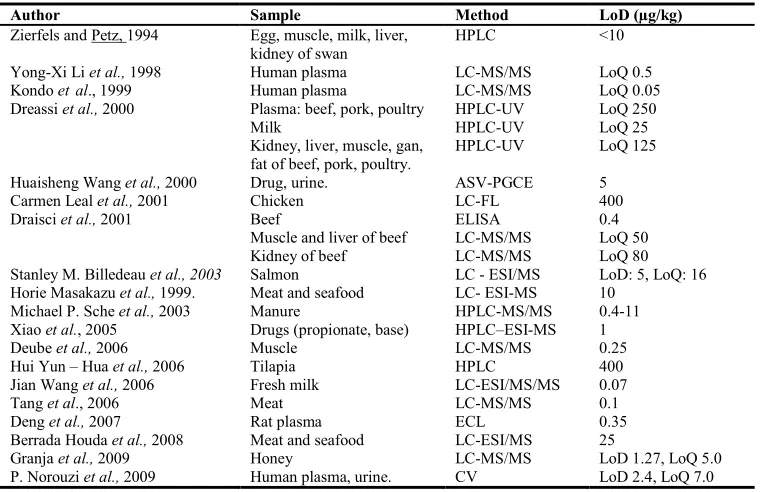
A consists of a polyhydroxylactone and two sugars. The aglycone part of all erythromycin molecules, the erythronolide, is a 14-membered lactone ring (Fig. 1). Depending on the type of erythromycin this lactone ring is substituted via 4-position with a cladinose in case of erythromycin A, erythromycin B, erythromycin E, erythromycin F and with a mycarose in case of erythromycin C and erythromycin D. All erythromycin molecules contain the aminosugar d-desosamine, which is -glycosidic linked to the 6 position of the lactone ring. The minimum inhibited concentration of erythromycins A, B, C, and D and some of their derivatives were determined against 21 gram-positive and 15 gram-negative microorganisms. Antibacterial activity was confined to gram-positive and very few gram-negative bacteria. Erythromycin B was somewhat less active than erythromycin A, and erythromycin C and D showed about half that activity or even less (Isaac Ongubo Kibwage et al., 1985). Owing to their extensive use in infectious disease therapy, several procedures have been reported for its determination (Table 1). The aim of this work was to determine the feasibility of square wave voltammetry for the direct detection and quantification of erythromycin A in tilapia tissue.
MATERIALS AND METHODS
Reagents and materials
All chemicals and reagents were HPLC grade or p.a. Double-distilled water (DDW) was used throughout the study. The high purity antibiotic standards (>99%) of erythromycin A, erythromycin A, chloramphenicol, furazolidone, florfenicol, ciprofloxacin, colistin, malachite green were purchased from Vietnam Central Institute of Pharmacy.
Apparatus: A fast scanning stripping square wave voltammetry at the slowly dropping mercury electrode was performed in the ANALYZER SQF-505. The mercury dropping electrode was used as a working electrode, silver/silver chloride (saturated KCl) as a reference electrode and a platinum wire as an auxiliary one.
Sample extraction and clean-up procedure
Primary extraction: A 5 g aliquot of a blank or spiked minced tissue sample was mixed with a small volume of erythromycin standard. After a 15-min equilibration period, the tissues were mixed vigorously for 15 min with 25 ml Tris buffer (0.1M; pH 10.5). After a 10-min centrifugation at 3000 g and 4 °C, the supernatant was transferred to a polypropylene tube and the solid residue extracted a second time with 25 ml Tris buffer. Acetic acid (600 µl) and 5 ml sodium tungstate buffer (0.15M) were added to precipitate the proteins. After equilibration for one hour at 4 °C, the samples were centrifuged at 3000 g for 10 min. The supernatants were further filtered through a plug of glass wool.
Solid phase extraction: The 6-cm3 HLB OASIS
extraction cartridges (200 mg) were prepared and conditioned with 10 ml methanol and 10 ml water. The biological samples were placed at the top of the column. Two wash solution volumes were applied before erythromycin elution: 20 ml methanol-water (5:95, v/v) and 5 ml hexane. After the last washing step, the OASIS columns were vacuum-dried for 10 min. Erythromycin was finally eluted with 5 ml methanol-ammonia 30 % (95:5, v/v) and evaporated dry under a nitrogen flow. The extracts were dissolved in 500 µl NH4AC-ACN (80/20 v/v), transferred to Eppendorf tubes and centrifuged at 3000 g for 10 min. Aliquots of the supernatant were transferred into the voltammetric cell with 2,500 mL of ammonium acetate 0.1 M, pH 8.0 before being quantified by Analyzer SQF-505 machine in mode stripping square wave voltammetry.
RESULTS AND DISCUSSION
Voltammetric behavior of erythromycin at the
slowly dropping electrode
Effect of Supporting Electrolytes and pH values.
examined. Ammonium acetate buffer was recommended to complete these studies where erythromycin showed the highest peak current and the best peak shape (Table 2 and Fig. 2). The effect of pH of ammonium acetate buffer on the peak current was examined from 7.0 to 10.0. Erythromycin showed highest peak current at pH 8.0 (E1/2 = -1438 mV, I = 351.7 ± 5.7 nA). Hence ammonium acetate buffer (pH 8.0) was selected for further investigations.
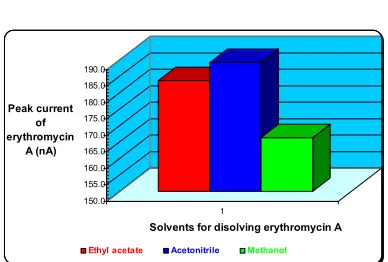
The effect of the ionic strength of supporting electrolyte was examined at pH 8.0 over the range from 0.050.25 M. Erythromycin showed highest peak current at ammonium acetate 0.1M (E1/2 = -1438 mV, I = 254.8 ± 10.2 nA). So this value was selected for further studies (Table 3 and Figure 3). Effect of the solvents for disolving erythromycin A standard on the peak current were examined. Among methanol, acetonitril, ethyl acetate, the peak current increased with a maximum at acetonitril (E1/2 = -1438 mV, I = 189.2 ± 3.5 nA).
So acetonitril was selected for subsequent work (Table 4 and Figure 4).
Optimization of measurement conditions
Effect of forward scanning (0 to -1800 mV) and reverse scanning (-1800mV to 0) on the peak current signal was examined. The forward scanning (0 to -1800 mV) showed high peak. Meanwhile,
the peak current of the reverse scanning (-1800mV to 0) was too low. So the forward
scanning (0 to –1800 mV) was chosen for further investigations. Effect of Vstart. Mode PSA-F, forward scanning, Vstop: -1800 mV, Vstep:4 mV, Vpulse: 30mV, Tdrop: 3000ms, Velectrolise:-700mV, Telectrolise: 6s, Tstabilize: 1s. Examining Vstart from - 400mV to -1100mV. Vstart was optimum at -400mV (E1/2 = -1430 mV, I = 106.5 ± 4.7 nA; Table 5 and Fig. 5). Effect of Vstop. Mode PSA-F, forward scanning, Vstart: -400 mV, Vstep: 4 mV, Vpulse:30 mV, Tdrop: 3000 ms, Velectrolise: -700 mV, Telectrolise: 6 s, Tstabilize: 1 s. Examining Vstop from 1700 mV to -Erythromycin Formula Molecular
mass
R1 R2 R3 R4 R5
A C37H57NO13 734 OH H H OCH3 CH3
B C37H57NO12 718 H H H OCH3 CH3
C C38H55NO13 720 OH H H OH CH3
D C36H65NO12 704 H H H OH CH3
E C37H67NO13 748 OH -O- OCH3 CH3
[image:3.504.137.379.181.444.2]F C37H67NO14 750 OH OH H CH3 CH3
Figure 1. Structural formula of erythromycin A and related substances
Nguyen Phuoc Minh, A fast scanning stripping square wave voltammetry analysis of erythromycin a in tilapia
2000 mV. Vstart was optimum at 1700 mV (E1/2 = -1430 mV, I = 136.7 ± 3.9 nA) (Table 6 and Fig. 6).
Effect of Vstep. Mode PSA-F, forward scanning, Vstart: -400 mV, Vstop: -1700 mV, Vpulse: 30 mV, Tdrop: 3000 ms, Velectrolise: -700 mV, Telectrolise: 6 s, Tstabilize: 1 s. Examining Vstep from 4 mV to 10 mV. Vstep was optimum at 6.0 mV (E1/2 = -1430 mV, I = 214.6 ± 13.1 nA) (Table 7 and Fig. 7). Effect of Vpulse. Mode PSA-F, forward scanning, Vstart: -400
mV, Vstop: -1700 mV, Vstep: 6.0 mV, Tdrop: 3000 ms, Velectrolise: -700 mV, Telectrolise: 6 s, Tstabilize: 1 s. Examining Vpulse from 10 mV to 40mV. Vpulse was
[image:4.504.62.442.115.361.2]optimum at 40 mV (E1/2 = -1430 mV, I = 692.6 ± 14.9 nA) (Table 8 and Fig. 8). Effect of Tdrop Mode PSAF, forward scanning, Vstart: 400 mV, Vstop: 1700 mV, Vstep: 6 mV, Vpulse: 40 mV, Velectrolise: -700 mV, Telectrolise: 6 s, Tstabilize: 1 s. Examining Tdrop from 1000 ms to 5,000 ms. Tdrop was optimum at 5,000 ms (E1/2 = -1430 mV, I = 381.3 ± 2.9 nA)
Table 1. Some typical papers published in recently
Author Sample Method LoD (µg/kg)
Zierfels and Petz, 1994 Egg, muscle, milk, liver,
kidney of swan
HPLC <10
Yong-Xi Li et al., 1998 Human plasma LC-MS/MS LoQ 0.5
Kondo etal., 1999 Human plasma LC-MS/MS LoQ 0.05
Dreassi et al., 2000 Plasma: beef, pork, poultry HPLC-UV LoQ 250
Milk HPLC-UV LoQ 25
Kidney, liver, muscle, gan, fat of beef, pork, poultry.
HPLC-UV LoQ 125
Huaisheng Wang et al., 2000 Drug, urine. ASV-PGCE 5
Carmen Leal et al., 2001 Chicken LC-FL 400
Draisci et al., 2001 Beef ELISA 0.4
Muscle and liver of beef LC-MS/MS LoQ 50
Kidney of beef LC-MS/MS LoQ 80
Stanley M. Billedeau et al., 2003 Salmon LC - ESI/MS LoD: 5, LoQ: 16
Horie Masakazu et al., 1999. Meat and seafood LC- ESI-MS 10
Michael P. Sche et al., 2003 Manure HPLC-MS/MS 0.4-11
Xiao et al., 2005 Drugs (propionate, base) HPLC–ESI-MS 1
Deube et al., 2006 Muscle LC-MS/MS 0.25
Hui Yun – Hua et al., 2006 Tilapia HPLC 400
Jian Wang et al., 2006 Fresh milk LC-ESI/MS/MS 0.07
Tang etal., 2006 Meat LC-MS/MS 0.1
Deng et al., 2007 Rat plasma ECL 0.35
Berrada Houda et al., 2008 Meat and seafood LC-ESI/MS 25
Granja et al., 2009 Honey LC-MS/MS LoD 1.27, LoQ 5.0
P. Norouzi et al., 2009 Human plasma, urine. CV LoD 2.4, LoQ 7.0
Table 2. Peak current of erythromycin A was affected by supporting electrolytes, pH values
pH 5.0 6.0 7.0 8.0 9.0 10.0
Supporting electrolytes
Mean ± SD
RSD (%)
Mean ± SD
RSD (%)
Mean ± SD
RSD (%)
Mean ± SD
RSD (%)
Mean ± SD
RSD (%)
Mean ± SD
RSD (%) Natri
acetate
56.67b
± 1.1 1.9
35.5a ±
2.3 6.6
255.5d
± 7.3 2.8
333.4e
± 4.7 1.4
236.2c
± 7.7 3.3
254d
± 4.7 1.9
Ammonium acetate
210.3a
± 5.4 2.6
351.7d
± 5.7 1.6
216.5b
± 2.7 1.2
263.1c
± 1.6 0.6
Citrat-phosphate
207.7d
± 6.0 2.9
168.2a
± 2.3 1.4
194.4b
± 2.6 1.4
229.4e
± 2.1 0.9
200.9c
± 2.0 1.0
Tris
180.0d
±13.1 7.3
27.5a ±
0.3 1.1
53.4b
± 3.6 6.7
126.4c
± 9.7 7.7
Borax
168.1a
± 1.6 0.9
255.5c
± 6.5 2.6
173.9b
± 1.8 1.0
* Each value was the mean of 5 samples (n = 5)
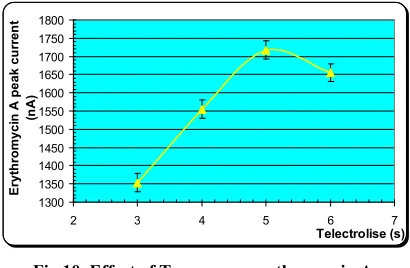
[image:4.504.48.460.392.521.2](Table 9 and Fig. 9). Effect of Telectrolise Mode PSA-F, forward scanning, Vstart: -400 mV, Vstop: -1700 mV, Vstep: 6 mV, Vpulse: 40 mV, Tdrop: 5,000 ms, Velectrolise: -700 mV, Tstabilize: 1s. Examining Telectrolise from 3s to 6s. Telectrolise was optimum at 5s (E1/2 = -1430 mV, I = 1717.0 ±13.7 nA) (Table 10 and Fig. 10). Effect of Velectrolise Mode PSA-F, forward scanning, Vstart: -400 mV, Vstop: -1700 mV, Vstep:6mV, Vpulse: 40 mV, Tdrop: 5,000 ms, Telectrolise: 5 s, Tstabilize: 1 s. Examining Velectrolise from -400 mV to -1400 mV. Velectrolise was optimum at -1100 mV (E1/2 = -1438 mV, I = 1863.2 ± 24.1 nA) (Table 11 and Fig. 11).
Calibration
Calibration curves and detection Limit: A 25mL
supporting electrolyte ammonium acetate 0.1M, pH
8.0 was transferred to the cell and spiked with 5L, 10L, 20L, 30L, 40L, 50L, 60L, 7L, 80L, 90L of stock 250ppm solution
of erythromycin in pure acetonitril. The concentrations of erythromycin in the cell
were 50 µg/kg, 100µg/kg, 200µg/kg, 300µg/kg,
400µg/kg, 500µg/kg, 600µg/kg, 700µg/kg,
[image:5.504.263.455.83.227.2]800µg/kg, 90µg/kg respectively. Mode PSA-F, Vstart: -400mV, Vstop: -1700 mV, Vstep: 6 mV, Vpulse: 40 mV, Tdrop: 5000 ms, Telectrolise: 5s, Velectrolise: - 1100 mV, Tstabilize: 1s. A detection limit of 0.57 µg/kg was obtained for erythromycin. A linear behavior was also observed with a correlation coefficient r2adjust = 1.0 (Fig. 12).
Figure 2. Effect of supporting electrolytes, pH values on peak current of erythromycin A
Interference
[image:5.504.262.456.351.482.2]Effect of Interferences. The effect of co-existing ions was examined by introducing different
Figure 3. Effect of ionic strength of ammonium acetate on peak current of erythromycin A
Table 4. Peak current of erythromycin A was affected by solvents
Ethyl acetate Acetonitril Methanol
Mean ± SD
RSD (%)
Mean ± SD
RSD (%)
Mean ± SD
RSD (%) 183.6b
± 1.5 0.8
189.2c
± 3.5 1.9
166.3a
± 5.5 3.3
[image:5.504.43.239.432.584.2]* Each value was the mean of 5 samples (n = 5)
Fig. 4. Effect of solvents for disolving erythromycin A on peak current
0.0 50.0 100.0 150.0 200.0 250.0 300.0 350.0 400.0
4.5 5.0 5.5 6.0 6.5 7.0 7.5 8.0 8.5 9.0 9.5 10.0 10.5
pH
Pe
a
k
cu
rr
e
nt
o
f
e
ryt
hrom
y
c
in
A
(nA
)
Sodium acetate Ammonium acetate Citrate-phosphate Tris Borax
150.0 170.0 190.0 210.0 230.0 250.0 270.0
0.00 0.05 0.10 0.15 0.20 0.25 0.30
Ionic strength of ammonium acetate (M)
P
ea
k
cu
rren
t
o
f
eryt
h
ro
myci
n
A
(n
A
)
150.0 155.0 160.0 165.0 170.0 175.0 180.0 185.0 190.0
Peak current of erythromycin
A (nA)
1
Solvents for disolving erythromycin A
Ethyl acetate Acetonitrile Methanol
Nguyen Phuoc Minh, A fast scanning stripping square wave voltammetry analysis of erythromycin a in tilapia
Fig. 5. Effect of Vstart on erythromycin A peak current
concentrations of some ions to the voltametric cell and recording the corresponding voltammogram using the conditions selected above. It was observed that the additions of 05ppm K+, Na+, Ca2+, Mg2+, Fe3+, Cl-, SO42-, HPO42- ions have no effect (< 5%) on the peak response.
0.0 20.0 40.0 60.0 80.0 100.0 120.0
-1200 -1000 -800 -600 -400 -200
Vstart (mV)
P
ea
k
cu
rr
en
t
of
eryt
hr
o
m
yci
n
A
(nA
[image:6.504.42.471.230.262.2])
Table 5. Peak current of erythromycin A was affected by Vstart
Vstart(mV) -400 -500 -600 -700 -800 -900 -1000 -1100
Mean ± SD 106.5g ± 4.7 97f ± 3.4 79.5e ± 0.8 71.5d ± 4.3 93.3f ± 4.0 45.0c ± 2.6 23.4b ± 1.0 14.8a ± 0.9
RSD (%) 4.4 3.5 1.0 6.0 4.3 5.8 4.3 6.2
* Each value was the mean of 5 samples (n = 5)
Table 6. Peak current of erythromycin A was affected by Vstop
Vstop (mV) -1500.0 -1600.0 -1700.0 -1800.0
Mean ± SD 104a ± 1.0 118.2b ± 1.4 136.7c ± 3.9 120.1b ± 1.1
RSD (%) 0.9 1.2 2.9 0.9
* Each value was the mean of 5 samples (n = 5)
Table 7. Peak current of erythromycin A was affected by Vstep
Vstep (mV) 4.0 6.0 8.0 10.0
Mean ± SD 162.8a ± 5.8 214.6c ± 13.1 176.9b ± 8.3 165.0ab ± 10.9
RSD (%) 3.5 6.1 4.7 6.6
* Each value was the mean of 5 samples (n = 5)
Table 8. Peak current of erythromycin A was affected by Vpulse
Vpulse (mV) 10 20 30 40
Mean ± SD 230.6a ± 2.7 388.4b ± 12.7 528.0c ± 8.0 692.6d ± 14.9
RSD (%) 1.2 3.3 1.5 2.2
* Each value was the mean of 5 samples (n = 5)
Table 9. Peak current of erythromycin A was affected by Tdrop
Tdrop (ms) 1,000 2,000 3,000 4,000 5,000
Mean ± SD 128.3a ± 1.2 197.9b ±1.9 269.1c ± 12.9 323.2d ±3..3 381.3e ± 2.9
RSD (%) 0.9 1.0 4.8 1.0 0.8
[image:6.504.102.403.562.594.2]* Each value was the mean of 5 samples (n = 5)
Table 10. Peak current of erythromycin A was affected by Telectrolise
Telectrolise (s) 3 4 5 6
Mean ± SD 1353.6a± 10.8 1555.4b ±13.0 1717.0d ±13.7 1655.4c ±5.0
RSD (%) 0.8 0.8 0.8 0.3
* Each value was the mean of 5 samples (n = 5)
Table 11. Peak current of erythromycin A was affected by Velectrolise
Velectrolise (Mv) -400.0 -900.0 -1100.0 -1400.0
Mean ± SD 1709.0b± 17.3 1815.0c ±3.7 1863.2c ± 24.1 1593.4a ±13.5
RSD (%) 1.0 0.2 1.3 0.8
* Each value was the mean of 5 samples (n = 5)
Sample analysis
In tilapia samples: Recovery rate: 85.07 88.56%,
MDL: 0.52 µg.kg-1,R_adjust: 1.0, RSD: 0.80
[image:7.504.38.242.191.321.2]2.10 %. (Fig. 13). Comparison results between SWV and LC-MS/MS method
Fig. 6. Effect of Vstop on erythromycin A peak current
[image:7.504.39.243.360.485.2]Fig. 7. Effect of Vstep on erythromycin A peak current
Fig. 8. Effect of Vpulse on erythromycin A
peak current
Incurred tilapia samples were obtained through medication at 100 mg erythromycin·kg-1 fish body weight-1·d-1 for 7 days; sampled at 7, 8 and 9 days post-dosing. These incurred samples (high, medium, and low) were divided in two groups: samples in group A were analyzed by Square Wave Voltammetry, samples in group B were controlled by LC-MS/MS via Intertek Vietnam Ltd. A closely
Fig. 9. Effect of Tdrop on erythromycin A peak current
Fig.10. Effect of Telectrolise on erythromycin A
peak current
100.0 105.0 110.0 115.0 120.0 125.0 130.0 135.0 140.0 145.0
-1850.0 -1800.0 -1750.0 -1700.0 -1650.0 -1600.0 -1550.0 -1500.0 -1450.0
Vstop (mV)
E
ryt
h
romyc
in A
p
ea
k
cu
rr
en
t
(nA
)
150.0 160.0 170.0 180.0 190.0 200.0 210.0 220.0 230.0
2.0 4.0 6.0 8.0 10.0 12.0
Vstep (mV)
E
ryt
h
romyci
n
A
p
eak
cu
rr
en
t
(nA
)
100.0 200.0 300.0 400.0 500.0 600.0 700.0 800.0
5.0 10.0 15.0 20.0 25.0 30.0 35.0 40.0 45.0
Vpulse (mV)
Eryt
hromyci
n
A
p
ea
k
cu
rr
en
t
(n
A
)
100.0 150.0 200.0 250.0 300.0 350.0 400.0 450.0
0.0 1000.0 2000.0 3000.0 4000.0 5000.0 6000.0
Tdrop (nA)
E
ryt
h
romyc
in
A
p
ea
k
cu
rre
nt
(n
A
)
1300 1350 1400 1450 1500 1550 1600 1650 1700 1750 1800
2 3 4 5 6 7
Telectrolise (s)
Eryt
hromyc
in
A
pe
ak
cu
rr
en
t
(n
A
)
Nguyen Phuoc Minh, A fast scanning stripping square wave voltammetry analysis of erythromycin a in tilapia
[image:7.504.263.468.470.604.2]Fig.11. Effect of Velectrolise on erythromycin A
peak current
homogeneity could be obviously seen in
comparison between two analyzing methods. SWV seems to be superior and more accurate to LC-MS/MS (Table 12)
Validation of quantification method
Linearity: The linearity was evaluated by linear regression analysis, which was calculated by the
least square regression method. The calibration curves constructed for erythromycin were linear over the concentration range of 50 400 µg/kg. Peak areas of erythromycin were plotted versus its concentration and linear regression analysis performed on the resultant curve. A correlation coefficient of R2adjust = 1.0 with %R.S.D. values ranging from 0.4 3.7 % across the concentration
1500 1550 1600 1650 1700 1750 1800 1850 1900
-1600 -1400 -1200 -1000 -800 -600 -400 -200 0
Velectrolise (mV)
E
ryt
h
rom
yc
in
A
pe
ak
cu
rr
en
t
(nA
)
Fig.12. Calibration curve of erythromycin A
range studied were obtained following linear regression analysis (Table 13). Typically, the regression equation for the calibration curve was found to be Y=1.08*X + 87.
LOD
The LOD was the lowest amount of measured analyte that may be detected to produce a response
which is significantly different from that of a blank. Limit of detection was approved by calculations based on the standard deviation of the response (δ) (here the current) which is obtained from blank with 5 replicas and (S) is the slope of the calibration curve according to equation LOD=3.3(δ/S). The LOD for erythromycin was 0.57 µg/kg (Figure 13).
Precision, Accuracy & Recovery
[image:9.504.63.477.331.478.2]Precision was investigated by the intra- and inter-day (n = 6) assays at three different concentrations with respect to both repeatability and
Table 12. Comparison homogeneity of two analyzing methods
Sample I.D SWV (LOD = 0.52 µg*kg-1) LC-MS/MS (LOD = 10 µg*kg-1)
Result (mg*kg-1)
Mean ± SD (mg*kg-1)
R.S.D (%)
Result (mg*kg-1)
Mean ± SD (mg*kg-1)
R.S.D (%)
TL – Blank N.D N.A N.A N.D N.A N.A
TL – Blank N.D N.D
TL – Blank N.D N.D
TL – I 1.31 1.29a ± 0.02 1.61 1.23 1.26a ± 0.03 2.10
TL – I 1.27 1.28
TL – I 1.30 1.27
TL – II 1.95 2.02b ± 0.07 3.47 3.14 2.72b ± 0.43 15.64
TL – II 2.09 2.72
TL – II 2.02 2.29
TL – III 2.80 2.78c ± 0.03 1.25 2.80 2.80b ± 0.01 0.21
TL – III 2.80 2.80
TL – III 2.74 2.81
[image:9.504.124.413.505.555.2]*LOD: Limit of detection; **N.D: Not detected
Table 13. Linear range in regression analysis of erythromycin
Erythromycin A
concentration (ppb) 50.0 100.0 200.0 300.0 400.0
Peak current (Mean ± SD)
138.5a ± 5.1
194.0b ± 3.9
305.2c ± 5.2
411.2d ± 1.8
524.8e ± 14.3
RSD (%) 3.7 2.0 1.6 0.4 2.7
* Each value was the mean of 5 samples
Table 14. Precision (RSD %), accuracy (RE %) and recovery of erythromycin A in tilapia muscles
Day Spike level
(µg*kg-1)
Measured concentration (mean ± SD, µg*kg-1)
RSD (%)
RE (%)
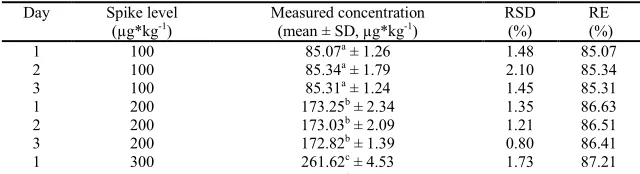
1 100 85.07a ± 1.26 1.48 85.07
2 100 85.34a ± 1.79 2.10 85.34
3 100 85.31a ± 1.24 1.45 85.31
1 200 173.25b ± 2.34 1.35 86.63
2 200 173.03b ± 2.09 1.21 86.51
3 200 172.82b ± 1.39 0.80 86.41
1 300 261.62c ± 4.53 1.73 87.21
2 300 262.57c ± 3.42 1.30 87.52
Nguyen Phuoc Minh, A fast scanning stripping square wave voltammetry analysis of erythromycin a in tilapia
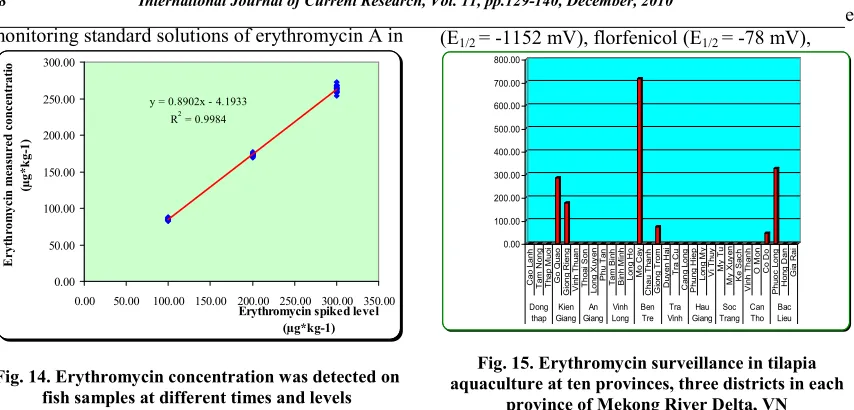
[image:9.504.109.429.593.680.2]reproducibility. Repeatability was investigated by injecting six replicate samples of each of the 100, 200, 300 µg/kg standards. Inter-day precision was assessed by injecting the same three concentrations over 3 consecutive days. Accuracy (relative error, RE, %) was calculated by assessing the agreement between measured and nominal concentrations of the fortified samples. Recovery was assessed at erythromycin A, concentrations of 100, 200, 300 µg/kg and the mean value was calculated (Table 14 and Figure 14).
Differentiation
The differentiation of the method was checked by monitoring standard solutions of erythromycin A in
Fig. 14. Erythromycin concentration was detected on fish samples at different times and levels
the presence of other antibiotic components. The peak response (E1/2) of erythromycin A (E1/2 = -1430 mV) was separated, independent and
distinguished from ones obtained in
[image:10.504.41.468.294.499.2]chloramphenicol (E1/2 = -196 mV), furazolidone (E1/2 = -1152 mV), florfenicol (E1/2 = -78 mV),
Fig. 15. Erythromycin surveillance in tilapia aquaculture at ten provinces, three districts in each
province of Mekong River Delta, VN
y = 0.8902x - 4.1933
R2 = 0.9984
0.00 50.00 100.00 150.00 200.00 250.00 300.00
0.00 50.00 100.00 150.00 200.00 250.00 300.00 350.00
[image:10.504.84.420.537.680.2]Erythromycin spiked level (µg*kg-1) E ryt h rom yci n m eas ured concent rat ion (µ g*k g-1) 0.00 100.00 200.00 300.00 400.00 500.00 600.00 700.00 800.00 Ca o L an h Ta m N o ng Th ap M uo i G o Qu ao G io ng Ri e ng V in h Th u an Th o a i S o n L on g X u y e n Ph u Ta n T am Bin h Bi nh M in h Lo ng H o M o C a y C h au Th an h G io ng Tr om D u y e n H a i Tra Cu C a ng L on g P h un g H iep Lo ng M y Vi Th u y M y Tu M y Xu y e n Ke Sa c h V in h Th a nh O M o n Co D o Ph u oc L on g Ho n g D an G ia R ai Dong thap Kien Giang An Giang Vinh Long Ben Tre Tra Vinh Hau Giang Soc Trang Can Tho Bac Lieu
Table 15. Erythromycin residue of tilapia samples from ten provinces, three districts in each province in the Mekong River Delta
No Province District Tilapia
M1 M2 M3 M4 M5 Mean
(µg*kg-1)
RSD (%)
1
Dong Thap Cao Lanh N.D N.D N.D N.D N.D N.D N.D Tam Nong N.D N.D N.D N.D N.D N.D N.D Thap Muoi N.D N.D N.D N.D N.D N.D N.D 2
Kien Giang Go Quao 289.4 287.5 290.3 279.9 280.8 285.6d 1.71
Giong Rieng 175.2 177.9 176.3 175.9 177.8 176.6c 0.67
Vinh Thuan N.D N.D N.D N.D N.D N.D N.D 3
An Giang Thoai Son N.D N.D N.D N.D N.D N.D N.D Long Xuyen N.D N.D N.D N.D N.D N.D N.D Phu Tan N.D N.D N.D N.D N.D N.D N.D 4
Vinh Long Tam Binh N.D N.D N.D N.D N.D N.D N.D Binh Minh N.D N.D N.D N.D N.D N.D N.D Long Ho N.D N.D N.D N.D N.D N.D N.D 5
Ben Tre Mo Cay 713.0 719.2 720.0 715.8 716.9 716.9f 0.39
Chau Thanh N.D N.D N.D N.D N.D N.D N.D Giong Trom 72.5 73.1 72.8 74.0 72.7 73.0b 0.81
enrofloxacin, ciprofloxacin (E1/2 = -1336 mV), colistin (E1/2 = 1120 mV) malachite green (E1/2 =
-1228 mV). Hence, the determination of
erythromycin by SWV was considered having not only “screening” but also “confirming” abilities.
Application
Tilapia samples from ten provinces in the Mekong River Delta were taken and analyzed to survey the erythromycin residue. Residual results could be obviously seen in the Table 15 and Figure 15.
Conclusion
A new analytical procedure based Square Wave
Voltammetry had been developed for
determination of erythromycin in tilapia. The proposed method was simple, quick, economical, and sensitive. It should be extensively used for veterinary drug residue screening in food surveillance programs.
Acknowledgements
This work was supported by Dr Tran Bich Lam – HCM University of Technology, Dr Nguyen Trong Giao – Viet Nam_Russia Tropical Center, South Branch, Viet Nam
REFERENCES
Carmen Leal, Rosa Codony, Ramon Compañó, Mercè Granados and M. Dolors Prat, 2001. Determination of macrolide antibiotics by
liquid chromatography. Journal of
Chromatography A, 910: 285-290.
Deng B, Kang Y, Li X and Xu Q. 2007.
Determination of Erythromycin in rat
plasma with capillary electrophoresis-electro chemiluminescence detection of tris (2,
2'-bipyridyl) ruthenium (II). Journal of
chromatography B, 857: 136-141.
Deubel A, Fandiño AS, Sörgel F and Holzgrabe U. 2006. Determination of Erythromycin and related substances in commercial samples using
liquid chromatography/ion trap mass
spectrometry. Journal of Chromatography A, 1136: 39-47.
Draisci R, Delli Quadri F, Achene L, Volpe G, Palleschi L and Palleschi G. 2001. A new electrochemical enzyme-linked immunosorbent assay for the screening of macrolide antibiotic residues in bovine meat. Analyst, 126, 1942– 1946.
Dreassi E, Corti P, Bezzini F and
Furlanetto S. 2000. High-performance liquid chromatographic assay of erythromycin from biological matrix using electrochemical or ultraviolet detection. Analyst., 125: 1077-1081. Granja R, Niño AM, Zucchetti R, Niño RM, Patel
R and Salerno AG
.
2009. Determination of erythromycin and tylosin residues in honey byLC-MS/MS. J AOAC Int., 92: 975-980.
Horie Masakazu, Ishii Rie, Yoshida Terumitsu, Hoshino Yoji and Nakazawa Hiroyuki, 1999.
Determination of erythromycin and
oleandomycin in meat and fish by LC/MS.
Journal of the Food Hygienic Society of Japan,
40: 309-313.
Houda Berrada, Francesc Borrull, Guillermina Font and Rosa Maria Marcé, 2008. Determination of macrolide antibiotics in meat and fish using
pressurized liquid extraction and liquid
chromatography–mass spectrometry. Journal of
Chromatography A, 1208: 83-89.
Huaisheng Wang, Aimei Zhang, Hui Cui, Daojie Liu and Renmin Liu, 2000. Adsorptive
stripping voltammetric determination of
erythromycin at a pretreated glassy carbon electrode. Microchemical Journal, 64: 67-71.
Nguyen Phuoc Minh, A fast scanning stripping square wave voltammetry analysis of erythromycin a in tilapia
Hui Yun-Hua,Yu Hui-juan,Cai You—Xiong
and Zhou Pei—Ge 2006. Residual
determination of erythromycin in tilapia by high
performance liquid chromatography. Marine
Fisheries, 28: 321-325.
Isaac Ongubo Kibwage,Jos Hoogmartens, Eugene Roets, Hubert Vanderhaeghe, Ludo Verbist, Maurice Dubost,V Claude Pascal, Pierre
Petitjean, and Georgette Levol, 1985.
Antibacterial activities of erythromycins A, B, C, and D and some of their derivatives.
Antimicrobial Agents and Chemotherapy, 28:
630-633.
Jian Wang, Daniel Leung and Steven P. Lenz 2006. Determination of five macrolide antibiotic
residues in raw milk using liquid
chromatography−electrospray ionization
tandem mass spectrometry. Journal of
Agriculture and Food Chemistry, 54: 2873–
2880.
Kondo T, Dote N, Hagimoto T, Yoshimura Y. 1999. Application of liquid chromatography-turbo ion spray tandem mass spectrometry for quantitative analysis of a potent motilin receptor agonist, EM574, and its metabolites in
human plasma. J Chromatogr B Biomed Sci
Appl., 29 (734): 101-112.
Masakazu Horie, Harumi Takegami, Kazuo Toya and Hiroyuki Nakazawa. 2003. Determination of macrolide antibiotics in meat and fish by
liquid chromatography–electrospray mass
spectrometry. Analytica Chimica Acta, 492:
187–197.
Michael P. Schlüsener, Kai Bester and
Michael Spiteller, 2003. Determination of antibiotics such as macrolides, ionophores and tiamulin in liquid manure by HPLC-MS/MS. Analytical and Bioanalytical Chemistry, 375: 942–947.
Nagla. F. Galal, Safinaz G.M. Ismail, R.H.Khalil
and M.K. Soliman, 2005. Studies on
Edwardsiella infection in Oreochromis
niloticus. Egyptian Journal of Aquatic
Research, 31: 460 – 471.
Norouzi, P., Daneshgar, P. and Ganjali, M.R. 2009. Electrochemical evaluation of non-electroactive drug Erythromycin in trace amount at biological samples by continuous
cyclic voltammetry. Materials Science and
Engineering: C, 29: 1281-1287.
Stanley M. Billedeau, Thomas M. Heinze and Paul H. Siitonen, 2003. Liquid chromatography analysis of erythromycin A in salmon tissue by
electrochemical detection with confirmation by electrospray ionization mass spectrometry.
Journal of Agriculture and Food Chemistry, 51:
1534–1538.
Tang HP, Ho C and Lai SS. (2006). High-throughput screening for multi-class veterinary drug residues in animal muscle using liquid
chromatography/tandem mass spectrometry
with on-line solid-phase extraction. Rapid
Communications in Mass Spectrometry, 20:
2565 – 2572.
Xiao W, Chen B, Yao S and Cheng Z. 2005. Simultaneous determination of Erythromycin propionate and base in human plasma by
high-performance liquid chromatography–
electrospray mass spectrometry. Journal of
Chromatography B, 817: 153–158.
Yong-Xi Li, Kathy Neufeld, Jim Chastain, Alletta Curtis and Poonam Velagaleti, 1998. Sensitive determination of erythromycin in human
plasma by LC-MS/MS. Journal of
Pharmaceutical and Biomedical Analysis, 16: 961-970.
Zierfels G and Petz M. 1994. Fluorimetric determination of Erythromycin residues in
*******
foods of animal origin after derivatization with
FMOC and HPLC separation. Z Lebensm