Analysis of Heat Transfer Refrigeration Systems of Data
Processing Units
Fabiano Stingelin Cardoso
Federal Institute of Paraná PR 466 - Gleba Pindaúva SecçãoC, Parte 2, Ivaiporã - PR, Brazil
João Nazareno Nonato
Quaresma
Federal University of Pará Street Augusto Corrêa, Guamá,Belém - PA, Brazil
Emanuel Negrão Macêdo
Federal University of Pará Street Augusto Corrêa, Guamá,Belém - PA, Brazil
ABSTRACT
It is well known that the highest temperature under which a processor can operate without mechanical and digital interruptions is 90 ° C. For that reason, by approaching the Project of heat sinks of processors concerning to computer architecture, at Courses of Computer Science. It is important to point out the use of appropriate heat sinks at long last this type of hardware can compromise the life of the computer, as well as to jeopardize the performance of software applications in case it has not had the due heat withdrawal when it is necessary to use 100% of the processing capacity. Thus the aim of this research paper is to explore the thermal transfers by using the logarithmic mean temperature difference method in an application of liquid cooling system for computer. As the cooling fluid and the liquid cooling kit achieved for the experiment are from Thermaltake, benchmark company in that segment. An experimental bench for flow measuring, of input and output temperature of fluid of water block and data collection were assembled. Under maximum working load the processor was submitted and the maximum temperatures were 75˚C with the standard fan (heatsink + cooler) and of 53˚C with the watercooler kit, at an average flow rate 2825 ml / min. The maximum operating efficiency achieved was of 0,439 Watts of energy savings in comparison with the traditional heatsink that uses ventilation. That efficiency of performance by consuming less energy and increases the processing, proves that the well-sized computer architecture for choosing processor-cooling hardware ensure satisfactory performance in software applications which require high data processing and also decrease the cost of operation of application of long term.
General Terms
Processor Architecture, Energy Efficiency, Flow Control.
Nomenclature
- Surface area of heat transfer [m²].
- Cross-sectional area of the channel.
Cp – Thermal capacity at constant pressure [J/kg.K].
- Specific heat capacity of the cooling fluid.
- Average heat transfer coefficient [W/m²].
kc – Thermal conductivity of the material.
– Mass flow.
ɳ - Efficiency of the cooling process.
– Heat rate geberated by the processor.
– Rate of heat absorbed by the coolant.
- Stationary one-dimensional heat conduction. – Convective amount of heat.
– Resistancy of constriction.
K – Thermal conductivity.
R – Thermal resistance of the medium.
– Total resistance.
TCPU – Processor temperature.
Tin - Cooling fluid inlet temperature in the water block.
Tout - Cooling fluid outlet temperature in the water block.
TWB – Interface between the heatsink and the processor.
- Maximum temperature reached by the processor
when using the cooler [K].
- Maximum temperature reached by the processor when
using the watercooler [K].
- Maximum safe temperature limit of the processor [K].
- Ambient temperature.
- Surface temperature [ ].
= Temperature of the fluid [ ].
U – Overall heat transfer coefficient.
– Overall heat transfer coefficient for the cooler.
– Overall heat transfer coefficient for the watercooler.
- Fluid speed.
- Kinematic viscosity of the fluid [m²/s].
Keywords
TDP of Processors, Thermal Transfers, Water Block, Liquid Cooling, Watercooler Kit.
1.
INTRODUCTION
Unlike conventional computers that are capable of working only with a single central processor (desktops, notebooks e tablets), servers (whether it is a super computer or a mainframe) are able to synchronize processing between multiple modules [1]. It means that hardware architecture of processor receiving boards is designed in such a way that it contributes a greater amount of processing modules that are inserted or expanded as the need of increase of processing. This procedure is known by the name of “scalability” [2].
motherboards IBM, it is possible to insert from 2 to 256 processors on a single board once all of them work together simultaneously.
Fig. 1 - Flowchart of the metology used.
Although it can vary according to the model in general the temperature of the processor is from 60 to 70°C can often reach 100°C. However, there are security mechanisms that disable the processor when the temperature exceeds this limit. Therefore considering that the motherboards already come from the factory with drilling the cooler (cooling fan) over the processor, this creates prototypes that fit the preexisting design of the board model as they are made as prototypes of
cooling nitrogen which enables the overclock of the processor, that is to say, the increase of the processing over its own limit of the factory [4].
In Data Centers, more efficient means of cooling are used in IBM mainframes as the water mixed with ethylene glycol which keeps low the temperature. In addition to these there are works about the application of hydrogen cooling process [5].
On the basis of introductory over mentioned information, this work is to analyze the thermal transfer of the processor quad-core Intel® Core ™ i5-3330 a 3.0GHz and compare the prospective experiment with the ones of other authors.
2.
METHODOLOGY
This chapter discusses about the Methodology of the experimental research used specifically about the material, the assembly steps, the hardwares and the softwares of data collection and test script aiming above all to demonstrate the apparatus and the method of DTML in order to later compare the thermal transfer through liquid cooling conversely of the traditional air cooling system.
The nature of the present work is experimental once a bench was mounted in the Hardware and Network Laboratory of Instituto Federal do Paraná – IFPR, where is analyzed the heat transfer over two cooling systems: one air cooling system and the other fluid cooling system.
Also material and methods used on it are detailed considering measuring collected data in a data acquisition unit mounted in the computer, as well as by the use monitoring software [6] for the test of processor stress. DTML method was applied by using collected data and later verified in an Excel spreadsheet and for best seeing that charts were plotted.
2.1
Experimental Bench
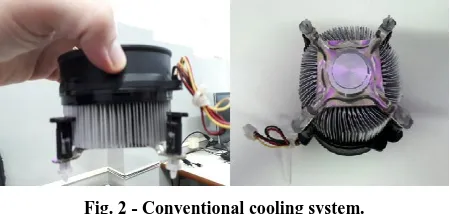
Before the experimental bench is mounted, the conventional cooling system related by an aluminum heatsink with fins and a cooler copied on top of the heatsink which were tested OCCT program, test of processor stress at 100% of its capacity as shown in Figure 2.
Fig. 2 - Conventional cooling system.
After this the bench was mounted in the computer with the following circuits:
- Cooling circuit liquid: it is composed by a pumping of liquid fluid system and a heat exchanger, type of radiator, coupled to fans. It has the function of rejecting the heat generated by the external ambient, according to the processor thermal project informs – TDP;
- Measuring and data collection circuit: responsible for the establishment and control of the temperature of the coolant in the cooling circuit.
[image:2.595.316.541.509.616.2]are there highlighted.
Fig. 3 - Experimental bench.
2.1
Materials
To project a liquid cooling system is not a simple activity, anyway it is necessary to have a great number of connections and the sizing the amount of work which will interfere directly on the suction pump power to be collected as well as the radiator which holds heat flow to be taken. Thus, as an option the assembly piece to piece of the circuit. It was chosen to obtain the complete kit all pre-dimensioned to computer of socket fitting model LGA 1155.
The complete kit of watercooler ia a Pacific 240 model, the refrigerant of Uv Coolant 1000 model, both produced by the same company, Thermaltake [7].
In Table 2.1, it is presented the detailing of items belonging to the measuring circuit.
Table 1 - Table Measuring components.
Arduino mega + USB Cable x 1
Temperature sensor DS18b20 waterproof x 2
Water flow sensor YF-S201, Flow rate 1~30L/m, Diameter 20mm x 1
Connector PWM 4 small pins x 4
Cable of 45 centimeters Sleeved x 3
Case for arduino Mega
2.2
Assembly
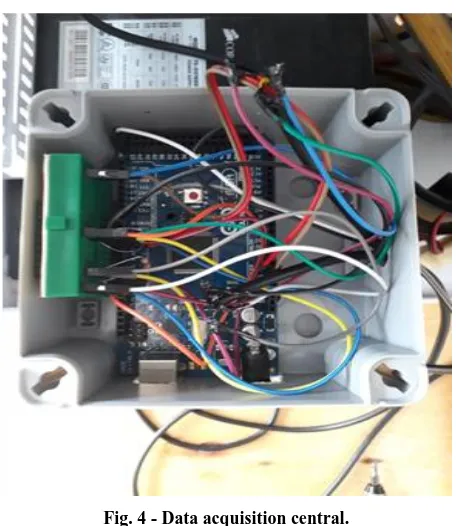
Due to Arduino microcontroller has generic usage and the ease of being available to be bought, it was chosen for the experiment. Figure 4 presents the board after the fitting of the sensor connectors.
Fig. 4 - Data acquisition central.
Due to the fact that the back of the board does not have isolation and the possibility to cause a short circuit, it was necessary to fix it inside a case for this specific purpose.
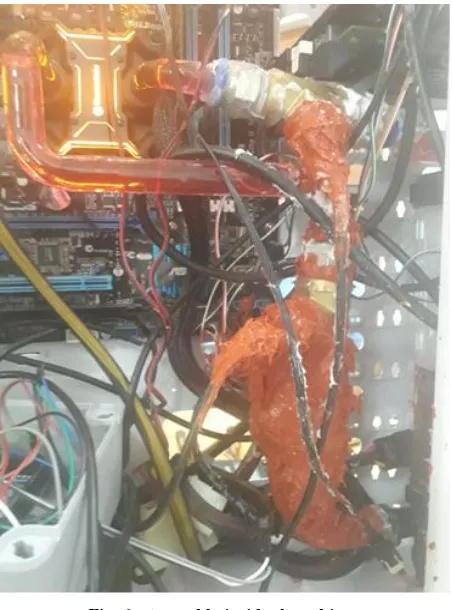
Figure 5 presents the first steps of sensors assembly and its fitting connections to the watercooler. In an extended way, Figure 6 shows the assembly inside the cabinet. First it was thought to put the inlet and the outlet fluid temperature sensors just close to the water block, nevertheless the initial test detected leaks in the thread seals where it was necessary to put silicone coating suitable to combustion engine gaskets once the own seal of the flow sensor also did not manage to contain the fluid leaks. It happens because the suction bomb model Pacific PR22 has maximum capacity of suction of 500L/Hr and when the fluid injected by it find minor entries of the flow, in this case the microchannels of the water block, it soon impacts at a partial obstruction to the flow of the coolant and to the increase of the internal pressure of the watercooler system.
[image:3.595.54.287.77.237.2]On account of that and also to avoid the fluid to release over the power supply, the connections with the sensors were positioned on the right of the power supply, CORSAIR CX430 model.
[image:3.595.323.533.580.713.2]Fig. 6 - Assembly inside the cabinet.
2.3
Softwares
[image:4.595.54.280.70.375.2]In Table 2 is presented the detailing of items to the collection of data mounted together with the liquid cooling kit.
Table 2 - Table of softwares
Microsoft Windows 7 Professional 6.1.7601.18247 (Win7 RTM)
Microsoft Excel 2010
OCCT Pro version 4.5.1
PLX-DAQ of Parallax
HWINFO64 v5.0
CPU-Z
Concerning to data collection, it used PLX-DAQ software from Parallax, which is a free software. In practice, it is a software developed at Visual Basic – VBA language which adds some resources to Excel in order to receive and craft data in real time. If data is in Excel is also possible to save them to files and it is possible to use the functions library directly from the spreadsheet which is integrated to the software.
The documentation about the PLX-DAQ is quite complete and it is easy to understand. It is available all together on the Parallax site to download [8].
2.4
Test script
Both tests of air and liquid cooling were made in controlled environment temperature at 24°C. Also the same software tools were used to the inner sensor measurement of the processor.
First it was performed a test with the conventional air
cooling, later after the change of apparatus to the liquid cooling system a second test was performed. For both of them, the tool OCCT was set up to stress the processor for 15 minutes, from those minutes, the first one and the last five ones were set up only to measure the processing with normal level of processing given that from the second through the tenth minute the tool was set up to increase to the maximum as possible the level of processing, that is, up to the limit of the processor.
While the tests were accomplished, stress data was measured by OCCT tool and also temperature data of the physical core and of the electric consumption of the processor were measured by HWINFO tool in that by the end of the tests. Data was saved and filed in monitoring reports and of charts provided by the tools themselves.
What came as different considering the liquid cooling test was the collection of data through the external sensors of the processor which were the two sensors inlet and outlet of fluid temperature of the waterblock and the flow sensor. They measured during the 15 minutes of test the variation taken in the temperature and of the speed of fluid as this data was necessary to the application of DTML method and subsequently comparison with the conventional system.
2.5
DTML Method
Both The data was based in measurements found in Pacific W2 CPU Water Block, heat exchanger that belong to the watercooler kit. Groll [9] presented a detailed model incorporated to the first law of thermodynamics as well as with the calculation of the geometric parameters, mass flow and leaks. Thus one of the geometric parameters is the microchannel which has a duct of 0,25 mm width. In addition, through observation of the CPU Water Block, it was allowed to find more measures for sizing the premises.
The cooper block at the bottom of the CPU Water block is composed for 742 fins unidirectionally pierced with transverse channels so that the coolant can find a better way to flow.
Known the presence of additives like propylene glycol and demineralized water in the mixture of the coolant, it was sought to know the physical characteristics of the fluid Thermaltake Uv Coolant 1000. In the dissertation [10] is presented the necessary data for a fluidic mixture to be known the heat transfer. Based on that, the values were obtained in the specifications manual, according it was informed by the manager responsible for the product [11].
In addition to the geometric and fluid characteristics found it was also necessary to know the thermal characteristics of the processor. In the experiment the processor used was Intel Core i5-3330. Its manufacturer, Intel, informs that the thermal sizing of the processor project - TDP in full operation is of 77 W.
Other quite important equipment present in the system is the suction bomb, [14], after all it makes possible the forced displacement of the fluid to go through the microchannels [15].
For the application of DTML model, first we found hydraulic duct diameter employed in the experiment, by Eq. (1):
Secondly, it is calculated the number of Reynolds to identify and characterize the type of flow that the heatsink has, that, depending on the generated valued can be in laminar or turbulent regime. Reynolds number is calculated by Eq. (2).
Thirdly, it is found the priority to transport fluid and for that it is used Prandtl number which physically represents the relation between the diffusion of the amount of movement by the diffusion of heat and that provides a measure of relative effectiveness concerning to movement, and also of the transport energy in the hydrodynamic and thermal layers. Prandtl number is calculated by Eq. (3):
For the experiment in particular we have the following relation of energy balance:
Heat rate generated by the processor is given by:
Heat rate absorbed by the coolant is given by:
Where, e are mass flow and specific heat capacity of
the coolant, respectively; Tout e Tin are the outlet temperature and the inlet temperature of the coolant in the water block. Once the thermal paste was applied, we assume that there was a gap between the water block and the CPU and, therefore, TCPU = TWB, in that TCPU and TWB are the temperatures of the CPU and of the water block, respectively.
Therefore, from Eqs. (7) a (8), we have global coefficients of heat transfer to cooler and to watercooler, respectively:
Heat rate absorbed by the coolant is given by:
In the Eqs. (7) e (8), U is global coefficient of heat transfer, being of air cooling and of fluid cooling in the water block; is the average energy value sink by the processor,
and being obtained HWINFO computational tool; A is the area of total contact of the CPU, in the waterblock (Note: A = Area of contact between the water block of the CPU and the processor + Area of fins inside the water block); is the
processaor temperature, obtained long after the test; is the ambiente temperature from the place where the test was performed.
Lastly, it is obtained the efficiency of the cooling process by the equations (10), convective air cooling, and (11), liquid convective cooling.
3
RESULTS AND DISCUSSION
The discussion of the results is divided in three parts. First are analized the thermal transferences occurred in two distinct ways, one by using the conventional sink and the other takes place according to geometric parameters of the Water block and the coolant. In the second part obtained values are shown and then compared with other experiments performed by other authors. The aim of this stage is to demonstrate what has of equivalence and what is lagged commenting as much as possible. Not all the details of the experiments of other authors are shown, the improvements for the thermal Exchange of the heatsink of the microchannels also the suction bomb, among others which directly impact in a better performance. Finally, in the third part heat transfer efficiency between the air cooling and the liquid cooling are identified and analyzed graphically.
3.1 Results of the Thermal Convection
The CPU temperature and the heat transfer coefficients are the indicators of performance. The whole experiment was accomplished in real ambient and in extreme processor load condition of quad-core Intel (R) Core i5-3330, 3100 MHz. The results show that with the fan and the heatsink the CPU temperature rose up to 75˚C under the full load condition. With the help of the coolant of cooling, the maximum temperature of the processor kept at the operational temperature of 53˚C, in the same load condition.
The test, as it was raised in the last chapter, was of 15 minutes and in view of the processor has four physical inner cores and each core had a value of temperature, it was used an average value of the cores, then shown by the HWINFO computational tool, such an average value can be identified in the Picture of the Appendix B, on the line of CPU Package and column Average.
The minimum temperature of the CPU with the PG / water 0,6% and 94% in volume was 41,0°C, while using the cooler and the conventional sink was of 55°C. It was noted that the use of fan and aluminum heatsink block, during the test, there were some lockings of the operational system of Microsoft Windows 7 Professional 6.1.7601.18247 (Win7 RTM) preventing the use of softwares and apps, only on the final 5 minutes, in that the processor left to be stressed by OCCT tool it was possible to use the computer normally. It stands out yet that the test was applied both with the conventional cooler and the watercooler and it was also used the CPU at 100% of its capacity, but it is important to note those lockings were not
noticed in the test with the watercooler.
[image:6.595.125.483.78.310.2]It also stands out that the turbulent flow regime for the fluid, once Reynolds number is bigger than 3000, varying between 11800 up to 12600. The quantity of energy sink in various maximums taken by the HWINFO computational tool was of 52 Watts and the average of 48.208 Watts. Thus, the chart presented in Figure 8 shows the quantity of heat sink for the coolant which in its maximum value calculated was 50.850, far close to the real value provided by the HWINFO computational tool.
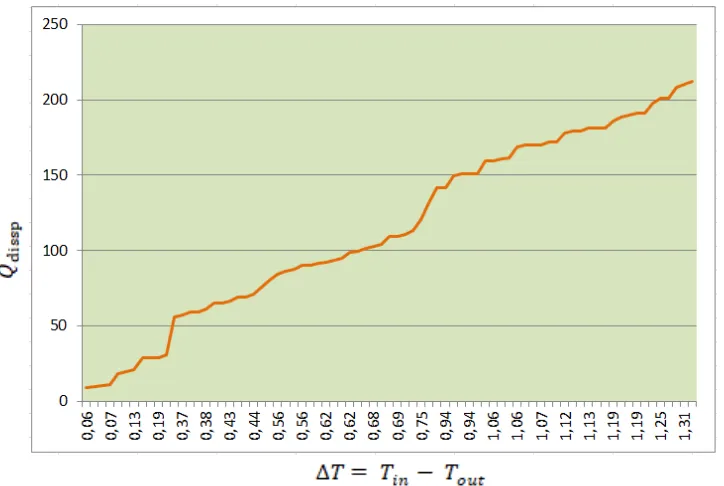
It is observed that the heat transfer rates did not increase circumstantially in terms of the stress of the processor, according is in char of Figure 5.3, from the beginning to the end of the test of 15 minutes, the variation was of the range of 0,06 and 1,31ºC, that is to say. This variation is the limit from the outline of the stress test of the processor so that it does not exceed 53ºC, in its maximum value, demonstrating with that the stability of the liquid cooling. Table 3 presents the maximum values of the thermal convection for the watercooler.
Table 3 - Maximum values of the thermal convection to the watercooler.
Verified Data Values
Volumetric flow rate [ml/min] 153,91
Mass flow [kg/s] 155,14
Reynolds 12580,40
Heat transfer rate for the fluid [W] 212,18
Fig. 8 - Chart of the dissipated heat rate by the processor according to the quantity of heat absorbed by the coolant.
[image:7.595.118.480.379.622.2]The effect of the temperature variation between the inle t and the outlet of the waterblock of the coolant can be observed in terms of heat sink rate by the processor on the surface of the thermal exchange contact, accorfing to informed values in Figure 9.
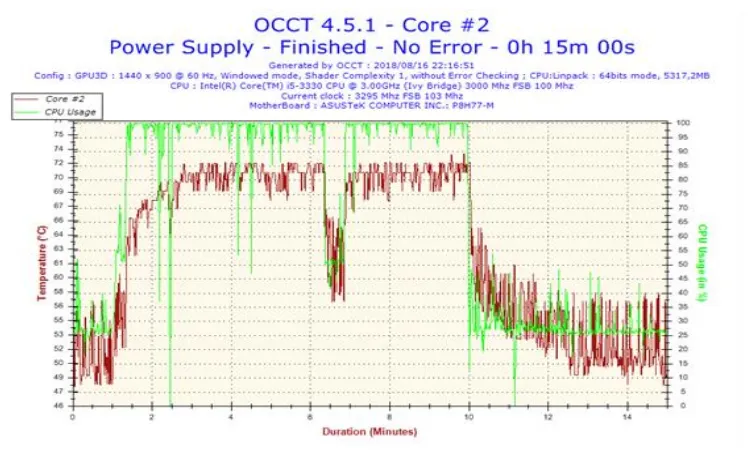
It Figure 10 presents the chart of the use of the processor in terms of time, with the cooling system of the watercooler, it should be noted on the left lateral measurements of temperature and on the right lateral measurements of the use of CPU.
Although the processor has four inner cores, the core which had the larger values of mediation was the of number “#2”. For that reason, both Figures: 10 e 11 were presented.
Since 2002 in which the first watercooler was launched commercially there were many advances that propitiated the improvement of processors cooling. Fair enough, this topic aims to compare the object of the experimental study, processor and watercooler, both current technologies, compared with data raised of other authors.
[image:8.595.90.512.83.312.2]To compare the results found it was brought an article entitled “Replacement of heat sink fan by nano coolants for enhancement of CPU efficiency for Nano coolants”, published by Siddique and Prabhu [16]. That article is about the
[image:8.595.109.484.487.713.2]Fig. 11 - Chart of the temperature monitoring and the use of CPU for the air cooling system.
conventional cooling for ventilation, also for deionized water and water with fractions of nanoparticles of titanium dioxide – TiO2 and of copper – Cu.
It is observed in the above mentioned work that the CPU temperature with the heat sink under the full load of the CPU reaches 90°C. The average temperature of the CPU with Cu 0,01% in volume was 56,1 ° C and with Cu 0,1% in volume
[image:9.595.131.467.172.322.2]was 54,9°C. The average temperature of the CPU with deionized water was 58,7˚C and the average temperature with TiO2 in volume 0,01% was 57,6˚C and with TiO2 in volume 0,1% was of 57,2˚C, all with 500 ml / min flow.
Table 4 brings this data with temperatures over mentioned in comparison with collected data in the present experiment.head.
Table 4 - Comparative data.
Cooler Heatsink Watercooler
Data
Air Thermaltake Coolantdeionized water
TiO2 Cu
The author
himself 75° C 53°C
-
-
-
SIDDIQUE and PRABHU
(2013)
90° C
-
58,7°C 57,6°C 54,9°CIt is important emphasize that the experiment used processor quad-core Intel® Core ™ i5-3330 a 3.0GHz while the compared work used the quad-core Intel® Core ™ i5-2310 processor model to 2.9GHz. There is a very subtle relationship between the frequency of the processor and the heat generated, as shown [17] where it is possible to analyze a brief correlation between the heat flow and the frequency of the CPU.
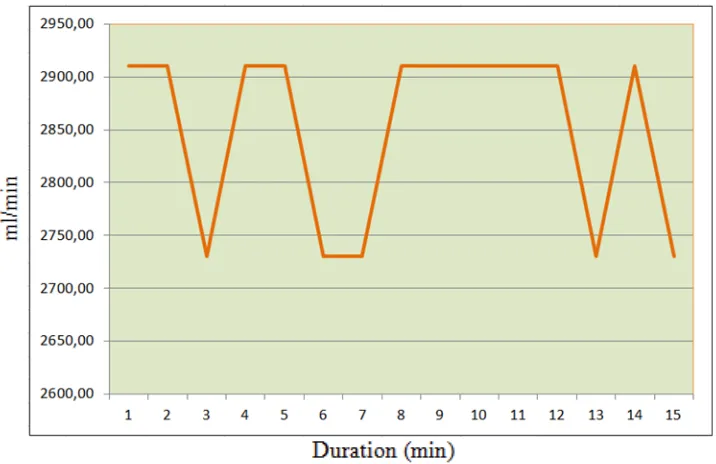
At this point, the processor used in the experiment is 1.0 MHz faster than the comparative study of Siddique and Prabhu, that is to say, from 2.9GHz to 3.0GHz, what naturally leads to thinking that the heat flow be larger. The comparative study used the frequency of suction bomb in 500 mL/min, given that in the experimental study it varied between 2750 and 2900 mL/min, a value well above and for this reason it is understood the fact to have reached values below than the compared with scattered particles in the fluid of the comparative work.
The work of Siddique and Prabhu presented as minimum possible temperatures, the value of 54,9°C for its respective liquid fluid cooling system, while the present liquid cooling system addressed in this work presented the minimum temperature of 53°C, therefore it identifies as more efficient.
3.2 Discussion about the Efficiency
To create a processor, the manufacturers perform various tests putting the chip, that is to say, on fire proof, that is, in very close situations of overclock, once the cooling systems are
conventional. And it is through initial analysis that it possible to obtain the thermal energy of the project - TDP. A maximum load test is performed determining how much energy the processor tends to release.
After having a value, the manufacturers informed the TDP to make companies which create cooling systems can manufacture compatible and efficient products to the sink of heat of the model in question. This way by using the monitoring software CPU-Z [18] on the present experiment, it informs the maximum value for the TDP which is of 77,0 W.
With this information to analyze the test, it was observed that as in the use of the conventional cooler (INTEL) or of the watercooler (Thermaltake) the consumption in Watts it was low 52W, that is, inferior to 77W do TDP, by that it is possible to note that both systems have suitable efficiency in order the processor does not risk of being damaged.
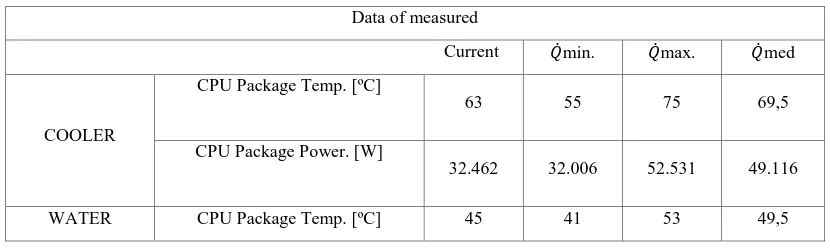
Other aspect is related to the efficiency, that is the relationship which is the relationship between the increase of cooling and the decrease of the energy consumption by the processor. On this particular aspect the Table 5 presents collected data of the HWINFO computational tool [19].
Table 5 - Measuring for computational tool HWINFO.
Data of measured
Current min. max. med
COOLER
CPU Package Temp. [ºC]
63 55 75 69,5
CPU Package Power. [W]
32.462 32.006 52.531 49.116
[image:9.595.90.505.639.763.2]COOLER
CPU Package Power. [W]
32.300 32.126 52.950 48.205
It is notable the decrease of the maximum consumption in 0,439 W at the same conditions of test and time of reading, at the present case to 10min and 15s approximately.
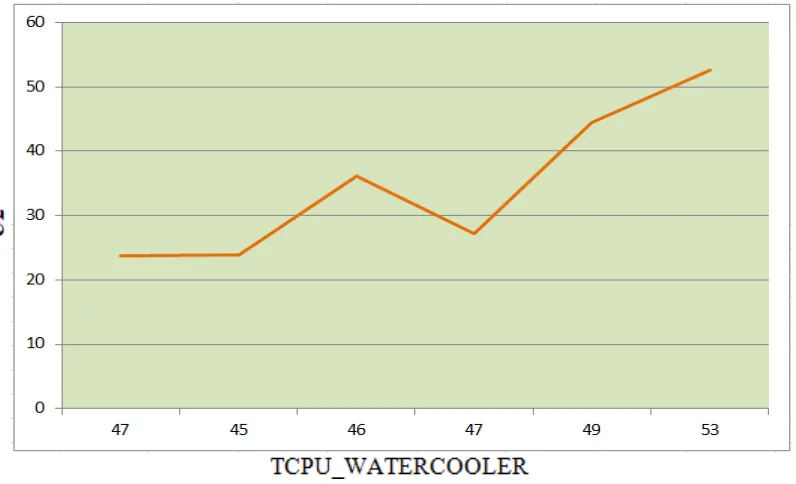
The effect of the fractions of the flow rate and volume can also be observed in terms of convective coefficient heat transfer (U) on the surface of the water block.
The average coefficient of the heat transfer calculated was 60 W/cm².K, to coolant Thermaltake. The average flow was kept
constant at 2825 ml/min.
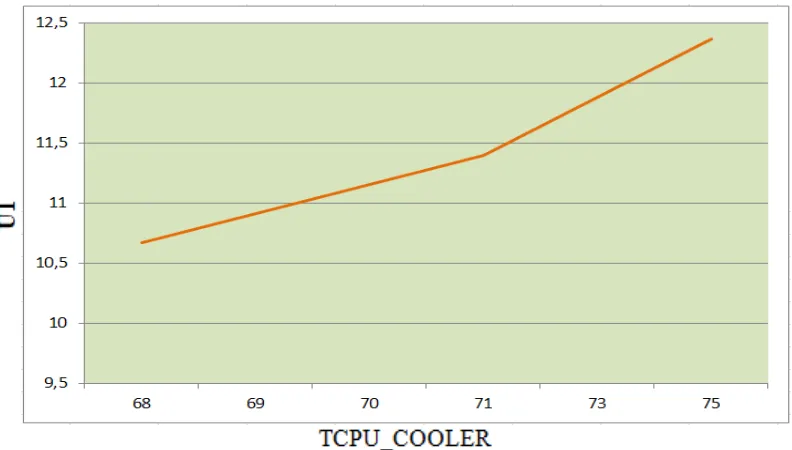
[image:10.595.103.501.242.484.2]In Figures 12 and 13 are presented the global coefficients of heat transfer (U) depending on the temperature of the CPU that for the matter of using more significant data it was limited to an interval of 5 to 10 minutes, period when the temperature increased the most and even accentuated, with that the most crucial moments were analyzed for heat transfer coefficient inside of each of two cooling systems.
To be calculated the efficiency of the cooling systems it was highlighted the efficiency of 41% to the liquid cooling and only 10,19% to the air cooling system.
Thus it is clear that the use of the air cooling has become more inviable in face of new technologies of processing data and in every each cycle, understood here as Moore law – the number of chip transistors would had an increase of 100%, at the same cost, at each period 18 months really demonstrates the tendency the increase of the heat flow and the need of safer and more efficient cooling.
4
CONCLUSION
After the detailed study, totally based on experimental researches, also scientific and bibliographic, it is possible to sum up that the present study showed a nice analysis to extract the sink heat of quad-core Intel® Core ™ i5-3330 processor to 3.0GHz, once it is capable to cool it at a suitable operational temperature. There was a significant decrease of the operational temperature of the processor with coolant Thermaltake in comparison with experimental nano coolants fluids used by Siddique and Prabhu, and the fact of being superior to the conventional heatsink.
The CPU temperature with the conventional heatsink under full load of the CPU reached the maximum value of 75° C. With the use of coolant Thermaltake and the watercooler the temperature decreases to 53° C under the same processor load.
The global coefficient of the heat transfer in the liquid system, coolant Thermaltake to the water block, also increased considerably with the raise of flow. It is evident when compared to the 500 ml/min used in Siddique and Prabhu´s work.
Referring to the electric consumption of the conventional heatsink and of the watercooler, both used the connection of the motherboard CPU_FAN, that is, the same 12 volts. Thus, there no adds of significant consumption even though it was observed the electric economy by the processor in 0,439 W.
The developed study itself is not unheard, nevertheless the technology employed in the scientific study is current, thus from time to time works like these need to be developed to
described and to be detailed the advances found in terms of heat flows of data processing units and the cooling systems.
Other relevant fact of the experimental research was to conjugate the modelling of thermal transfer with some computational tools of performance monitoring to processing of data. This allows to disseminate the knowledge about the new computational tools linked to that niche, as well as its applications in scientific researches.
Therefore, the work showed clearly that the junction of: coolants, flow velocity (in terms of the suction bomb) and the thermal exchange area of the block on the surface of liquid contact are efficient mechanisms to desktops current computers and also promising processors used with the aim of scientific research, supercomputers or any electronic system where the heat generation is one of the great problems. The significant decrease in the operational temperature makes the reliability increase and the space for the maximum use of the electronic device, in case of CPU. The sorting of fluids does not need only to be based on in its thermal performance but also in its readiness characteristics, cost, toxicity, inflammability and corrosion.
5
ACKNOWLEDGMENTS
The prerogatives to conduct this work like for example the place where the liquid cooling system would be mounted and tested as well as necessary tools were given by Instituto Federal de Educação, Ciência e Tecnologia do Paraná - IFPR.
6
REFERENCES
[1] MANO, M. M. Computer system architecture, 1993. Prentice Hall, v. 3, 1993.
[2] VERAS, M.V.S.N. Data Center. Componente central da infraestrutura de TI. Brasport, 2009.
[3] LORENZONI, R. K. Análise de desempenho e consumo energético entre processadores arm e x86. 2012.
[image:11.595.102.498.79.304.2]que- e-overclocking-entenda- quais-vantagens- e-riscos- para-o- seu-pc.html> Acesso em: Abril de 2018.
[5] LEE, M., KWANG, K., HOPKINS, R., GAWLIK, K. Thermal conductivity measurements of copper-coated metal hydrides (LaNi5, Ca0.6Mm0.4Ni5 and LaNi4.75Al0.25) for use in metal hydride hydrogen compression systems. Int J Hydrogen Energy, v. 34 (7), pp. 3185-3190, 2009.
[6] OCCT Pro. Disponível em:
<http://www.ocbase.com/index.php/download>. Acesso em: Fevereiro de 2019.
[7] KIT THERMALTAKE. Disponível em: < https://www.thermaltake.com/liquid_cooler/liquid_coole r_/lcs_kits/c_00002571/pacific_rl240_water_cooling_kit/ Design.htm>. Acesso em: Junho de 2018.
[8] PARALLAX. Disponível em:
<https://www.parallax.com/downloads/plx-daq>. Acesso em: Julho de 2018.
[9] GROLL, E. et al. Mathematical modeling of scroll compressors—part I: compression modeling. International Journal of Refrigeration, v.25, pp. 731-750, 2002.
[10]OLIVEIRA, Rony. Análise da Transferência de Calor de Fluidos Térmicos aditivado com Etilenoglicol e Polímeros. Natal/ RN. Dissertação (mestrado) – Universidade Federal do Rio Grande do Norte, Centro de Tecnologia, 2016.
[11]CHEN, W. Capacidade Calorífica Específica. Disponível em:
<http://static.highspeedbackbone.net/pdf/Thermaltake%2 0Liquid%20Cooling%20UV%20Sensitive%20Coolent% 20Datasheet.pdf>. Acesso em: Julho de 2018.
[12] HAYWOOD, A.M. et al. Investigating a relationship among CPU and system temperatures, thermal power, and CPU tasking levels. In: 13th IEEE intersociety conference on thermal and thermomechanical phenomena in electronic systems (ITherm), San Diego, 2012.
[13] UPADHYA, G. et al. Micro-scale liquid cooling system for high heat flux processor cooling applications. In: 22nd IEEE Semi-therm Symposium, 2006.
[14] BEJAN, A., ERRERA, M. Deterministic tree networks for fluid flow: geometry for minimal flow resistance between a volume and one point. Fractals, v. 05, n. 04, p. 685-695, 1997.
[15] BUCCI, A. et al. Water single-phase fluid flow and heat transfer in capillary tubes. In: 1st International Conference on Microchannels and Minichannels, pp. 319-326, January 1st, 2003.
[16] SIDDIQUE, A. B., PRABHU, K. N.; Replacement of heat sink fan by nano coolants for enhancement of CPU efficiency, National Conference on Challenges in Research & Technology in the Coming Decades, 2013.
[17] MIHAI, I. Heat Transfer in Minichannels and Microchannels CPU Cooling Systems, Heat Transfer - Theoretical Analysis, Experimental Investigations and Industrial Systems, Prof. Aziz Belmiloudi (Ed.), University of Suceava – Romania, 2015.
[18] CPU-Z. Disponível em: <
https://www.cpuid.com/softwares/cpu-z.html>. Acesso em: Fevereiro de 2019.