RESEARCH ARTICLE
A STUDY ON ACTINOMYCETES POPULATION AND PHYSICO CHEMICAL PROPERTIES OF SHORE
LINE SOIL FROM SELECTED COASTAL AREAS OF TAMIL NADU
Febina Bernice Sharon, S. and *Rachel Regi Daniel
Department of Botany and Microbiology, Lady Doak College, Madurai – 625002, Tamil Nadu, India
ARTICLE INFO ABSTRACT
Shore line soil samples were collected from twelve different coastal areas of Tamil Nadu and tested by dilution plating technique on Starch casein and Kuster’s agar medium to assess the actinomycetes diversity. Physico chemical characteristics of the soil such as pH, temperature, electrical conductivity, salinity, total dissolved solids, moisture content, water holding capacity, carbon, nitrogen, hydrogen and sulfur content were analyzed to find out the impact on actinomycetes population. A total number of 376 actinomycetes were recorded from all the shoreline soil samples. Physico chemical analysis revealed the variations of parameters in each sampling sites. Correlation analysis made between physico chemical properties of shore line soil and actinomycetes population revealed no factor as accountable for the actinomycetes population changes in different sampling sites. Multivariate cluster analysis statistical technique was applied to evaluate the variations in shore line soil quality of different sampling sites.
Copy Right, IJCR, 2012, Academic Journals. All rights reserved.
INTRODUCTION
India has a coastline stretches about 7500 km in which Tamil Nadu, the southernmost state of the Indian Peninsula, has a length of about 1076 km constitutes about 15% of the total coastal length of India and stretches along the Bay of Bengal, Indian Ocean and Arabian Sea and lies between 8° 5" to 13° 35" N and 76° 15" to 80° 20" E (Muthukrishnan and Aruchamy, 2012). Tamil Nadu coastal environment plays an important role in country's economy by natural resources and rich biodiversity (Muthukrishnan and Aruchamy, 2012). Currently, Tamil Nadu coastline is facing increasing human and natural pressures like overexploitation of marine resources, dumping of industrial and toxic wastes, oil spills, tsunami which has resulted in substantial damage to its ecosystems including microbes. Environmental conditions such as pH, electrical conductivity, salinity, carbon, nitrogen, temperature and nutrients influence the composition, distribution and growth of its biota (Swami et al., 2000; Satheesh Kumar and Anisa Khan, 2009). Actinomycetes are gram positive, filamentous bacteria which are excellent secondary metabolite producers (Olano et al., 2009). At present actinomycetes from terrestrial origin produce hundreds of antibiotics which are used commercially as antibiotics, anti cancer drugs, immunosuppressive agents etc (Sathish Kumar and Kokati Venkata Bhaskara Rao, 2012). Some differences could be expected among actinomycetes prevailing in marine and coastal environments due to variation in the physical, chemical and biological factors (Kumar Saurav and
*Corresponding author: rachelregi@yahoo.com
Kannabiran, 2010; Sathish Kumar and Kokati Venkata Bhaskara Rao, 2012). In this present study the physico-chemical parameters of shoreline soil of selected locations of Tamil Nadu coast of India with respect to actinomycetes population was reported.
MATERIALS AND METHODS
Soil sample collection
The shore line soil samples were collected from twelve different locations of Tamil Nadu, India namely, Chennai
(13003’02.05’’N and 80016’58.81’’E), Mahabalipuram (12036’
43.64’’N and 80011’48.92’’E), Nagore (10048’ 49.23’’N and
79051’04.98’’E), Velankanni (10040’52.03’’N and 79051’
12.85’’E), Kodiyakarai (10016’59.55’’N and 79049’ 56.15’’E),
Tuticorin (8043’31.97’’N and 78009’21.70’’E), Tiruchendur
(8029’46.36’’N and 78007’46.24’’E), Kulasekarapattinam
(8023’44.97’’N and 78003’30.95’’E), Uvari (8016’31.67’’N
and 77053’26.22’’E), Kudankulam (8009’26.59’’N and 77038’
28.44’’E), Kanyakumari (8004’38. 73’’N and 77033’04.35’’E)
and Medalam (8012’09.69’’N and 77012’54.95’’E) , during the
period of June and July 2012. The location of the sampling sites was in figure 1. The soil samples were collected from 15 cm depth using sterile spatula, and brought to the laboratory in sterile polythene containers and used for physico chemical and
microbiological analysis. In situ observations of the sampling
site are tabulated in Table 1.
ISSN: 0975-833X
International Journal of Current Research
Vol. 4, Issue, 12, pp. 441-445, December,2012
INTERNATIONAL JOURNAL OF CURRENT RESEARCH
Article History:
Received 21th September, 2012
Received in revised form 30th October, 2012
Accepted 23rd November, 2012
Published online 28th December, 2012
Fig. 1: Map of the study area showing sample location points
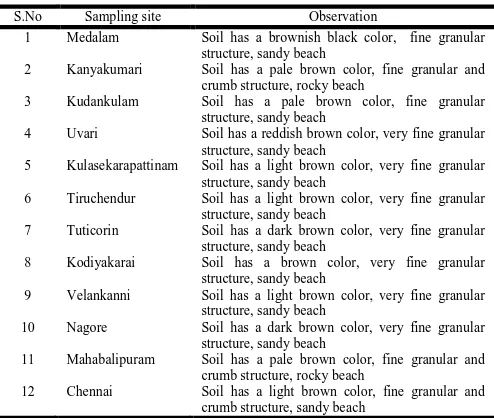
Table 1. In situ observations for each sampling site
S.No Sampling site Observation
1 Medalam Soil has a brownish black color, fine granular
structure, sandy beach
2 Kanyakumari Soil has a pale brown color, fine granular and
crumb structure, rocky beach
3 Kudankulam Soil has a pale brown color, fine granular
structure, sandy beach
4 Uvari Soil has a reddish brown color, very fine granular
structure, sandy beach
5 Kulasekarapattinam Soil has a light brown color, very fine granular
structure, sandy beach
6 Tiruchendur Soil has a light brown color, very fine granular
structure, sandy beach
7 Tuticorin Soil has a dark brown color, very fine granular
structure, sandy beach
8 Kodiyakarai Soil has a brown color, very fine granular
structure, sandy beach
9 Velankanni Soil has a light brown color, very fine granular
structure, sandy beach
10 Nagore Soil has a dark brown color, very fine granular
structure, sandy beach
11 Mahabalipuram Soil has a pale brown color, fine granular and
crumb structure, rocky beach
12 Chennai Soil has a light brown color, fine granular and
crumb structure, sandy beach
Analysis of Physico-Chemical Characteristics of Soil
Initial measurements on pH, temperature, electrical
conductivity, salinity, total dissolved solids were done by Multi-Parameter PCS Testr TM series (Eutech Instruments, Oakton) by suspending soil in distilled water. Ten ml of distilled water was taken in a beaker and the soil was added till the volume became 15ml and again 15 ml of distilled water was added. It was stirred well using glass rod and the soil was allowed to settle. Moisture content was estimated by finding the weight difference of known quantity of soil before and
after keeping the soil in hot air oven at 600C for 6 hours.
Water holding capacity of the soil was done by adding water to the known quantity of dried soil in a beaker and incubated it over night. Drain water and note down the weight of the soil. The difference between the weight of moist and dried soil gave the result of water holding capacity. Carbon, Nitrogen, Sulfur and Hydrogen contents were analyzed by Elementar analyzer. Vario EL Elementar analyzer is a fully automatic instrument which enables a speedy quantitative analysis of CHNS. The soil samples were grinded using Pestle and Mortar and, sieved through fine mesh sieve. The homogenized soil sample was packed in Tin foil weighed and placed into the carousel of the automatic sample feeder. Carrier gas was Helium and Combustion gas was oxygen. The soils were
heated to 12000C and then processed. Sulphanilic acid was
used as standard. The results were recorded in computer by WinVar software.
Sample Treatment
Soil samples were dried in room temperature for 24 hours. All
the soil samples were diluted up to 10-7 in sterile saline
solution prior to inoculation in the petriplates.
Isolation of Actinomycetes
Isolation of actinomycetes was carried out by spread plate technique (Collins et al., 1989). Starch Casein agar and Kuster’s agar were used for the isolation and enumeration of actinomycetes. The medium was supplemented with 100µg/ml cyclohexamide. Using conventional dilution plate technique, 1gm of marine soil sample was suspended in 10 ml of sterile
saline and serially diluted to 10-7 dilution. 0.1 ml of
suspension from 10-3 to 10-7 dilutions were poured over the
agar medium in separate plates and spread by sterile L rod.
These plates were incubated for 15 days at 250C.
Statistical Analysis
Correlation was done to understand the relationship between the various parameters and to test the significance of the shore line soil with actinomycetes population. It was considered to be significant when the value of the probability of significance (P) was greater than 0.05 (Senthil kumar et al., 2011; Satheeshkumar and Anisa Khan, 2009). All these statistical analyses were performed using Microsoft Excel 2010 (Microsoft Corporation, USA). Bray-Curtis similarity was analyzed using PAST 2.16.
RESULTS AND DISCUSSION
Physico chemical properties of the shore line soil showed variations in different sampling sites. The pH of the soils ranged from 6.9 to 8.4 indicating that all the shore line soils were alkaline in nature except Uvari soil (pH 6.9). The maximum pH was observed in Medalam and Nagore shore line soils. When the hydrogen ion in the sample increased, pH got decreased. Alkaline condition was explained as the characteristic feature of marine and marine influenced habitats which were well adopted to grow in alkaline pH (Nadimuthu, 1998; Madhanraj et al., 2010). Hence, the actinomycetes population did not seem to be influenced by it. The
temperature of the sample sites ranged from 270C to 310C.
Actinomycetes grew well between 250C to 350C, so the
change in temperature in different sampling site did not affect the actinomycetes population. Electrical conductivity revealed variations from 2.15 to 14.87. The shore line soils of
Kanyakumari, Mahabalipuram and Chennai showed
[image:2.595.38.285.252.461.2](5.004%) while Velankanni shore line soil showed maximum nitrogen content (0.658%). Sulfur (0 to 0.072%) and hydrogen content (0 to 0.081) were very low and absent in few sampling site. From correlation analysis it could be inferred that, change in electrical conductivity, significantly affected the total dissolved solids in the shore line soil samples, Change in temperature did not bring about any significant change in total dissolved solids. Change in the electrical conductivity significantly affected the salinity and moisture content of the shore line soil. Alteration in total dissolved solids significantly affected the salinity and moisture content of the shore line soil. Variation in pH significantly affected the hydrogen, nitrogen and sulfur content in the shore line soil samples. Change in hydrogen content significantly affected the sulfur and nitrogen content. Variation in sulfur content did not bring about significant changes in the carbon content in the shore line soil samples. Variations in nitrogen content significantly did not affect the carbon content of the shore line soil samples. The correlation analysis revealed that the physico chemical properties did not have any relationship with actinomycetes population. Dendrogram indicated the Bray-Curtis similarity for physico-chemical parameters of shore line soil and actinomycetes population (Fig. 4).
2a) CHNS content in Tiruchendur soil
2b) CHNS content in Mahabalipuram soil
2c) CHNS content in Sulphanilic acid
2d) CHNS content in Medalam soil
Figure: 2 Results of elementar analysis
Actinomycetes colonies grown in Starch casein agar in Kudankulam and Medalam soil
Figure: 4 Dendrogram of Physico-chemical parameters of shore line soil characteristics and actinomycetes population
The dendrogram (Fig. 4) showed the cluster being combined and the values of the coefficient at each step. The above given results clearly showed that the groupings could be well known that apparently revealed the differences in shore line factors and actinomycetes population within coastal areas of Tamil Nadu.
Table:2 Physico-Chemical Parameter of the shore line soil samples S a m p li n g s it e p
H Tem
p e ra tu re ( 0 C) E C (m S ) T D S (p p t) S a li n it y (p p t) M C (% ) W H C (% ) Ca rb o n c o n te n t N it ro g e n Co n te n t S u lp h u r Co n te n t H y d ro g en Co n te n t A c ti n o m y c e te s
S1 8.4 31
.4 7 .2 4 4 .9 5 3 .8 5 1 3 .5 3 1 2 .8 0 0 .1 8 5 0 .4 6 4
- 0.1
1
2
3
5
S2 7.2 29
.2 2 .1 5 1 .5 5 1 .1 2 2 .0 1 1 3 .1 5 2 .9 8 7
- - - 14
S3 7.5 27
.6 1 3 .6 2 9 .9 1 8 .1 1 1 7 .7 0 1 1 .2 2 1 .5 4 0
- - - 34
S4 6.9 27
.3 1 3 .5 9 9 .6 8 7 .9 0 1 8 .9 5 9 .6 7 1 .0 0 9
- - - 41
S5 7.3 28
.1
8
.5 6.00 4.70 11.1
0 1 3 .2 7 3 .4 7 8
- - - 25
S6 7.4 27
.2 1 4 .8 7 7 .4 4 8 .8 9 2 0 .2 0 1 2 .2 1 5 .0 0 4
- - - 19
S7 7.4 26
.9 1 3 .4 2 9 .5 0 7 .7 4 2 4 .8 6 1 5 .4 1 4 .2 8 7
- - - 31
S8 8.3 28
.4 1 3 .7 0 9 .6 9 7 .9 1 1 7 .7 4 1 1 .1 2 0 .7 9 2 0 .6 1 0 0 .0 5 2 0 .0 8 1 1 8
S9 8.3 28
.5 9 .9 3 7 .0 2 5 .5 8 1 6 .0 7 1 1 .2 7 0 .1 1 0 0 .6 5 8 0 .0 6 1 0 .0 5 5 3 2
S10 8.4 28
.7 8 .9 1 6 .2 6 5 .0 1 1 4 .8 7 1 0 .1 5 0 .0 5 9 0 .5 2 5
- 0.0
0 9 3 4 S1 1 7
.8 30.5 3.65 2.55 1.90 13.4
7 1 3 .0 6 0 .0 6 4 0 .5 8 0 0 .0 4 7 0 .0 3 8 5 2
S12 8.0 30
.5 3 .1 8 2 .2 5 1 .6 6 1 8 .0 1 1 6 .7 2 0 .2 1 8 0 .5 0 0 0 .0 7 2 0 .1 4 0 4 1
S1 – Medalam, S2 – Kanyakumari, S3 – Kudankulam, S4-Uvari, S5- Kulasekarapattinam, S6- Tiruchendur, S7-Tuticorin, S8-Kodiyakarai, S9-Velankanni, S10- Nagore, S11-Mahabalipuram, S12-Chennai, EC – Electrical Conductivity, MC- Moisture Content, WHC – Water Holding Capacity, TDS-
Total Dissolved Solids, CHNS contents are expressed in terms of µg/g
Table: 3 Correlation values for physico-chemical properties of soil and actinomycetes
p
H Tem
p EC TD S S a li n ity M C WH C H C o n te n t S C o n te n t N C o n te n t C C o n te n t A c ti n o m y c e te s p H 1 Te m p 0 .3 8 9 1
EC -0.2
2 0 -0 .5 2 2 1 TD S -0 .1 3 4 -0 .6 6 * 0 .9 5 2 * 1 S a li n ity -0 .1 9 0 -0 .4 9 3 0 .9 9 5 * 0 .9 5 4 * 1 M C 0 .0 4 3 0 -0 .2 5 8 0 .6 4 6 * 0 .6 7 8 * 0 .7 0 1 * 1 WH C -0 .0 4 9 0 .2 7 8 -0 .4 8 0 -0 .4 8 6 -0 .4 6 1 0 .0 6 1 1 H C o n te n t 0 .7 7 1 * 0 .5 3 9 -0 .5 5 4 -0 .4 4 9 -0 .5 0 3 -0 .0 3 6 0 .1 3 8 1 S C o n te n t 0 .4 4 6 0 .2 8 5 -0 .3 9 5 -0 .3 1 3 -0 .3 5 0 0 .0 4 4 0 .2 0 1 0 .8 0 5 * 1 N C o n te n t 0 .8 9 2 * 0 .3 8 8 -0 .3 7 6 -0 .2 6 6 -0 .3 3 9 -0 .0 0 7 -0 .0 4 9 0 .9 3 3 * 0 .7 5 1 * 1 C C o n te n t -0 .6 5 5 * -0 .1 8 2 0 .4 0 4 0 .2 0 7 0 .3 7 0 0 .1 1 7 0 .2 4 3 -0 .7 7 6 * -0 .5 4 5 -0 .7 9 6 * 1 A c ti n o m y c e te s 0 .1 3 5 0 .1 1 4 -0 .3 1 7 -0 .1 5 0 -0 .2 4 6 0 .2 7 2 0 .0 8 3 0 .5 3 3 0 .3 9 9 0 .3 4 5 -0 .5 8 5 1
*P>0.05 EC – Electrical Conductivity, MC- Moisture Content, WHC – Water Holding Capacity, TDS- Total Dissolved Solids
Acknowledgement: Authors thank Mr. Innocent in Science Instrumentation center, Lady Doak College for helping in doing Elementar analysis.
REFERENCES
Collins, C.H., Lyne, P.M. and Grange, J.M. 1989. Collins and Lyne’s Microbiological Methods (VI edition). Butterworth and Co. Ltd. London.
Kumar Saurav, and Kannabiran K. 2010. Diversity and Optimization of process parameters for the growth of VITSVK9 spp. Isolated from Bay of Bengal, India. J Nat Env Sci., 1:56-65.
soils of Tamil Nadu coast, India, Adv. in Appl. Sci. Res., 1:3160-167.
Muthukrishnan, A. and Aruchamy, S. 2012. Status of coastal ecosystems through geospatial techniques for degraded coast of Gulf of Mannar. Int. J. of Geomatics and Geosciences., 3(1) 134-156.
Nadimuthu, N. 1998. Studies on the fungi of the coral reef environment of the gulf of Mannar, Biosphere Reserve, India, Ph.D. thesis, Annamalai University, India.
Olano, C., Mendez, C., and Salas, J.A. 2009. Antitumor
compounds from marine actinomycetes. Mar. Drugs., 7: 210-248.
Satheeshkumar, P. and Anisa Khan, B. 2009. Seasonal Variations in Physico-Chemical Parameters of Water and Sediment Characteristics of Pondicherry Mangroves, Afr. J. of Bas. & App. Sci., 1 (1-2): 36-43.
Sathish Kumar, S.R. and Kokati Venkata Bhaskara Rao. 2012. In-vitro antimicrobial activity of marine actinobacteria against
multidrug resistance Staphylococcus aureus., Asian Pac. J. of
Trop. Biomed., 2(10): 787-792.
Senthil kumar, D., Satheeshkumar, P. and Gopalakrishnan, P. 2011. Ground Water Quality Assessment in Paper Mill Effluent Irrigated Area - Using Multivariate Statistical Analysis. World App. Sci. J., 13 (4): 829-836.
Swami, B., S. Suryawanshi, and Karande, A. 2000. Water quality of Mumbai harbour - an update. Indian J. Marine Sci., 29: 111-115.